Recognition Method of Abnormal Behavior of Marine Fish Swarm Based on In-Depth Learning Network Model
Liyong Chen1,* and Xiuye Yin2
1School of Network Engineering, Zhoukou Normal University, Zhoukou 466001, China
2School of Computer Science and Technology, Zhoukou Normal University, Zhoukou 466001, China
E-mail: 20111036@zknu.edu.cn
*Corresponding Author
Received 30 October 2020; Accepted 30 October 2020; Publication 03 May 2021
Abstract
In order to solve the problem that individual coordinates are easily ignored in the localization of abnormal behavior of marine fish, resulting in low recognition accuracy, execution efficiency and high false alarm rate, this paper proposes a method of fish abnormal behavior recognition based on deep learning network model. Firstly, the shadow of the fish behavior data is removed, and the background image is subtracted from each frame image to get the gray image of the fish school. Then, the label watershed algorithm is used to identify the fish, and the coordinates of different individuals in the fish swarm are obtained. Combined with the experimental size constraints and the number of fish, and combined with the deep learning network model, the weak link of video tag monitoring of abnormal behavior of marine fish is analyzed. Finally, the multi instance learning method and dual flow network model are used to identify the anomaly of marine fish school. The experimental results show that the method has high recognition accuracy, low false alarm rate and high execution efficiency. This method can provide a practical reference for the related research in this field.
Keywords: In-depth learning network model, marine fish swarm, abnormal behavior, recognition.
1 Introduction
The colony behavior of fish swarm is one of the important behaviors of fish. Fish swarm behavior is one of the important behaviors of fish. More than 50% of the fish have group behavior [1]. They inhabit in groups, escape from the enemy, or migrate. There are many reports about the recognition of abnormal behavior of marine fish. Wu et al. [2] established a training model to extract features by using convolutional neural network. Meanwhile, the discriminating feature information was filtered out to recognize the abnormal behavior of fish school via combining with the adaptive pool layer. Lu et al. [3] took Koi as the research object, and the motion characteristic parameters of the fish school under normal oxygen and low oxygen conditions were obtained. Through the utility of the image processing technology, the position histogram of the fish school was obtained, and the average deviation of the fish position and posture was obtained, thus, composing the motion characteristic parameters of the fish school in each image. Chen et al. [4] gathered the images of normal state and feeding of fish through the camera, and then the images were preprocessed, 13 texture features of fish were extracted by gray difference statistics. Finally, the support vector machine was used to classify and recognize the behavior of fish swarm. There are obvious defects in the above methods. Due to the neglect of the individual coordinates in the marine fish swarm, thus, resulting in low recognition accuracy, execution efficiency and high false alarm rate. Therefore, an in-depth learning network model was proposed to recognize the abnormal behavior of marine fish swarm. The results show that the proposed method has low false alarm rate, high recognition accuracy and execution efficiency.
2 Method
2.1 Acquisition of Coordinate of Marine Fish Group
In order to research the dynamic behavior of fish group in the ocean, it is necessary to obtain the trajectories of different individuals, at present, there are two ways to obtain the trajectories of individuals in fish group.
(1) According to the GPS chip embedded in the fish body, the movement trajectories of different individuals can be obtained by GPS.
(2) Video data can be used to obtain the motion track of marine fish school, the motion video of fish school is adopted, it is very convenient to collect data, and the cost is low. However, the trajectory of different individuals can be extracted from the video data.
In the field of computer vision, the fish group video tracking is a problem of tracking multi-target moving object, the overall tracking framework in the video of marine fish school is shown in Figure 1, the process is roughly divided into three steps.
(1) According to the image preprocessing of marine fish group, the noise, especially the shadow, can be removed;
(2) The current image is subtracted from the background image to separate the fish from the background image [5, 6]. Combined with the size of the experimental pool and the fixed number of fish, the watershed algorithm with marks is used to calculate the barycenter coordinates of different fish groups.
(3) Target tracking of marine fish school, in this step, it is necessary to match the moving targets in the previous frame and the next frame.
In the video, the maximum data noise is from shadow. Due to the influence of light and other factors, the shadow of the moving object will be recognized. The “follow like a shadow” often leads to system misjudgment. Shadow is often mistaken for a part of the target fish, and it is more likely to cause adhesion between fish bodies. Therefore, it is necessary to remove the shadow of fish in initial image. However, there are two main visual features in the shadow data of marine fish school.
(1) A shadow that is significantly different from background can be regarded as foreground;
(2) Shadow and target have the same motion attributes.
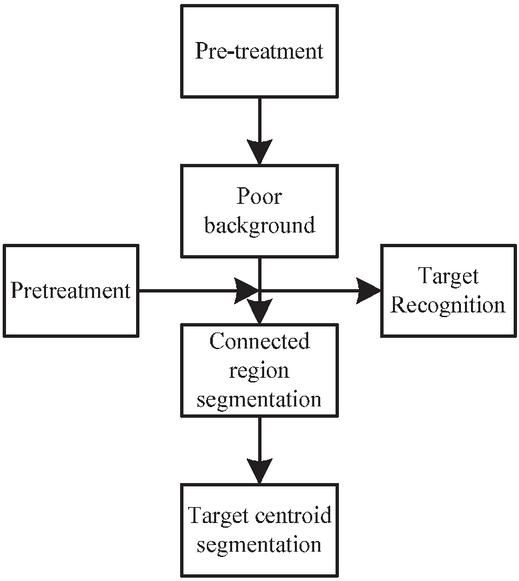
Figure 1 Flow chart of video tracking of marine fish school.
The C software library is used to remove the shadow of marine fish school [7], for a given pixel p, is used to represent the vector of color variance from shadow to background, and the color variance adopts three-dimensional features.
| (1) |
In the above formula, denotes the brightness gradient, and denote the direction in spherical coordinates, the specific calculation is shown in following formulas:
| (2) | ||
| (3) | ||
| (4) |
In above formulas, represents the background color of pixel . The superscripts (, and ) represent the red, green and blue components in RGB color space. During the operation the unsupervised method is adopted. According to brightness and saturation, the pixels different from the background are selected as foreground candidate points [8, 9]. The feature points of these candidate points are used to build Gaussian mixture model. Meanwhile, the posterior probability of pixel is calculated by the model, so that we can determine whether it is the foreground pixel or the background pixel.
The brightness of the pixel in the marine fish school obeys the independent normal distribution. The mean and variance of brightness of pixel is set by sampling the images in time . In order to effectively reduce the influence of noise, it is necessary to use the median to substitute for the average value. The specific calculation is shown in Formula (5)
| (5) |
In the above formula, represents the brightness of the pixel at time , represents the median of pixel in the time dimension. The specific calculation of standard deviation is shown in Formula (6):
| (6) |
In the above formula, the constant is to ensure that the accurate data is established within the standard deviation range [10]. That is:
| (7) |
Based on the background model, the constraints in Formula (8) are used to determine the foreground and background.
| (8) |
In the above formula, represents the segmentation threshold.
Due to the serious overlap between fish bodies, the images formed by background difference are usually connected with each other, but it is unable to extract single fish. Next, the watershed segmentation algorithm with makers can be used to perform morphological treatment on connected regions.
Watershed segmentation algorithm is a mathematical morphology segmentation algorithm based on topology theory. Its main idea is to regard the image as a topological landform in geodesy. The gray value of each pixel in image represents the elevation of point. Each local minimum and its influence area are called catchment basin [11, 12]. The boundary of catchment basin is called watershed. The concept and formation of watershed can be explained by simulating the immersion process. On the surface of local minimum value, we need to drill a small hole, and then the whole model will be slowly invaded into the water. With the gradual deepening of invasion, the domain of influence of each minimum value will gradually expand outward, so that a dam is built at the junction of the two catchments. Finally, a watershed is formed.
In the ocean, the position of fish group should be expressed as:
| (9) |
In the above formula, and represent the centroid of the connected region, and represent the image coordinates of the center of ocean, is the radius length of the ocean.
The number of marine fish groups is fixed, the number of fish schools can be used as a priori knowledge to filter the noise. In binary images, the regions of connected regions after size constraint are sorted from large to small, and the first connected regions are selected, and the redundant connected regions should be eliminated [13].
It is necessary to set the speed of the fish group from the th frame to th frame and the position from the th frame to th. Similarly, the rotation angle of fish in the next frame can also be predicted. The specific calculation is shown as follows:
| (10) |
In the above formula, represents the predicted position of the th frame, represents the position of the th frame, represents the position of the th frame. Based on the above principle, the rotation angle of marine fish school in next frame can be accurately predicted. The specific calculation is shown as follows:
| (11) |
The error function between the predicted motion parameters and the observed motion parameters is calculated in Formula (2.1)
| (12) |
In the above formula, represents the weight of the error of marine fish school, and represents the weight of angle error.
The predicted motion and real motion state of marine fish groups at time are considered to be and of bipartite graph . The specific expressions of and are:
| (13) | ||
| (14) |
denotes the motion matching degree of and .
| (15) |
In above formulas, denotes a constant that ensures . The target tracking problem is to solve the maximum complete matching weight of bipartite graph, which is usually called the optimal matching problem [14, 15]. The specific operation of the optimal matching problem of bipartite graph is described as follows:
If the mapping satisfies that any , any holds, then is a feasible vertex label of bipartite graph , where:
| (16) |
Combined with the above analysis, the label of initial marine fish school is given.
| (17) |
The set of adjacent points is calculated, and then the equal subgraph is obtained
| (18) |
New feasible individual coordinates of marine fish group can be obtained by adjusting the markers, the specific calculation is shown in Formula (19)
| (19) |
2.2 Recognition for Abnormal Behavior of Marine Fish Group Based on Deep Learning Network Model
After obtaining the coordinate points of individuals in different fish groups, it is necessary to divide the whole video of fish-swarm movement into several video units. The first frame image of each video unit is extracted, and then fast target recognition is used to identify the main body. Combined with the deep learning network model, the weak supervision of the video label of abnormal behavior of marine fish groups is analyzed [16]. The multi-instance learning method and the dual-flow network model are combined to effectively realize the recognition for abnormal behavior of marine fish group. The specific process is shown in Figure 2.
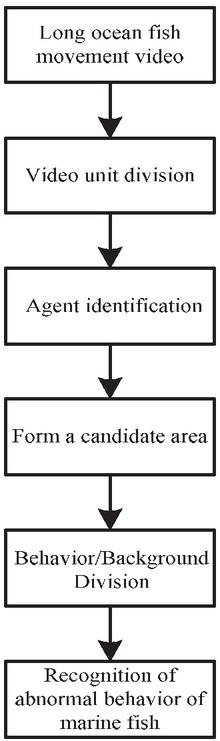
Figure 2 Flow chart of abnormal behavior recognition of marine fish based on deep learning network model.
The recognition for abnormal behavior of marine fish group can be divided into three stages [17], including:
(1) Cell segmentation;
(2) Identification of behavior subjects;
(3) The context units constitute a unit block, as shown in Figure 3.
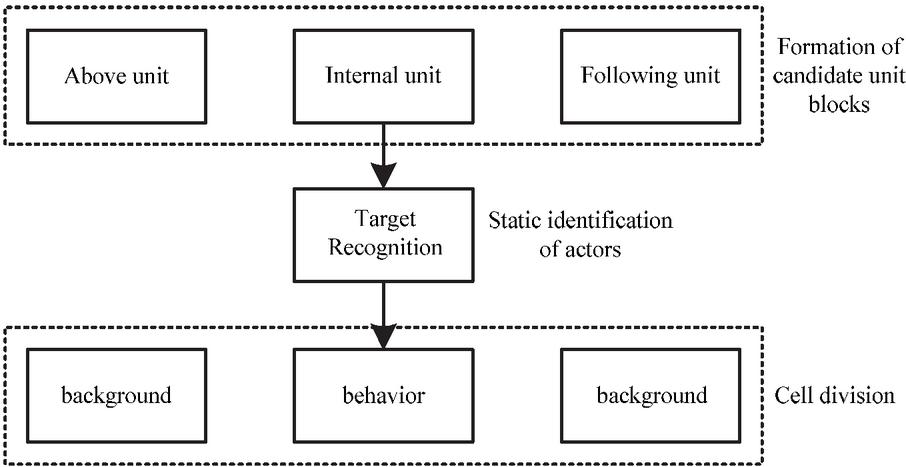
Figure 3 Flow chart of identification for behavior subjects.
The operation flow of behavior/background division is given in Figure 4. The internal features and context features in unit block are obtained through the final pooling features [18, 19]. The final feature of has a certain correlation with other features. Final feature can be obtained by Formula (20)
| (20) |
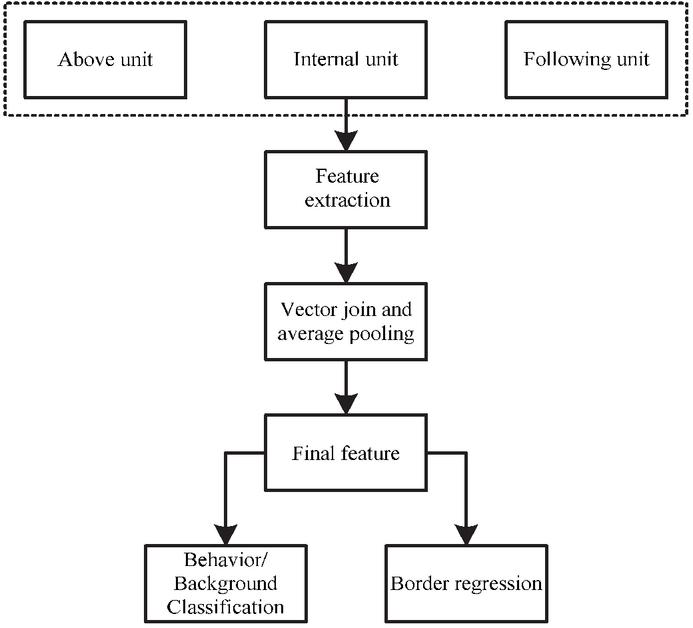
Figure 4 Flow chart of behavior/background classification and border regression.
It is assumed that there is a unit regression module in the movement of marine fish group. The final feature of the module is . The whole unit block mainly includes two output layers of relevant information.
(1) The first layer is output, which can calculate the confidence scores of different behaviors;
(2) The second layer is the boundary of time series regression compensation.
The formula of regression compensation is calculated as follows:
| (21) | ||
| (22) |
In above formulas, represents the initial frame of the unit in the motion video, represents the initial frame of the end unit in motion video, represents the starting frame of the real boundary in motion video, represents the end frame of the real boundary in motion video of marine fish school.
When training the behavior/background classification network, it is necessary to label each unit block in different fish schools, and the positive sample label needs to meet the following constraints [20, 21]:
(1) The unit blocks and any real behavior fragments overlap;
(2) The time series intersection division (tIoU) of the unit block and any real fragment, which is bigger than 0, 5.
A multi-task loss function, a user training classification and a boundary regression are established,
| (23) |
In the above formula, represents the loss caused by the classification of abnormal behavior of fish group. It is also a standard Softmax loss function, represents the loss of time series boundary regression, represents the hyperparameter. Regression loss can be calculated by Formula (24):
| (24) |
When the support vector machine is used to research the supervised classification, all samples can be adopted, the classifiers of different optimization functions are trained by Formula (25)
| (25) |
In the above formula, 1 represents the hinge loss function, represents the label of sample; represents the feature representation of image block or video clip, represents the offset value, represents the total number of training samples, represents the classifier that needs to be learned.
If there is abnormal behavior in the motion video of marine fish [22], it will be marked as positive sample, otherwise it will be marked as negative sample. The positive sample video is represented as positive sample bag . The elements in the bag composed of different time sequence segments in the video are , where represents the number of segments. If at least one segment in the video contains abnormal behavior, the optimization objective function in different bags can be expressed as follows:
| (26) |
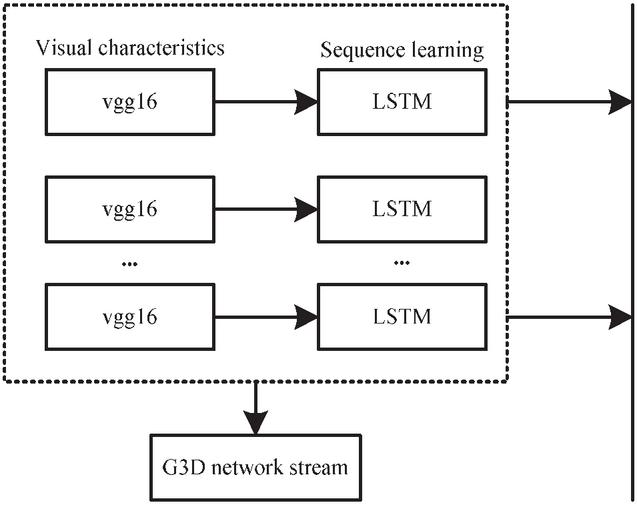
Figure 5 Improved dual-flow network structure.
The video of marine fish group is divided into several segments with the same time period, and all the video segments are applied to the bag. At the same time, the improved CNN—RNN/C3D dual-flow network is used to extract features. The specific operation is shown in Figure 5.
It is impossible to accurately define the abnormal behavior of fish group in ocean. However, it is very subjective. Due to different research objects, it may lead to different results.
The recognition of abnormal behavior of marine fish group can be regarded as a regression problem. In order to obtain more accurate results, the following abnormal video judgment is used to obtain higher ranking loss, the specific calculation is shown as follows:
| (27) |
In the above formula, denotes the abnormal video clips, denotes the normal video clips; represents the corresponding abnormal prediction score, whose value ranges from 0 to 1, also represents the predicted abnormal score [23].
If there is no label in video-clip level, the relevant formula can’t be adopted, the multi-instance sorting objective function can be expressed as follows:
| (28) |
In the above formula, will traverse the motion video clips of marine fish group in each bag.
The hinge loss function is expressed as follows:
| (29) |
The loss function in Formula (29) ignores the potential temporal structure of abnormal behavior in marine fish groups. In actual researches, the time of abnormal behavior of fish is very short. In this case, the examples in the abnormal bag are sparse, and only a few segments in the video have abnormal behavior.
The sparsity and smoothness constraints are combined into the abnormal score of examples, where, the loss function can be expressed as:
| (30) |
The loss function in Formula (30) is set as the ranking loss function in deep learning network model, and the error is back propagated in positive and negative samples, so that the maximum score frequency range can be obtained. Combined with the above analysis, we can get the complete objective function as shown in Formula (31) [24, 25]. That is:
| (31) |
Based on above analysis, we analyzed the weak supervision of the tags in abnormal behavior video of marine fish school through the deep learning network model, and combined the multi-instance learning method and the dual-flow network model to identify the anomaly of marine fish school.
| (32) |
3 Experiments
In order to verify the comprehensive effectiveness of the method in this work, the simulation experiments are carried out, the experimental conditions are as follows: the population size is 30, the dimension is 30, the algorithm runs 30 times for each test function, and the maximum cut-off algebra of each test function is 2500.
In order to further verify the recognition accuracy of the method, 600 frames are selected from the video of each fish swarm movement as the experimental data. Simultaneously, the motion trajectory of the fish school in the ocean is obtained manually. The recognition accuracy of different algorithms is evaluated in detail.
The accuracy of target recognition is evaluated according to occlusion rate, separation rate and recognition rate, the formula of occlusion rate is as follows:
| (33) |
where #Occlusionframe represents the number of frames with occlusion, #TotalFream is the total number of frames. The formula of separation rate is as follows:
| (34) |
where represents the number of detached frames, is the number of frames with occlusion. The formula of recognition rate is as follows:
| (35) |
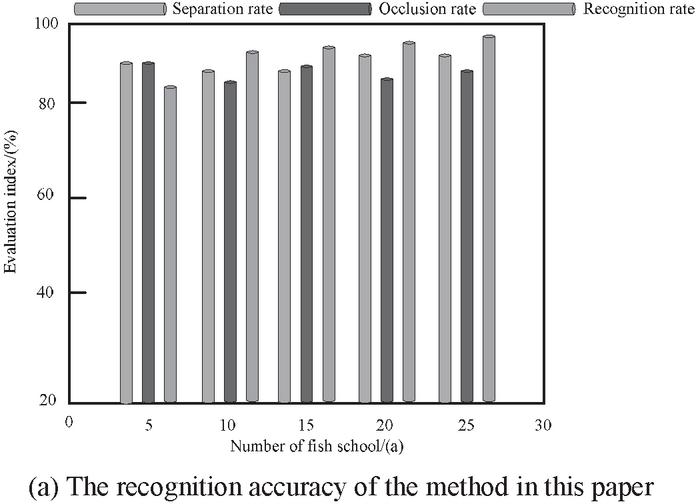
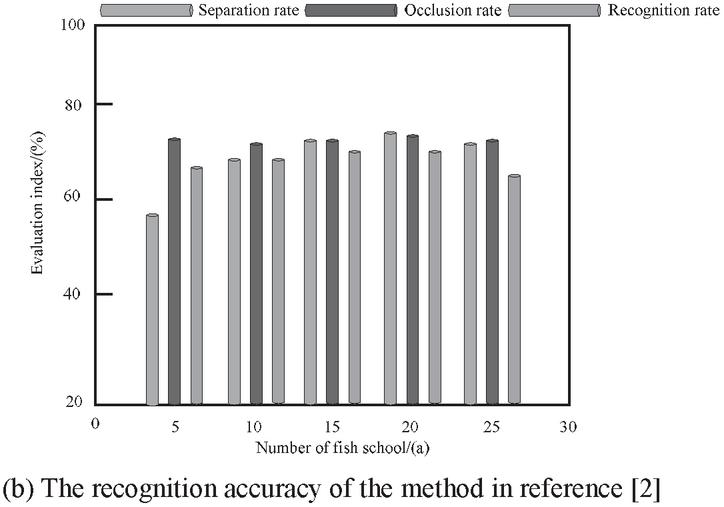
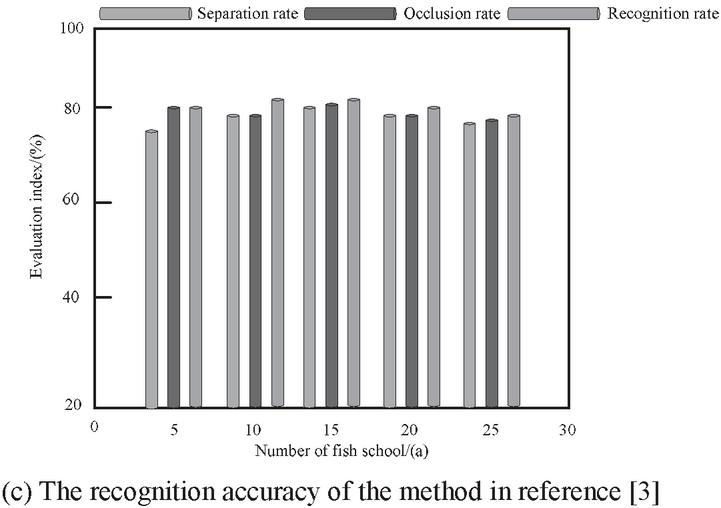
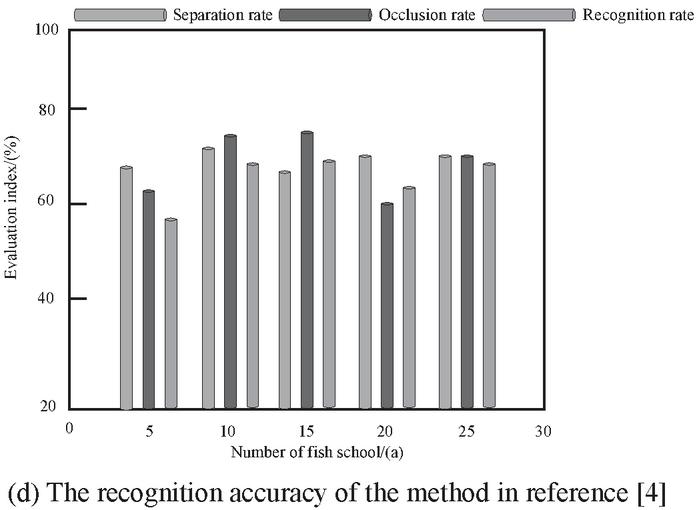
Figure 6 The comparison of recognition accuracy of different recognition methods.
As shown in Figure 6, the evaluation indexes of various identification methods vary with the number of fish swarm. Obviously, the recognition accuracy of this method is higher than that of the other three methods. This is because the method in this paper solves the problem about fish swarm target localization. During the process of fish swarm abnormal behavior recognition, the individual’s position can be tracked in real-time, thus ensuring the accuracy of the recognition results, and timely detecting the fish with abnormal behavior in the marine fish swarm.
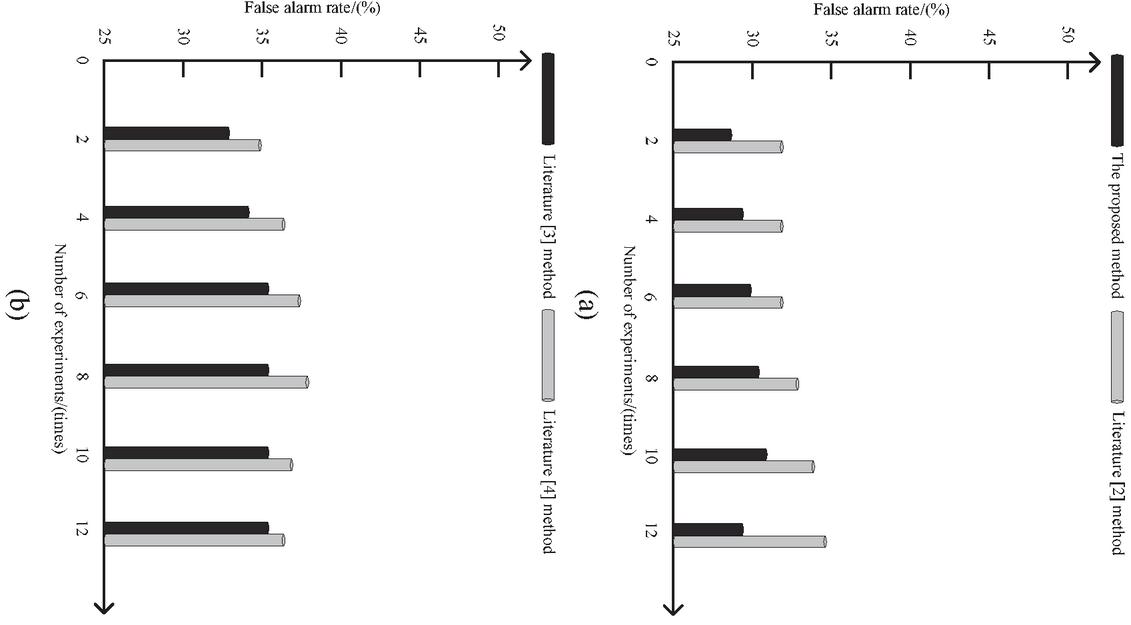
Figure 7 The comparison of false alarm rate of different recognition methods.
As shown in Figure 7, the method in our work solves the positioning of individual coordinates in the fish swarm, thus effectively reducing the external interference, and lowing the false alarm rate.
In order to verify the effectiveness of the proposed methods, the execution efficiency experiments of different methods were carried out, the results were shown in Figure 8.
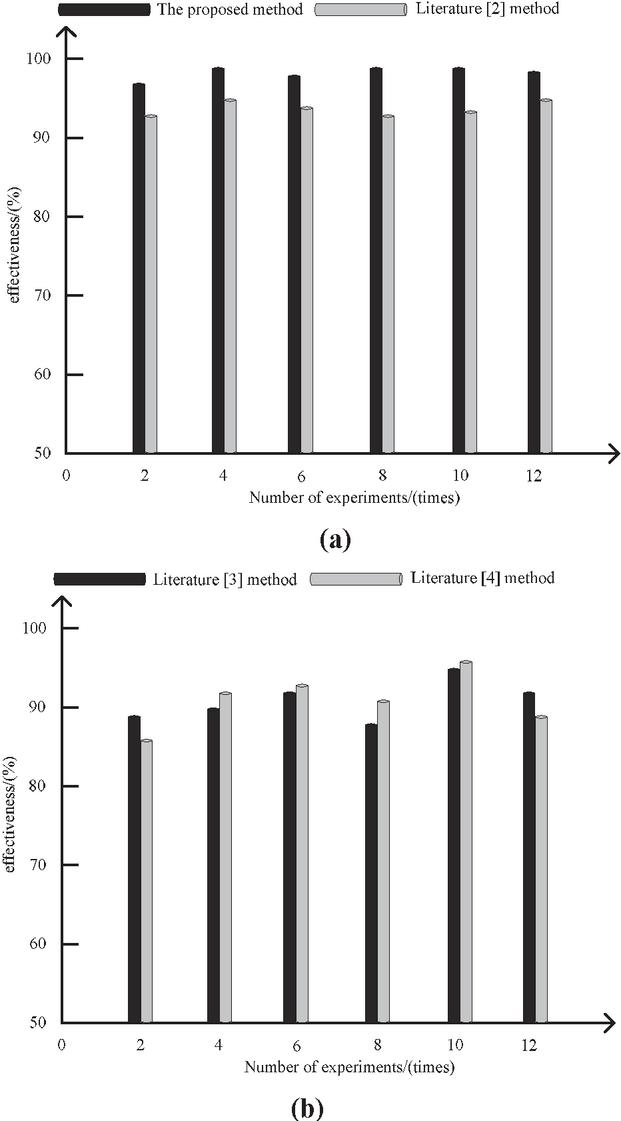
Figure 8 The Comparison of execution efficiency of different identification methods.
As shown in Figure 8, clearly, the efficiency of this method is the highest, this is because the method can accurately obtain the specific coordinates of the fish school in the ocean and reduce the time of tracking fish school, thus improving the execution efficiency.
4 Conclusions
Since the traditional methods have the defects, this paper proposes a method based on deep learning network model to identify the abnormal behavior of marine fish, the main results are as follows:
(1) The feature extraction of abnormal behavior in marine fish swarm is investigated in detail, and its advantages and disadvantages are analyzed and improved.
(2) The pre-processing method is used to eliminate the Yin and Yang parts of the motion video data of the marine fish swarm. The gray image of the fish school is obtained by subtracting the background image from each frame image. Meanwhile, the specific coordinate position of the fish school is obtained by utilizing the watershed algorithm with markers.
(3) The candidate area and the monitoring modules are analyzed for feature, and the behavior/background classification network is used, the candidate area is determined to obtain the final time axis location.
(4) The characteristics of fish with abnormal behavior are analyzed. Associating with multi instance learning method and dual flow network model, the abnormal behavior recognition of marine fish swarm is achieved.
However, there are still some defects in this method, the following aspects in the future will be studied in detail:
(1) The information transmission network based on marine fish swarm is constructed to improve the accuracy of identification results.
(2) Each individual in the marine fish school can quickly respond to external stimuli and environmental changes, but the decision-making rules and strategies of different individuals in the fish school are still unclear and need further research.
(3) The method of interaction between robot animals and animal populations should be used to identify the abnormal behavior of marine fish swarm, further revealing the information transmission mechanism and dynamic behavior of fish schools.
(4) The recognition methods of abnormal behavior of fish swarm should be extended, such as sparse representation method.
(5) A new method which can not only extract the complete feature of time information, but also describe the image better will be designed in the future.
(6) Realization of online recognition of abnormal behavior of marine fish school will be also research focus in the future.
Acknowledgement
This work is supported by the National Natural Science Foundation of China (61402350, 61103143, U1404620, U1404622), the Key Scientific and Technological Project of Henan Province (182102310034, 172102310124, 212102210400), the Key Research Projects of Henan Provincial Department of Education (20A520046).
References
[1] Z.M. Wang, X. Wang, H. Song, ‘Mobile user behavior recognition method based on random dropout deep belief network’, Computer Application Research, 34(12), 3797–3800, 2017.
[2] P, J. Wu, X. Mei, Y. He, S.Q. Yuan, ‘Detection method of abnormal behavior in video sequence based on deep network model’, Progress in Laser and Optoelectronics, 56(13), 2019.
[3] H.D. Lu, X. Yu, G.Q. Liu, ‘A method for detecting abnormal behaviors of fish under low dissolved oxygen stress based on image processing and compressed sensing’, Journal of Zhejiang University (Agriculture and Life Sciences), 44(04), 499–506, 2018.
[4] C.W. Chen, Y.G. Du, C. Zhou, C.H. Sun, ‘Fish school feeding behavior recognition technology based on support vector machine’, Jiangsu Agricultural Sciences, 46(07), 226–229, 2018.
[5] Y. Gao, B. Chen, H.M. Liao, M.G. Lei, X. Li, J. Li, et al, ‘Deep learning recognition method for aggressive behaviors of group-raising pigs’, Journal of Agricultural Engineering, 35(23), 192–200, 2019.
[6] F.B. Luo, P. Wang, S.Y. Liang, G.F. Xu, W. Wang, ‘Recognition of abnormal crowd behavior based on deep learning and sparse optical flow’, Computer Engineering, 46(04), 287–293, 300, 2020.
[7] B. Chen, Q.T. Yu, T.M. Chen, ‘Research on the deep learning model of human body behavior recognition based on sensors’, Journal of Zhejiang University of Technology, 46(04), 25–31, 2018.
[8] Z.W. Ni, X.H. Zhu, M.Y. Cheng, ‘Air quality prediction method based on artificial fish school and fractal dimension fusion svm’, Pattern recognition and artificial intelligence, 29(12), 1122–1131, 2016.
[9] X.J. Bi, X.Y. Feng, Human behavior recognition based on improved deep learning model c-grbm, Journal of Harbin Engineering University, 39(01), 156–162, 2018.
[10] Z.H. Miao, Y.C. Shen, X.H. Wang, X.F. Zhou, C.L. Liu, ‘Overlapping fruit image recognition algorithm and experiment in natural environment’, Journal of Agricultural Machinery, 47(06), 21–26, 2016.
[11] Y.L. Huang, C.L. Wan, Human behavior recognition algorithm based on deep learning, Application of Electronic Technology, 44(10), 7–11+16, 2018.
[12] J.Y. Li, B. Zhao, X. Li, H. Liu, Y.F. Liu, J.W. Zou, ‘Network traffic abnormal prediction method based on deep learning’, Computer Engineering and Applications, 056(006), 39–50, 2020.
[13] Chen, L., Zhang, F., & Jiang, S., (2019), Typical military target recognition method based on deep forest learning model under small sample conditions, Journal of China Academy of Electronics, 14(03), 232–237.
[14] M. Zhang, B. Xu, X.Y. Li, M.H. Yin, B.J. Wu, K. Qiu, ‘Deep neural network-based soft-failure detection and failure aware routing and spectrum allocation for elastic optic networks’, Optical Engineering, 58(6): 66107, 1-66107, 9, 2019.
[15] W.Z. Chen, Y. Tang, J. Zhang, ‘Improved fish school algorithm optimization method for industrial control network communication anomaly detection’, Computer Application Research, 36(07), 2164–2168, 2019.
[16] R.P. Zhang, Y.X. Yu, K. Zhang, M. Liu, Z.Q. Shang, ‘Research on human action recognition model based on oi-lstm neural network structure’, Computer Science and Exploration, 12(12), 1926–1939, 2018.
[17] J.Q. Ding, B. Ma, X. Li, ‘Multi-view deep anomaly detection framework for vehicle refueling behavior based on fusion of spatiotemporal data’, Computer Applications, 39(11), 3370–3375, 2019.
[18] X.Y. Feng, Q.R. Zhang, Q.Y. Li, ‘Rolling bearing fault identification based on improved deep network data fusion’, Journal of Chongqing University: Natural Science Edition, 42(02), 52–62, 2019.
[19] X.J. Zhang, C.Z. Li, L.Y. Sun, M.L. Zhang, Behavior recognition based on improved 3d convolutional neural network, Computer Integrated Manufacturing System, 25(08), 2000–2006, 2019.
[20] P. Jin, X.F. Xia, Y. Qiao, X.H. Cui, ‘High-dimensional sensor data anomaly detection algorithm based on deep belief network’, Journal of Sensor Technology, 032(06), 892–901, 2019.
[21] Y.J. Jing, X.Y. Hu, Z.K. Song, Y.Q. Hou, ‘Research on deep convolutional neural network bearing fault recognition based on cnn-svm’, Vibration and Shock, 38(18), 173–178, 2019.
[22] Q.P. Lai, J. Yang, B.D. Tan, L. Wang, S.Y. Fu, L.W. Han, ‘Insulator automatic identification and defect diagnosis model based on yolov2 network’, China Electric Power, 52(07), 31–39, 2019.
[23] J.C. Wang, X.C. Tan, Z.H. Wang, Y.F. Zhong, H.P. Dong, S.T. Zhou, et al, ‘Research on remote sensing image target recognition method based on faster r-cnn deep network’, Journal of Geo-Information Science, 20(10), 132–140, 2018.
[24] Z.M. Guo, H.H. Peng, S.X. Niu, K. Shao, Z. Lv, W. Wang, ‘Host anomaly detection method based on user and network behavior analysis’, Journal of Beijing Jiaotong University, 42(05), 44–50, 2018.
[25] B.C. Jiang, J. Guan, W. Zhou, Y. He, ‘Mining and recognition and analysis of ship abnormal behavior in maritime traffic’, Computer Simulation, 34(06), 329–334, 2017.
Biographies

Liyong Chen was born in 1982, male, Chinese, He received master’s degree in School of Computer Science and Technology, Faculty of Electronic Information, Liaoning University of Science and Technology, China, in 2010. He has been teaching at Zhoukou Normal University since 2010. His research interests include artificial intelligence and data mining.

Xiuye Yin was born in Xinyang, Henan. P.R. China, in 1984. He received the Master degree from university of science and technology Liaoning, P.R. China. His research interest include computational intelligence, Cloud computing and big data.
Journal of Web Engineering, Vol. 20_3, 575–596.
doi: 10.13052/jwe1540-9589.2031
© 2021 River Publishers