Keyframe Generation Method via Improved Clustering and Silhouette Coefficient for Video Summarization
Fengsui Wang1, 2, 3*, Jingang Chen1, 2, 3 and Furong Liu1, 2, 3
1School of Electrical Engineering, Anhui Polytechnic University, 241000 Wuhu, China
2Key Laboratory of Detection Technology and Energy Saving Devices, 241000 Wuhu, China
3Key Laboratory of Advanced Perception and Intelligent Control of High-end Equipment, Ministry of Education, 241000 Wuhu, China
E-mail: fswang@ahpu.edu.cn; pajk88@qq.com; mynhsiu@gmail.com
*Corresponding Author
Received 26 October 2020; Accepted 06 November 2020; Publication 17 February 2021
Abstract
In order to solve the issue that the traditional k-means algorithm falls into the local optimal solution in video summarization due to unreasonable initial parameter setting, a video summarization generation algorithm by using improved clustering and silhouette coefficient was proposed. Firstly, color features and texture features are extracted and fused from the decomposed video frames. Secondly, the hierarchical clustering algorithm is used to obtain the initial clustering results. And then, the improved k-means algorithm with silhouette coefficient is introduced to optimize the initial clustering results. Finally, the nearest frame from the cluster center is selected as the keyframe, and all the final keyframes are arranged in the order of the time sequence in the original video to constitute video summarization. The proposed algorithm is evaluated on two video datasets and the results show that the proposed algorithm achieves an average 84% accuracy rate and only 24% error rate in YouTube dataset. At the same time, the algorithm is validated on the benchmark Open Video Database dataset with an average 71% precision, 84% recall rate, and 76% F-score, which is higher than state-of-the-art video summarization methods. Moreover, it generates video keyframes that are closer to user summaries, and it improves effectively the overall quality of the generated summary.
Keywords: Video analysis, video summarization, hierarchical clustering, k-means clustering, silhouette coefficient.
1 Introduction
Internet and multimedia techniques have been extensively explored in every aspect of people’s lives for capturing and uploading a large number of videos to the Internet, which can be convenient and helpful for users to access to the video data and used in applications such as search engines and digital libraries. Despite their convenience up to some extent to people’s life, their real management, storage and retrieval are a challenge due to their increased large-capacity video data, which is quite difficult and time-consuming in analyzing and processing such large amount of video data. Therefore, an efficient way is an urgently need for effectively managing and analyzing the huge video data. Video summarization can automatically select a sequence of pictures content of a video in such a way that the respective target group is rapidly provided with concise and efficient information about the content, while the essential message of the original video is preserved [1]. Keyframe extraction is the key to video summarization, and it is widely studied because of its importance and advantages [2–4]. Therefore, a video summarization generation method based on the keyframe is focused on in this paper.
In recent years, the keyframe extraction methods have been presented, attempting to improve the quality of the video summarization, which are divided into four types as follows. The first type exploits motion information to extract the keyframes [5–7]. The amount of motion of the shot is calculated by utilizing the optical flow method and the frame with local minimum is chosen as a keyframe. This algorithm can select the number of corresponding key frames under the variation amplitude of the shot. However, the calculation process of the motion for this method is especially complicated, and it is difficult to accurately judge the local minimum. The second type uses the shot boundary for the keyframe extraction of the video summarization [8–12], which divides the original video into several shot segments, and then selects the first frame, the middle frame and the last frame as keyframes. This method is easily implemented, but it has poor applicability, especially when the shot is frequently switched. The third type extracts keyframes by using the visual content of the videos [13–17]. The frames with dramatic changes in video content are selected as keyframes. The keyframes extracted by this method are consistent with the original content, but there are too much redundant frames if the shots are frequently switched. The fourth type adopts the clustering method to generate the keyframes [18–22]. And the frame closest to the cluster center in each cluster is selected as the keyframe. The keyframes extracted by this method actually conform to the main content of the videos, and the resulting video summarization works well. However, it is very sensitive for this type of method to the choice of initial parameters, which directly affects the clustering effect.
Summarizing the existing algorithms, it can be observed that the certain methods are capable to extract the keyframes and generate good summaries but their computationally expensive behavior is limiting their usefulness. On the other hand, the video summarization methods are not competitive enough to extract important frames from the original video content. Considering these challenges, an efficient keyframe generation method is proposed using improved clustering and silhouette coefficient for video summarization in this paper. Clustering algorithms play an important role in the field of video summarization. The initial parameters, the number of keyframes and stability of clustering are not considered together in traditional clustering algorithms, which results in generating poor summaries [23]. The traditional k-means clustering algorithm is simple and easy to be implemented. The disadvantage is that the k-means algorithm is sensitive to the initial clustering parameters, which easily results in falling into the local optimal solution. Usually, it is difficult to obtain the global optimal solution. Although the initial parameters and the number of keyframes do not need to be preset in the hierarchical clustering method [24, 25], the split points and merge points in clustering are difficult to determine. Moreover, this hierarchical clustering has high computational complexity. Therefore, this paper proposes an improved clustering based key frame extraction method for video summarization via analyzing and combining their advantages between k-means clustering and hierarchical clustering. Firstly, the color and texture features in the video image are extracted and fused. Secondly, the hierarchical clustering is used to obtain the initial clustering parameters. And the silhouette coefficient is introduced in the k-means algorithm to optimize the results of hierarchical clustering [26]. Finally, the frame closest to the cluster center is selected as the keyframe for summary generation. An additional post-processing step arranging the final keyframes in order of the time sequence in the original video is used to form video summarization.
The rest of the paper is structured as follows. Section 2 presents the color and texture feature extraction. In Section 3, the proposed keyframe generation method for video summarization is described in detail. Experimental results and discussion are shown in Section 4. Finally, Section 5 concludes this work with recommendation for future research.
2 Features Extraction
In order to more comprehensively present the characteristics of the video content, texture features are introduced on the basis of the color features in this paper, and fuses the two features as clustering feature parameters. The advantage of feature fusion is that it can effectively retain the original video information and reduce the error impact of image noise on the experiment.
2.1 Color Feature
In RGB color space, the correlation between the values of the three-color components and the produced colors is not intuitive, while HSV color space is more similar to the way that humans perceive colors [27]. Different from RGB model oriented to hardware, HSV model is independent of the display device and is closer to human color visual perception. The hue, saturation and value in HSV model facilitate the intuitive contrast between colors, and also facilitate human visual perception, so it is more appropriate to extract color features. However, the actual color space is mostly directly derived from hardware, that is, RGB color space. Thus, it is necessary to convert the RGB space to the HSV space. And that the three components of the HSV color space are quantized in an unequally interval [28], whose formulas are given in Equations (1) and (2).
| (1) | ||
| (2) |
Herein H represents for hue, S denotes for saturation, and V stands for brightness. Hence, feature vector G is constructed including 72-dimensional vector by computing each color component, that is , . The HSV color space is divided into many small color intervals, each of which is a bin of the color histogram. Therefore, a one-dimensional color histogram including 72 bins is acquired in this paper.
2.2 Texture Feature
Local Binary Pattern (LBP) can be used to characterize image texture features, whose operator has gray invariance and little impact on illumination. In order to better characterize image features, we improve the LBP operator and merge it with above-mentioned color features. The improved circular LBP operator is invariance to image rotation, so it can avoid the error of illumination and image rotation on experimental results.
As shown in Figure 1, the main process of the LBP feature extraction is to first determine the threshold of the area to be calculated, that is, the gray value of the pixel in the center of the area. Then, the threshold is compared with the gray value of other pixels of the circular neighborhood. If the pixel value is larger than the threshold, the value at that position is marked as one. Similarly, if the pixel value is smaller than the threshold, the value at that position is marked as zero. The resulting a binary sequence is obtained, and then the pixel values of different positions are weighted summed. Finally, the LBP value of the area is obtained. The LBP operator LBP(P, R) can be calculated based on Equations (3) and (4).
| (3) | ||
| (4) |
Herein R is the radius of the circular neighborhood and P is the pixel within the radius. b is the threshold at the central point, and b is the other pixels value centered on b in the circular neighborhood.
It can be seen from the Equation (3) that LBP is the difference between the gray value of other pixels in the neighborhood and the threshold one by one, which can make the gray value of the pixel remain stability within a certain range. As a result, the improved LBP operator can avoid the error and influence of illumination in the experiment.
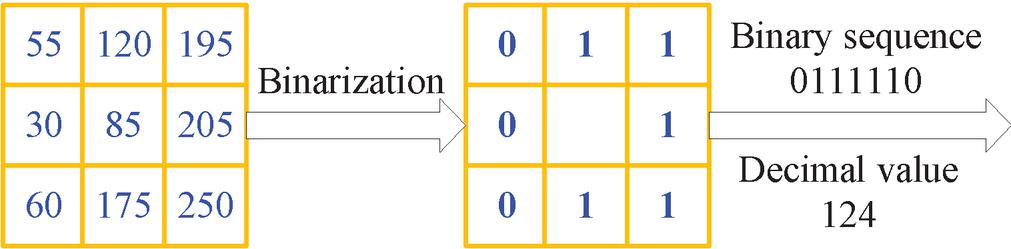
Figure 1 The LBP(8,1) feature extraction process.
Any LBP operator has 2 binary modes. As we know, the binary pattern will increase exponentially with the increase of the P value based on the 2 exponential properties. Therefore, the equivalent dimensionality reduction mode of the LBP operator is used to the amount of calculation in this paper. The equivalent mode of the LBP operator is as follow. If a binary pattern occurs at most twice from 1 to 0 or from 0 to 1, the binary corresponding to this mode is called the equivalent mode class. For instance, 00000000, 00011111, and 10001111 have zero, one, and two hops, respectively, so they are classified as equivalent mode classes. As far as 10011011 is concerned, it has four hops, thus it is classified as a mixed mode class. By using this method, the number of modes is reduced from the original to , which greatly reduces the amount of calculation of the algorithm. For instance,for the LBP(8, 1), the number of modes in the original LBP has been reduced from 256 to 58, but there are 59 modes in actual application, which reduces 197 modes.
After features extraction of the above steps, the feature vectors of the color and LBP operator are G and V, respectively. Thus, the fused features can be presented as M . The image information described by the fused features is more fully expressed.
3 The Proposed Algorithm
Motivated from the strength of the clustering methods for various applications, this paper aims to propose an improved clustering and silhouette coefficient-based method for video summarization. The algorithm is three-fold: obtaining initial clustering results using hierarchical clustering, and optimizing initial clustering results using k-means and silhouette coefficient, and keyframes selection from each cluster for summary generation. An additional post-processing step arranging the final keyframes based on their temporal order is finally used to form video summarization. The strengths are maximized through combining hierarchical clustering and k-means method, which have the advantages of not needing to preset the initial clustering parameters for the hierarchical clustering and the advantages of the simplicity and ease of implementation for k-means. Therefore, the proposed scheme effectively avoids the problem that the k-means algorithm is easy to fall into the local optimal solution on account of blindly setting the number of clusters and artificially selecting the random cluster centers.
3.1 Initial Clustering Results
The “bottom-up” merged method in hierarchical clustering is adopted in our algorithm. First, the proposed algorithm determines a termination condition for hierarchical clustering. We use the number of clusters as this termination condition. For the current video, the video frame set and the corresponding feature vector set are firstly established. Then, the mean X and root-mean-square error of the feature vectors for all video frames are computed using Equation (5).
| (5) |
After features extraction, the similarity of two adjacent frames is calculated using Euclidean distance, whose formula is provided in Equation (6).
| (6) |
Herein k is the size of the feature vector, M is the feature vector of the first frame and M is the feature vector of the next selected frame. The value returned from this function is normalized between 0 and 1, and the interframe similarity distribution is shown in Figure 2. The peak appears because the shots content has changed greatly. Selecting the video frame with larger change as the keyframe can provide a good overview for the original video. The clustering number K selected as a termination condition for determining the keyframes is equal to the number of frames that conform to the following formula, which effectively reduces the blindness of the K value selection.
| (7) |
Finally, the cluster center can be acquired by calculating the average of each sample until the number of clusters is equal to K, whose formula is given in Equation (8).
| (8) |
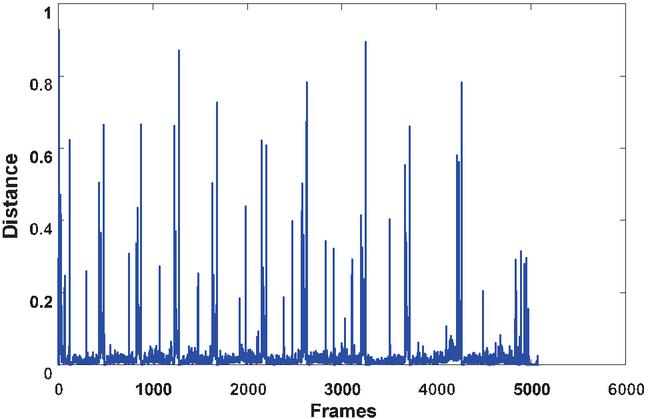
Figure 2 Interframe similarity distribution.
Herein “” is the j-th cluster frame number.
As previous explained, the pseudo-code of the proposed method for obtaining initial clustering results using hierarchical clustering is given in Algorithm 1.
Algorithm 1 Obtaining initial clustering results
1: Begin
2: for all frames of the video do
3: Extract features for each frame;
4: Compute the mean X and root-mean-square error using Equation (5);
5: Determinate the clustering number K selected as a termination condition using Equation (7);
6: end for
7: while (termination condition is not met) do
8: for all clusters do
9: Consider each sample as a cluster;
10: Calculate the similarity d of two adjacent frames using Euclidean distance according to Equation (6);
11: if two frames have smaller Euclidean distance then
12: Merge into one cluster;
13: else
14: Number of clusters plus one;
15: end if
16: end for
17: end while
18: end
3.2 Clustering Results Optimization
After the hierarchical clustering algorithm is completed, the clustering results (i.e., clustering center C and clustering number K) are used as the input of the k-means algorithm, which can effectively solve the problem that k-means cannot preset initial clustering parameters and greatly reduce the iterations of the k-means algorithm.
As previous illustrated, the pseudo-code of the proposed method for optimizing clustering results using k-means is shown in Algorithm 2.
Algorithm 2 Optimizing clustering results
1: Initialization
2: Clustering center C;
3: Clustering number K;
4: Begin
5: Obtain the new cluster center C’ using k-means;
6: while (traversal for C’ is not finished) do
7: for all frames do
8: Measure the distance between each frame and cluster center;
9: if distance is nearest then
10: Merge two clusters and reassign all samples using the minimum distance metrics;
11: Recalculate cluster center;
12: else
13: Number of clusters plus one;
14: end if
15: end for
16: end while
17: end
3.3 Keyframe Extraction
In order to further evaluate the rationality selected for the clusters number K, the silhouette coefficient is introduced to improve the accuracy and stability of the clustering in k-means algorithm. Here, the silhouette coefficient s is defined as shown in Equation (9).
| (9) |
Herein a(i) shows the average dissimilarity distance between the i-th sample point and its assigned cluster, and b(i) represents the lowest dissimilarity distance between the i-th sample point and any other cluster except for its assigned cluster.
It can be observed from Equation (9) that the silhouette coefficient ranges from 1 to 1. The silhouette coefficient close to 1 means that a sample point is perfectly matched to its assigned cluster and poorly matched to the other ones. On the contrary, the low value of the silhouette coefficient close to 1 represents it is more appropriate for the current sample point to be assigned to its neighboring cluster. The average silhouette coefficient for all clusters can be used to measure how densely configured the overall clusters assignment, whose maximum corresponds to the number of clusters K (i.e., the number of final extracted keyframes for a video). Take a campus video as an example, the silhouette coefficient performed this method is shown in Figure 3. We can see from Figure 3 that the maximum of the silhouette coefficient is 0.6618, whose corresponding K value is 4. It means that the number of clusters and the number of keyframes finally extracted is 4 for this video.

Figure 3 The relationship of silhouette coefficient, the number of clusters and the average silhouette coefficient. (a) Silhouette coefficient and the number of clusters; (b) K and the average silhouette coefficient.

Figure 4 Flowchart of the proposed entire method.
Finally, the frame closest to the cluster center is selected as the keyframe for summary generation after determining the number of keyframes. Moreover, the final keyframes are arranged in order of the time sequence in the original video.
The entire algorithm is summarized in a flowchart as shown in Figure 4.
4 Experimental Results and Discussion
In the field of video summarization, their experimental results are evaluated using different methods on different datasets. Moreover, many of them neither made the datasets publically available nor publicize the implementation details for other researchers. Therefore, the comparison with large number of video summarization techniques is nearly impossible. Considering these, we test our method based on two different publically available video datasets and compare our method with other state of the art methods for performance evaluation. The reason is the diversity and several different video categories of the two selected datasets.
4.1 Datasets and Evaluation Metrics
The selected two available video datasets contain Open Video Project (OVP) dataset and YouTube dataset. The open video dataset consists of videos in MPEG-1 format with 30 frames per second (fps) on overage and dimension 352 240 pixels. These videos in OVP dataset are distributed among several categories such as documentary, educational, ephemeral, historical and lecture. The duration of videos varies from 1 to 4 minutes and their total length is approximately 75 minutes for the whole dataset. YouTube dataset composes of videos collected from YouTube web sites. The videos in this dataset are distributed in different genres (e.g., cartoons, news, sports, etc.) and their duration ranges from 4 to 10 minutes.
In order to quantitatively evaluate performance of video summarization generated from different algorithms, the two different evaluation metrics are used to evaluation the quality of video summarization for facilitating the comparison our method with other methods. (1) Three metrics: Precision, Recall and F-score; and (2) Two metrics: Accuracy rate CUS and error rate CUS.
(1) Precision, Recall and F-score
The proposed method is compared with state-of-the-art methods in the open video dataset using evaluation metrics of precision, recall, and F-score, whose formulas are given in Equations (10)–(12).
| (10) |
Where “N” represents the number of keyframes matched between the summary generated from the proposed algorithm and the ground truth summary in the dataset, and “N” shows the number of keyframes in generated summary.
| (11) |
Where “N” denotes the number of keyframes in ground truth summary. F-score is defined using Equation (12).
| (12) |
(2) Accuracy rate and Error rate
The proposed method is also compared with the other methods in the YouTube dataset using evaluation metrics of accuracy rate (CUS), and error rate (CUS), whose details are shown in Equations (13) and (14).
| (13) | ||
| (14) |
Where “N” is the number of matching keyframes from automatic summary, and “” is the number of non-matching keyframes from automatic summary.
4.2 Performance Evaluation
(1) Results on open video project database
It is challenging and difficult to find the ground truth summary for each video. Thus, benchmark video summarization datasets are comparatively less in literature. For this reason, we focus on evaluating our algorithm in the open video project dataset whose comparison is relatively easy and straight-forward with other algorithms. In our experiments, the ground truths are created by 50 users, and each video contains five user’s summaries available in the selected OVP dataset. The average evaluation result on five user’s summaries of ground truths is used as the final evaluation result. Using this dataset, the proposed algorithm is compared with other algorithms including VSUMM 1 [18], VSUMM 2 [18], OV [19], VRCVS [20], SMFR [21], and Ref. [22] in our work. The evaluation results are listed in Table 1 along with their precision, recall, and F-score.
Table 1 Performance comparison in precision, recall and F-score for different algorithms on open video dataset
| Methods | Precision | Recall | F-score |
| VSUMM 1 | 0.68 | 0.77 | 0.70 |
| VSUMM 2 | 0.73 | 0.71 | 0.69 |
| OV | 0.62 | 0.69 | 0.65 |
| VRCVS | 0.68 | 0.63 | 0.63 |
| SMFR | 0.58 | 0.80 | 0.65 |
| Ref. [22] | 0.70 | 0.82 | 0.73 |
| Proposed | 0.71 | 0.84 | 0.76 |
From Table 1, it can be observed that the proposed method achieves the best performance among every existing technique. First of all, F-score is a comprehensive evaluation of the quality of the video summary, reflecting the overall performance in generating video summaries. F-score of the proposed scheme is the highest among all compared algorithms (achieving 0.76 on average), which is 6%, 7%, 11%, 13%, 11%, and 3% higher than the VSUMM 1, VSUMM 2, OV, VRCVS, SMFR, and Ref. [22] algorithms, which shows our scheme outperforms all the compared algorithms in generating relevant video summaries. Secondly, Recall corresponds to the possibility of extraction over all ground truth keyframes, which reflects the ability to match the keyframe generated from the algorithm with the ground truth. The second column in Table 1 lists the average Recall value for each algorithm under observation, which shows that the proposed algorithm is the best and far superior to other six algorithms. Our algorithm is 7%, 13%, 15%, 21%, 4%, and 2% higher than the VSUMM 1, VSUMM 2, OV, VRCVS, SMFR, and Ref. [22] algorithms, which means more keyframes are matched in the extracted keyframes using our scheme. In general, the more number of extracted keyframes, the higher the Recall value may become, but this is at the risk of reducing Precision at the same time. Finally, Precision corresponds to the accuracy of an algorithm by using the generated false keyframes. The precision of the proposed algorithm is 3%, 9%, 3%, 13%, and 1% higher than the VSUMM 1, OV, VRCVS, SMFR, and Ref. [22] algorithms. Compared with VSUMM 2 algorithm, the precision of the proposed algorithm is slightly lower (only 0.02 loss). The reason is that the fewer keyframes are generated in VSUMM 2 algorithm. However, it may miss some keyframes due to fewer selected keyframes, which results in lower Recall (only 0.71) and greatly reducing the F-score (only 0.69). On the contrary, SMFR and Ref. [22] have higher value, but it may choose some frames not belonged to the ground truths, which results in a relatively poor Precision. From above comparisons, it can be concluded that the appropriate number of keyframes can be generated in order to achieve a trade-off between Precision and Recall. So that F-score can be overall improved, and then higher quality keyframes will be extracted. From these discussions, we can see that the generated video summaries by using our scheme are more reasonable and superior to other existing methods, and are representative enough to satisfy the users’ needs.
(2) Results on YouTube database
In addition, in order to further verify the quality of our method for videos with different characteristics of those of OVP and the two fused features in this paper are better than a single feature in other methods, the results of the proposed algorithm based on YouTube dataset are compared with the traditional k-means and Ref. [2] using evaluation metrics of accuracy rate (CUS), and error rate (CUS). Among them, the traditional k-means uses a single-color feature, and Ref. [2] selects the k-means++ clustering based on a single-color feature. Several representative videos from different video categories in this dataset are selected and results are compared with other algorithms as shown in Table 2.
Table 2 Comparison results of three algorithms for different videos in accuracy rate and error rate
| k-means | Ref. [2] | Proposed | ||||||
| Category | Size | FPS | CUS | CUS | CUS | CUS | CUS | CUS |
| MLB | 352 288 | 25 | 0.70 | 0.41 | 0.79 | 0.25 | 0.84 | 0.23 |
| NFL | 352 288 | 25 | 0.72 | 0.48 | 0.79 | 0.19 | 0.87 | 0.22 |
| Bike Polo | 352 288 | 25 | 0.69 | 0.44 | 0.82 | 0.24 | 0.80 | 0.27 |
| Average | 0.71 | 0.44 | 0.80 | 0.23 | 0.84 | 0.24 | ||
From the results as shown in Table 2, it can be observed that the proposed method achieves 84% accuracy rate on average, while error rate is only 24% on average in different video genres. Compared with Ref. [2], the accuracy rate of the proposed algorithm is still increased by 4% on average, while keeping almost the same error rate (only 1% loss on average). On the other hand, the proposed method achieves 13% accuracy rate improvement and 20% error rate reduction compared with the traditional k-means method. Furthermore, compared with the method presented in Ref. [2], the proposed method fuses the texture features on the basis of color features, improves the traditional k-means method using hierarchical clustering, and introduces the silhouette coefficient to evaluate the clustering effect, which lead to the superiority of our method in generating video summaries. In summary, through the comparison of these three methods, it can be concluded that the fusion of color and texture features makes the representation of image information more comprehensive, and improves the quality of generated keyframes.
4.3 Case Study
In order to further illustrate that our method not only has better objective summarization results, but also has better subjective evaluation results, Figures 5 and 6 show summarization samples for the visual comparison of generated keyframes of the various methods with the ground truth (i.e., user summarization result). The summarization samples in Figures 5 and 6 are respectively from the 22nd video and the 27th video in open video dataset. All the results are shown in rows for each algorithm, and the first row is a user summarization result (ground truth). The keyframes marked with red borders are those that match the ground truth.
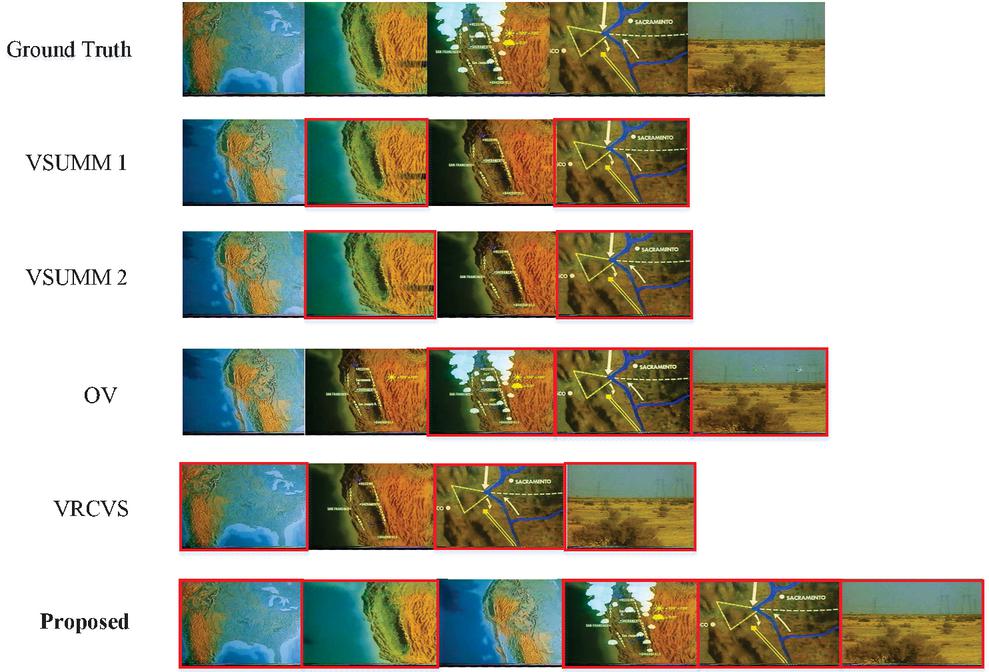
Figure 5 Comparison results of sample video summarization on 22nd video.
It can be observed from Figure 5 that the keyframes generated by the proposed algorithm contain all the user summaries, which is far superior to other algorithms in terms of Recall. Although the extracted keyframes of our method are one more frame than user generated summaries, this additional frame is also salient and memorable. Thus, the precision is only slightly reduced. Although both VSUMM 1 and VSUMM 2 only generate four keyframes, only two keyframes are matched with ground truth, and the first, the third and fifth keyframes are missed in user summaries. As for OV, the number of generated keyframes is the same as user summaries, but only three keyframes are matched with user summaries. Moreover, there are two frames that are similar each other, and it misses the first and second frames in user summaries. There are three keyframes are matched with user summaries in generated four keyframes by VRCVS, two keyframes are not selected. Therefore, we can conclude from the comparison on 22nd video that the generated keyframes not only cover user summaries as much as possible, but also select the appropriate number of keyframes. Otherwise, it is possible to only increase the Recall and reduce the accuracy. As a result, F-score cannot be improved and the overall quality of generated summaries cannot also be improved.
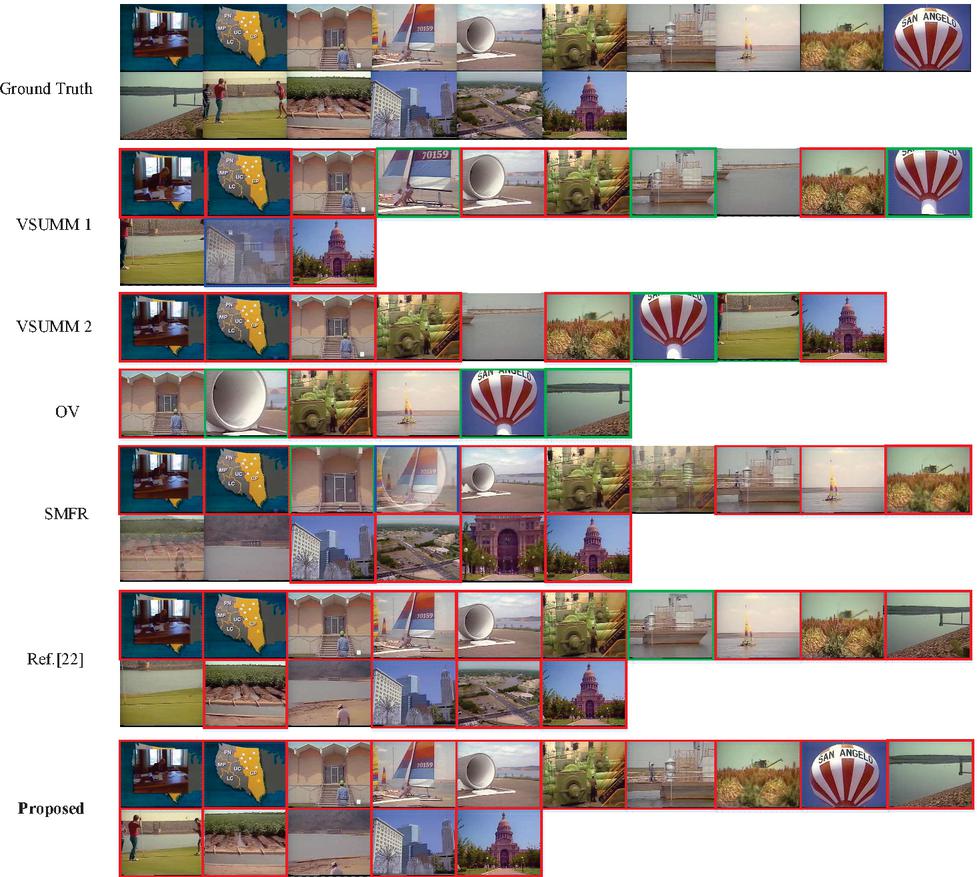
Figure 6 Comparison results of sample video summarization on 27th video.
It can be observed from Figure 6 that the generated summaries of our method contain visually important frames that are selected by users in their generated summaries. The keyframes marked with green borders are those that do not exactly match the ground truth, and the keyframes marked with blue borders are the transitional frames. As for VSUMM 2 and OV algorithms, they select few keyframes as video summarization, and they miss many keyframes in the ground truth. Compared with the sixteen keyframes generated by user summaries, VSUMM 2 only generates nine keyframes, but a non-matching keyframe and two incomplete matching keyframes are included. The reason that seven keyframes are not selected by VSUMM 2 may be the decrease of the number of clusters. Although OV algorithm only selects six keyframes, there are three incomplete matching keyframes. As for SMFR, the number of generated keyframes is the same as user summaries, but there are an incomplete matching keyframe and a transitional frame. Moreover, there are two frames that are similar each other and four keyframes that are non-matching compared with the ground truth. Furthermore, the tenth frame with salient object in ground truth is also missed in SMFR method. The summaries generated by VSUMM 1, Ref. [22] and our method are relatively reasonable, and there are no similar keyframes. However, three keyframes are missed in VSUMM 1, and there are two non-matching keyframes, three incomplete matching keyframes and one transitional frame. As a result, the summary generated by VSUMM 1 has relatively poor quality. There are the same number of generated keyframes in Ref. [22] as user summaries, but there are two non-matching keyframes and one incomplete matching keyframe. Same as SMFR, Ref. [22] also misses the tenth frame with salient object in user summaries. From the comparison on 27th video, our proposed algorithm has almost exactly the same summarization results as the ground truth. And that, no incomplete matching keyframe and transitional frame are generated in the proposed algorithm.
Combining two intuitive comparison results on 22nd and 27th videos, we can draw that the summary generated by our algorithm consists salient frames and is close to user summaries. It is more helpful for users to quickly retrieve and understand the video content.
5 Conclusion and Future Work
In this paper, a video summarization method is presented based on improved clustering and silhouette coefficient. Our method is three-fold: features extraction, initial clustering results obtaining and optimizing, and keyframes selection from each cluster for summary generation. The color features and the LBP operator are firstly fused and used as features extraction. Then, the initial clustering results are acquired using the hierarchical clustering, and k-means method is improved by introducing silhouette coefficient to optimize the initial results and evaluate clustering performance. Finally, the frame closest to the clustering center is selected as the keyframe to constitute the summary. The obtained experimental results based on two datasets show our method can improve the overall performance of generated video summaries, and outperform the state-of-the-art algorithms. However, due to the increased computational complexity, the processing time of the current method is also increased to a certain extent. Future work is needed to further improve the processing rate for practical application. For instance, we also plan to extend our work for applying to smart surveillance and internet of things [29, 30].
Acknowledgements
This work was supported by the Natural Science Foundation of the Anhui Higher Education Institutions of China (Grant No. KJ2019A0162), the Natural Science Foundation of Anhui Province, China (Grand No. 1708085MF154), and the Open Research Fund of Anhui Key Laboratory of Detection Technology and Energy Saving Devices, Anhui Polytechnic University (Grant No. DTESD2020B02).
References
[1] B. T. Truong and S. Venkatesh, “Video abstraction: A systematic review and classification,” ACM Transactions on Multimedia Computing, Communications, and Applications (TOMM), vol. 3, no. 1, pp. 3, Feb. 2007.
[2] A. Kapoor and A. Singhal, “A comparative study of K-Means, K-Means++ and Fuzzy C-Means clustering algorithms,” in 2017 3rd International Conference on Computational Intelligence & Communication Technology (CICT), Ghaziabad, India, 2017, pp. 1–6.
[3] S. Chakraborty, O. Tickoo, and R. lyer, “Adaptive keyframe selection for video summarization,” in 2015 IEEE Winter Conference on Applications of Computer Vision, Waikoloa, HI, USA, 2015, pp. 702–709.
[4] S. Mei, G. L. Guan, Z. Y. Wang, et al., “Video summarization via minimum sparse reconstruction,” Pattern Recognition, vol. 48, no. 2, pp. 522–533, Feb. 2015.
[5] G. L. Guan, Z. Y. Wang, S. Y. Lu, et al., “Keypoint-based keyframe selection,” IEEE Transactions on Circuits and Systems for Video Technology, vol. 23, no. 4, pp. 729–734, Apr. 2013.
[6] J. Fuentes, J. Ruiz, and J. M. Rendon, “Salient point tracking for key frames selection in outdoor image sequences,” IEEE Latin America Transactions, vol. 14, no. 5, pp. 2461–2469, May 2016.
[7] Y. Zhang, R. Tao, and Y. Wang, “Motion-state-adaptive video summarization via spatiotemporal analysis,” IEEE Transactions on Circuits and Systems for Video Technology, vol. 27, no. 6, pp. 1340–1352, Jun. 2017.
[8] G. L. Priya and S. Domnic, “Shot based keyframe extraction for ecological video indexing and retrieval,” Ecological Informatics, vol. 23, pp. 107–117, Sept. 2014.
[9] A. Sasithradevi, S. M. M. Roomi, G. Maragatham, et al., “Video summarization using hierarchical shot boundary detection approach,” in 2017 Ninth International Conference on Advances in Pattern Recognition (ICAPR), Bangalore, India, 2017, pp. 1–5.
[10] C. Huang and H. M. Wang, “A novel key-frames selection framework for comprehensive video summarization,” IEEE Transactions on Circuits and Systems for Video Technology, vol. 30, no. 2, pp. 577–589, Jan. 2019.
[11] M. Ma, S. Mei, S. Wan, et al., “Video summarization via block sparse dictionary selection,” Neurocomputing, vol. 378, pp. 197–209, Feb. 2020.
[12] K. Muhammad, T. Hussain, and S. W. Baik, “Efficient CNN based summarization of surveillance videos for resource-constrained devices,” Pattern Recognition Letters, vol. 130, pp. 370–375, Feb. 2020.
[13] S. Zhang, Y. Zhu, and A. K. Roy-Chowdhury, “Context-aware surveillance video summarization,” IEEE Transactions on Image Processing, vol. 25, no. 11, pp. 5469–5478, Nov. 2016.
[14] S. S. Thomas, S. Gupta, and V. K. Subramanian, “Perceptual video summarization- A new framework for video summarization,” IEEE Transactions on Circuits and Systems for Video Technology, vol.27, no. 8, pp. 1790–1802, Aug. 2017.
[15] G. Zhang, C. Zhang, and H. Zhang, “Improved K-means algorithm based on density Canopy,” Knowledge-based Systems, vol. 145, pp. 289–297, Apr. 2018.
[16] F. S. Wang, F. R. Liu, S. M. Zhu, et al., “HEVC intra frame based compressed domain video summarization,” in Proceedings of the International Conference on Artificial Intelligence, Information Processing and Cloud Computing, Hainan, China, 2019, pp. 1–7.
[17] S. S. Thomas, S. Gupta, and V. K. Subramanian, “Context driven optimized perceptual video summarization and retrieval,” IEEE Transactions on Circuits and Systems for Video Technology, vol. 29, no. 10, pp. 3132–3145, Oct. 2019.
[18] S. De Avila, A. Lopes, A. Luz Jr, et al., “VSUMM: A mechanism designed to produce static video summaries and a novel evaluation method,” Pattern Recognition Letters, vol. 32, no. 1, pp. 56–68, Jan. 2011.
[19] D. DeMenthon, V. Kobla, and D. Doermann, “Video summarization by curve simplification,” in Proceedings of the Sixth ACM International Conference on Multimedia, Bristol, UK, 1999, pp. 211–218.
[20] J. Wu, S. Zhong, J. Jiang, Y. Yang, “A novel clustering method for static video summarization,” Multimedia Tools and Applications, vol. 76, no. 7, pp. 9625–9641, Mar. 2017.
[21] E. Elhamifar, G. Sapiro, and R. Vidal, “See all by looking at a few: Sparse modeling for finding representative objects,” in 2012 IEEE Conference on Computer Vision and Pattern Recognition, Providence, RI, USA, 2012, pp. 1600–1607.
[22] J. Li, T. Yao, Q. Ling, T. Mei, “Detecting shot boundary with sparse coding for video summarization,” Neurocomputing, vol. 266, pp. 66–78, Nov. 2017.
[23] K. M. Mahmoud, M. A. Ismail, and N. M. Ghanem, “VSCAN: an enhanced video summarization using density-based spatial clustering,” in International Conference on Image Analysis and Processing, Berlin, Heidelberg, 2013, pp. 733–742.
[24] D. Saravanan, “Efficient video indexing and retrieval using hierarchical clustering technique,” in Proceedings of the Second International Conference on Computational Intelligence and Informatics, Berlin, Heidelberg, 2018, pp. 1–8.
[25] V. Cohen-Addad, V. Kanade, F. Mallmann-Trenn, et al., “Hierarchical clustering: Objective functions and algorithms,” Journal of the ACM, vol. 66, no. 4, pp. 1–42, Jun. 2019.
[26] M. Hasanzadeh-Mofrad and A. Rezvanian, “Learning automata clustering,” Journal of Computational Science, vol. 24, pp. 379–388, Jan. 2018.
[27] M. Furini, F. Geraci, M. Montangero, M. Pellegrini, “STIMO: Still and Moving video storyboard for the web scenario,” Multimedia Tools and Applications, vol. 46, no. 1, pp. 47–69, Jan. 2010.
[28] M. Asim, N. Almaadeed, S. Al-Maadeed, et al., “A key frame based video summarization using color features,” in 2018 Colour and Visual Computing Symposium (CVCS), Gjøvik, Norway, 2018, pp. 1–6.
[29] G. Han, L. Liu, S. Chan, et al., “HySense: A hybrid mobile crowdsensing framework for sensing opportunities compensation under dynamic coverage constraint,” IEEE Communications Magazine, vol. 55, no. 3, pp. 93–99, Mar. 2017.
[30] M. Tang, L. Gao, and J. Huang, “Communication, computation, and caching resource sharing for the internet of things,” IEEE Communications Magazine, vol. 58, no. 4, pp. 75–80, Apr. 2020.
Biographies

Fengsui Wang received the Ph.D. degree from Nanjing University, Nanjing, China, in 2013, in circuits and systems. He was a visiting scholar at the University of Bridgeport, Connecticut, USA, in 2017. Since 2013, he has been a Faculty Member with Anhui Polytechnic University, Wuhu, China. His current research interests include the areas of image processing, video communication, machine learning and computer vision.

Jingang Chen received the B.S. degree from Anhui Polytechnic University, Wuhu, China, in July 2019. Now he is an M.S. candidate in Anhui Polytechnic University. His current research interests include machine learning and image processing.

Furong Liu received the B.S. degree from Anhui Polytechnic University, Wuhu, China, in July 2019. Now she is an M.S. candidate in Anhui Polytechnic University. Her current research interests include machine learning and video analysis.
Journal of Web Engineering, Vol. 20_1, 147–170.
doi: 10.13052/jwe1540-9589.2018
© 2021 River Publishers