An Empirical Study of Web Page Structural Properties
Xavier Chamberland-Thibeault and Sylvain Hallé*
Laboratoire d’informatique formelle
Université du Québec à Chicoutimi, Canada
E-mail: shalle@acm.org
*Corresponding Author
Received 30 October 2020; Accepted 29 March 2021; Publication 24 June 2021
Abstract
The paper reports results on an empirical study of the structural properties of HTML markup in websites. A first large-scale survey is made on 708 contemporary (2019–2020) websites, in order to measure various features related to their size and structure: DOM tree size, maximum degree, depth, diversity of element types and CSS classes, among others. The second part of the study leverages archived pages from the Internet Archive, in order to retrace the evolution of these features over a span of 25 years. The goal of this research is to serve as a reference point for studies that include an empirical evaluation on samples of web pages.
1 Introduction
Over the past years, several tools and techniques have been developed to analyze, debug, detect errors, or otherwise process the output produced by web applications. Many of these tools focus on an analysis of the Document Object Model (DOM) of a page, and accessorily to the Cascading Stylesheet (CSS) declarations associated to its elements. For example, X-PERT [5] and FIX [13] attempt to fix cross-browser issues; Cornipickle [6] is a general purpose interpreter for declarative specifications over DOM elements and their rendered attributes; ReDeCheck [16] performs an analysis of a page’s rendered DOM to detect responsive web design (RWD) bugs.
A common point to these approaches, and to many others, is that their scalability – and ultimately, their success – is dependent on features of a page that are typically related to its size. Hence, the running time for ReDeCheck scales according to the number of DOM nodes in the target page; Cornipickle scrapes a page in time proportional to the number of DOM nodes, and evaluates a declarative property in time proportional to the number of elements matching any of the CSS selectors found in that property; some RWD constraints scale proportionally to the number of nodes and the maximum number of direct children they have; etc.
Most of the aforementioned works duly provide an empirical evaluation of the proposed tools on a sample of pages or websites. However, it is hard to assess where these samples lie across the whole spectrum of web pages that may exist “in the wild”. For example, the experimental analysis in [16] is run against documents of up to 196 DOM nodes: is this typical of a large web page, or a small one? Without data making it possible to situate such values with respect to a larger population, the authors, readers and reviewers alike are left speculating, with often conflicting viewpoints, to what extent the tested samples can be accepted as reasonably “real”.
Other questions may also arise regarding the evolution of these profiles according to time. It is reasonable to believe that websites from 2020 are different from the HTML documents that were produced by developers in the 1990s. This assertion is typically based on nothing but common sense: exactly how these pages are different, and when – and at what rate – changes in their structure occurred, is, as far as we know, undocumented. Yet observing the past, and identifying trends (as well as “non-trends”) in the evolution of pages, may help foresee how the web may look in the future.
The present paper aims to address this issue. First, it reports on results of a large-scale analysis of 708 websites, with the goal of measuring various parameters related to the structure and size of their pages, such as the size of the DOM tree, degree distribution of its nodes, depth, distribution of various element types, diversity of CSS classes, etc. In this respect, the paper is an extension of a previous study that concentrated on structural profiles of websites in contemporary (2019–2020) snapshots [3]. Among the findings extracted from this study, we can mention that: 1. the size of web pages follows an inverse exponential distribution with surprisingly high precision, and almost all pages surveyed contain fewer than 2,000 HTML tags; 2. pages have a nesting depth averaging 12 to 14 levels; 3. the fraction of invisible elements in a page follows a roughly uniform distribution.
Second, in addition to a detailed study of this data corpus, the present paper also provides a longitudinal study of the same characteristics on archived websites spanning almost 25 years (1996–2020). The first part of the study sheds some light to the characteristics of modern websites, while the second part aims for deeper knowledge of trends in the evolution of websites and thus help identify how websites have changed so far or will change in the future. To this end, it leverages the content of the Internet Archive, in the form of its Wayback Machine,1 to harvest more than 250 snapshots of various sites at different points in time. These snapshots are then grouped into time slices and analyzed according to the same metrics as above. The comparison of these various slices makes it possible to witness the evolution of the web over time. This second part of the study leads to interesting findings of its own: 1. web pages grow in terms of tag count, but this growth mostly affects the width of the DOM tree and not its depth; 2. the switch from table-based to CSS-based layout was complete by 2010; 3. layout-based elements amount for an ever-increasing amount of markup.
Ultimately, the goal of this research is to provide an objective (albeit partial) reference point allowing practitioners to quantitatively situate the samples used in research works that include an empirical evaluation. The paper’s contributions can be summarized as a description of the methodology used to harvest and process data, a reusable and freely-available software package that can be used to process and explore the results, and a repository of all the raw data used in the analysis.
The rest of the paper is structured as follows. Section 2 presents a contemporary profile of web page structures; it describes the methodology that was defined to harvest, analyze and compile various metrics over a corpus of web pages from the present. This description is followed by a detailed study and discussion of structural characteristics of websites. Section 3 then focuses on the longitudinal study, and follows a similar pattern. Section 4 discusses the various threats to the validity of the experimental results shown in the paper, and assess the merits of various modifications that could be made to the methodology in subsequent studies. Finally, Section 5 summarizes the findings presented in the paper, and also suggests research questions that could be the starting point of further empirical studies on websites, both present and past.
2 A Contemporary Profile of Web Page Structures
We start this paper by describing an analysis of the structure of contemporary web pages, which was conducted between December 2019 and January 2020.
2.1 Methodology
To accomplish such an analysis, a few steps had to be followed. At first, we had to collect a large enough sample of websites for the analysis to be meaningful, then we had to find a way to collect the data from the previously found websites and, at last, process the recovered data. In this section, we shall present how each of those steps were fulfilled.
2.1.1 Website collection
As for the website selection, we first had to choose the size of our sample. After some deliberations, we agreed that 708 was large enough to be meaningful and representative. The first step of the process was to collect the list of websites to be included in our sample. We opted for a combination of two methods. First, we considered the first 500 most frequented websites in the world, by retrieving data from the latest list found on Moz [1]. However, this list contains many duplicates made of country-specific versions of the same platform. These duplicates have been removed, keeping only the first occurrence of each site. The remaining sites from this list (approximately 300) accounted for around 40% of our total sample.
This first sampling step provides us with a set of sites that are visited by the most users. However, this notion is orthogonal to the sample of sites most visited by an individual user. To illustrate this, consider a set of websites and users. Site is visited once by each user, and for each , site is visited times by user . Site has the majority of all traffic, but only represents a small fraction of the visits made by any single user. For example, With , accounts for 53% of all traffic (compared to less than 5% for each of the remaining sites), but only accounts for 10% of all visits for any single user. That is, the fact that a site impacts the most people does not necessarily imply it impacts people most significantly.
In order to address this issue, we added a second part to our sampling step, by informally asking people around to provide us with the list of websites they use daily. Therefore, by combining these two data collection methods, we got the most commonly used ones in the world and various day-to-day websites. The complete dataset and scripts can be downloaded.2
2.1.2 DOM harvesting
After the list of websites was established, the next step was to collect data on the DOM for each of these sites. This was done by creating a JavaScript program which is designed to run when the DOM of a page has finished loading.
The script starts at the body node of a page and performs a depth first preorder traversal of the integral DOM tree of that page. For every node, the script records and/or computes various features:
• tag name; this is used to record the usage proportion of elements
• CSS classes associated to the element; this is used to measure the diversity and distribution of CSS classes in a document
• visibility status; elements in the page can be made invisible in various ways: setting their position outside the viewport, setting their dimensions to 0, using the display or visibility CSS attributes; the script records if any of these techniques is applied on the rendered element
• structural information, such as degree and depth from the root, the minimum/maximum degree of its children, and minimum/maximum depth of the paths starting from this node down to a leaf
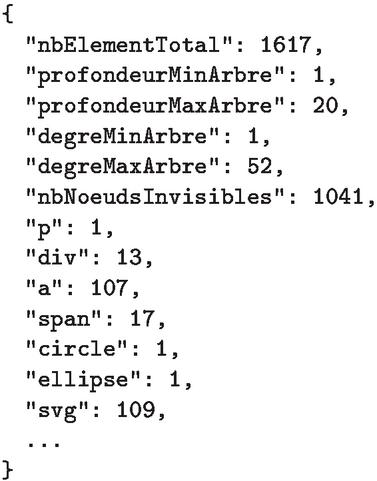
Figure 1 An excerpt from the JSON file produced by the harvesting script.
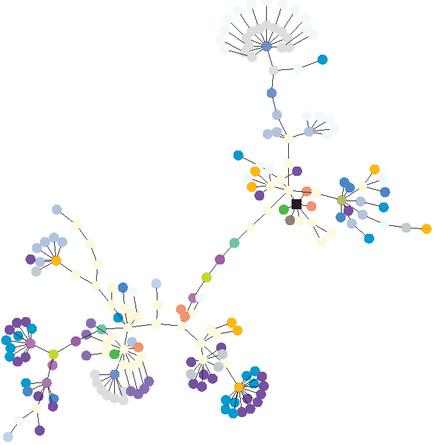
Figure 2 An example of a DOM tree represented graphically, as produced by our harvesting script. Each color represents a different HTML tag name. The root of the tree is the black square node.
For a given page, the output of the script is made of two files: the first is a JSON document containing a nested data structure that mirrors the structure of the page’s DOM tree, where each node is a key-value map containing the features mentioned above. The file also contains global statistics computed on the DOM, such as the number of elements for each tag name, class and method of invisibility. The second document is a text file in the DOT format accepted by the Graphviz3 library. It can be used to produce a graphical representation of the DOM, where each tag name is given a different color. An example of such a tree (for the Zippyshare.com website) is given in Figure 2.
In order to actually harvest the data from a web page, we used the TamperMonkey4 extension, which allows users to inject and run custom JavaScript code every time a new web page is loaded in the browser.5 This extension also presents the advantage that versions exist for multiple browsers, including Chrome, Firefox, Edge and Safari. For each website in our sample, the home page URL was loaded and our TamperMonkey script was run on this page.
It shall be emphasized that the harvesting step on each web page is performed in the browser, and hence operates on the DOM tree and on properties of the elements as they are actually rendered by the browser. That is, our script does not perform a simple scraping of the raw HTML code returned by the server. Doing so would miss all the elements that are dynamically inserted or modified by client-side scripts at load time. Overall, running the scripts over the 708 sites takes approximately 6.5 hours and generates 62 MB of raw data.
2.1.3 Data processing
Since the volume of data recovered was really high, we had to find a way to parse it efficiently to get the desired information. As the tool for the tree representation of the pages was decided beforehand, all we had to do was to run the .dot files containing the representation of each HTML node of the web page as a name-color-reference node through Graphviz, effectively recreating the DOM tree visually and saving it to PDF files. Figure 3 shows another example of tree for a larger website.
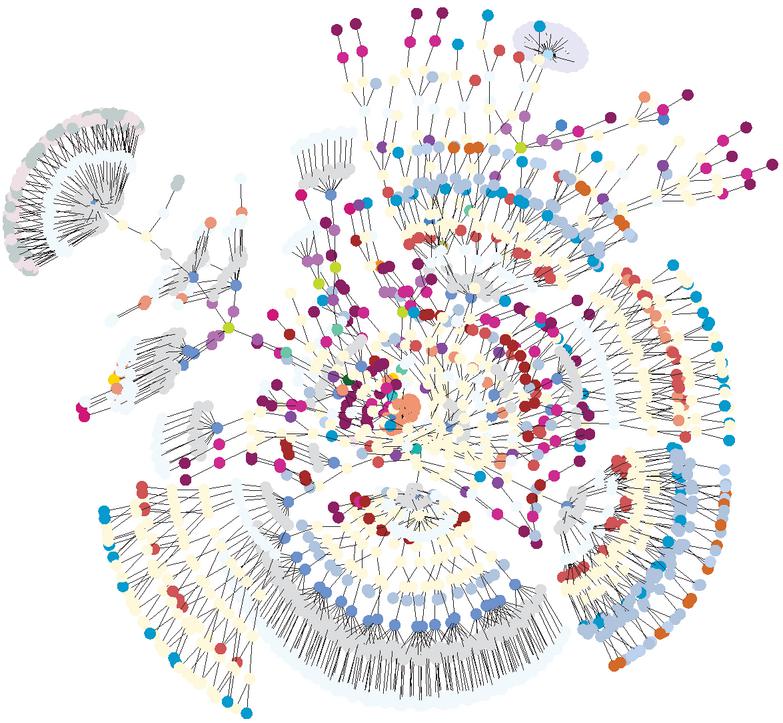
Figure 3 The structure of the eBay front page at load time.
The TamperMonkey part of our processing pipeline computes statistics for a single web page at a time. As a second step, we aggregated these various measurements to compute statistics over the whole sample of pages, so as to get information such as distributions for various numerical parameters, using the LabPal experimental processing framework [7]. This library makes it possible to load, process, transform, and display empirical data in the form of tables, macros and plots. The basic unit in LabPal is called an experiment, which is a runnable object that takes input parameters and produces output data. Our LabPal instance is designed such that every website is an experiment instance, whose task is to read the corresponding raw JSON files and compute various additional statistics on the structure of the DOM tree. These results are then collated in various ways into tables and plot, showing features such as the distribution according to the degree of the tree, its depth, the usage of tags, CSS class distribution, the size of the web pages and the distribution of method used to hide elements.
In this case, we decided that each JSON file, or in other terms each web page, as an experiment. This way, we would be able to see all the data for each page individually and be able to combine the data of each page through tables and plots to get the desired information. From there, we created specific tables that would allow us to receive the exact data we want and process them toward the selected output. Thus, we created four new tables:
• a table that would generate a table suitable for histogram which would always correlate a specific attribute of the web pages to the total number of recovered web pages;
• the very same table but producing percent based information;
• another percent based histogram but this time correlating two desired attributes together;
• a table suited for pie charts that could take a list of parameters to correlate together.

Figure 4 A screenshot showing an example of the LabPal user interface.
It is to be noted that some of the recovered files were not used in the analysis. As was said earlier, the automated loading of web pages made us retrieve a lot of advertisement pop-ups – which arguably do not really count as “real” web pages, in the sense meant by most papers concerned with analyzing the DOM. Manually inspecting each file to judge whether it is an advertisement page or a normal web page is a tedious process. We therefore opted for a more general rule that would remove most of these pages: we took away from the analyzed data each page that contained fewer than 5 DOM nodes, or whose URL belonged to a list of domains that are known to be advertisement pages.
Combined, the data processing scripts presented in this paper amount to close to 4,000 lines of Java code, and make heavy use of the LabPal experimental library for the creation of tables and plots.
2.2 Results
In this section, we shall present a summary of the most important features, as well as a few interesting highlights and take-home points that should be taken from this study. As will be described at the end, the complete datasets are fully and publicly available online, for any reader interested in reproducing our analysis or processing the data from a different angle. The combined size of all websites visited amounts to a total of 623100 DOM nodes.
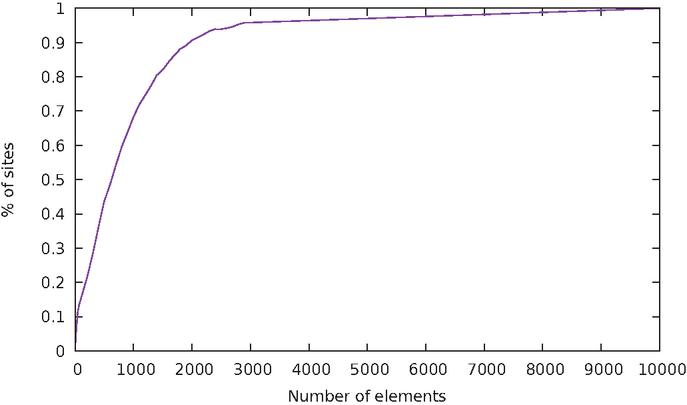
Figure 5 Cumulative distribution of websites based on the size of DOM tree.
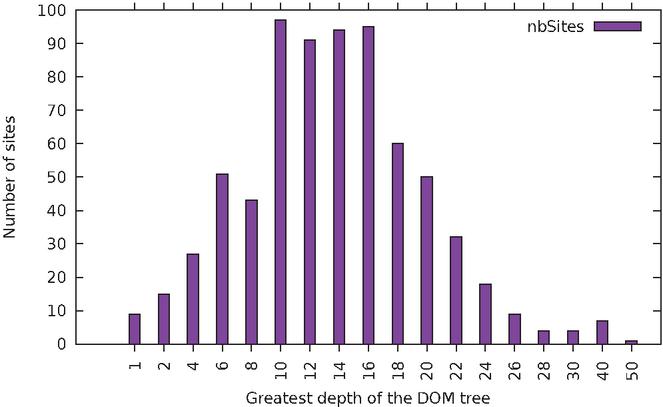
Figure 6 Distribution of websites based on DOM tree depth.
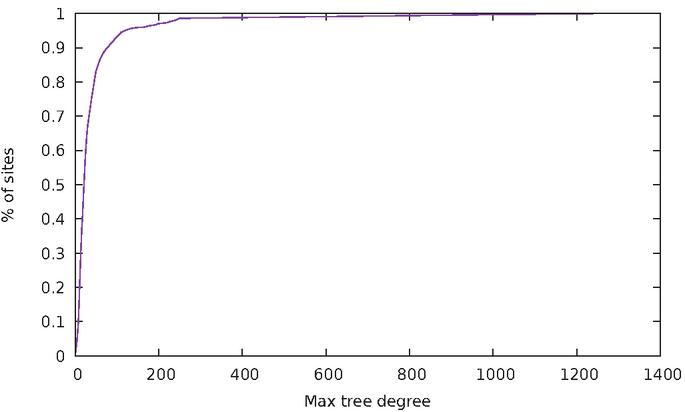
Figure 7 Cumulative distribution of websites based on maximum node degree.

Figure 8 Distribution of websites based on maximum node degree.
2.2.1 DOM tree structure
A first statistic we computed is the number of elements in a web page across all sites. Figure 5 shows the cumulative distribution, where the line represents the fraction of all sites that have fewer than some number of elements. From this, we can observe that half of all websites have fewer than 700 nodes, and 90% have fewer than 2000. The distribution of the number of elements in a web page very closely matches an inverse exponential function. In our dataset, the fraction of the number of pages having elements or less is given by the function ; the coefficient of determination is , which indicates a surprisingly strong fit with the regression.
We also computed the depth of the DOM tree for each website; this corresponds to the maximum level of nesting inside the top-level body element. The distribution across websites is shown in Figure 6.The distribution assumes a relatively smooth bell shape; 39% of all sites have a maximum depth between 10 and 16.
A complementary measurement to the depth of the DOM tree is the maximum degree (i.e. number of direct descendants) that a DOM node can have. This is represented in Figure 7. 50% of websites have a maximum degree of at most 22, while 90% of websites have a maximum degree of at most 80. This time, a good fit for the data is the function , with a high coefficient of determination of .

Figure 9 Relative proportion of tag names across all web pages.
A fourth statistic related to tag usage across websites. We measured the relative proportion of each HTML element name, excluding tags corresponding to inline SVG markup. This is shown in Figure 9. Unsurprisingly, div is the most frequent tag, representing 26% of all elements in a page. It is followed by a (19%), li (11%) and span (10%). Combined, these four elements account for two-thirds of all tags found in a page. No other tag has a frequency greater than 4%. Given that div and span have no special meaning, and are only used to enclose elements for display purposes, we can conclude that more than one third of all HTML markup is not semantic.
2.2.2 Visibility status
Of all DOM nodes in the websites analyzed, 54% were invisible to the user by one of the available techniques. This is a rather surprising finding, which means that more than half of a page’s markup corresponds to elements that are not immediately displayed to the user, such as scroll-down menus or pop-ups. Table 1 shows the distribution of websites according to the fraction of nodes that are invisible. One can see that this distribution is fairly uniform, with a roughly equal number of websites for each 10% interval of invisible nodes.
Table 1 Total number of elements using each visibility
| Elements | Invisible Type |
| 0 | Display |
| Width or height | |
| 131334 | Visibility |
| 213840 | Outside position |
| 536700 | Negative position |
An interesting finding is that the techniques used to make elements invisible are not uniformly distributed. Figure 10 shows that, of all invisible elements across the analyzed pages, 60% are made so by assigning them a negative position. Surprisingly, none of the websites analyzed used display:none or a dimension of zero to make nodes invisible.
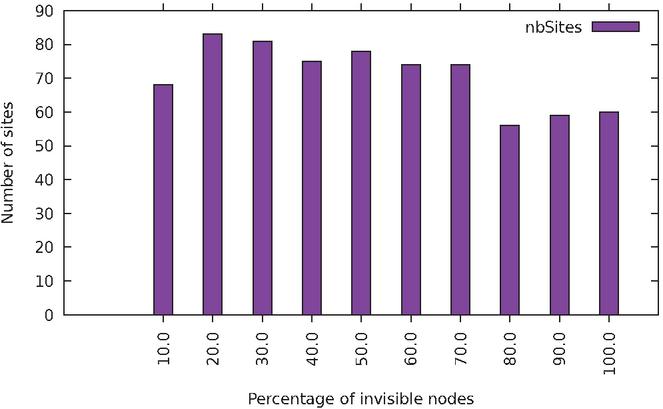
Figure 10 Distribution of websites according to the fraction of all DOM nodes that are invisible.
2.2.3 CSS classes
Another aspect of our study is concerned with the CSS classes associated with elements of the DOM, either directly with the class attribute, or programmatically using JavaScript.
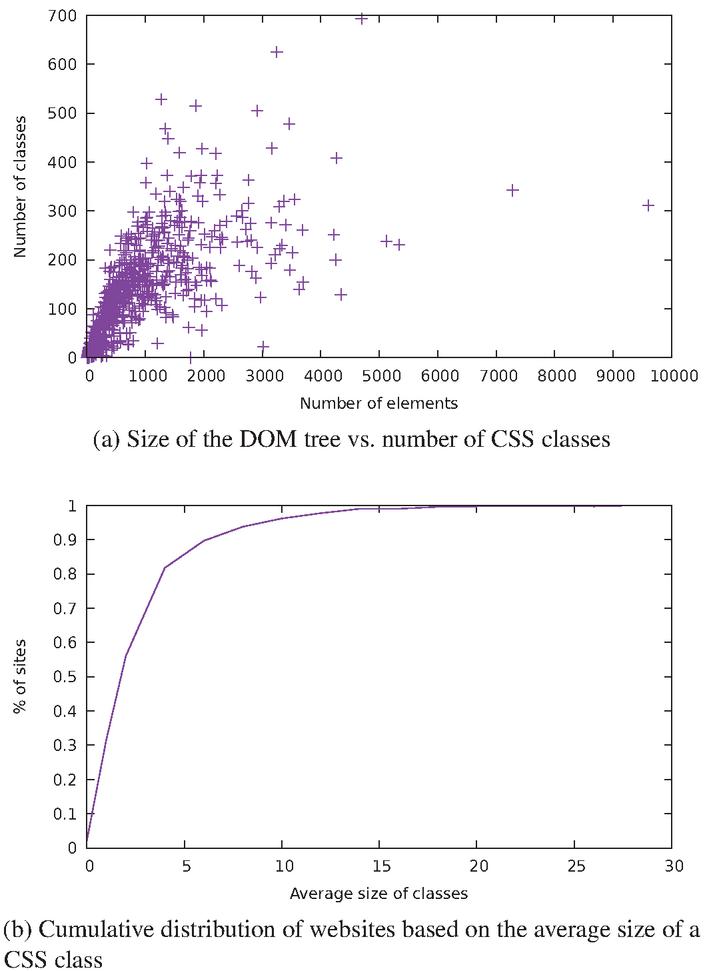
Figure 11 Statistics about the use of CSS classes.
We first checked whether there is a correlation between the size of the DOM tree and the number of distinct CSS class names occurring in the tree. This can be represented graphically with the plot of Figure 11a. As one can see, there is a relatively loose dependency between the size of a website and the number of classes it contains. We also calculated, for each website, the average size of each CSS class (i.e. the average number of DOM nodes belonging to each distinct CSS class present in the document). The function , which represents the fraction of all sites having an average CSS class size of or less, fits the experimental data with a coefficient of determination of .
3 The Temporal Evolution of Web Page Structure
The study described in the previous section provided interesting findings about the current (2019–2020) state of web pages; it was first presented in June 2020 at the 20 International Conference on Web Engineering (ICWE) [3]. It was then suggested by participants that this analysis be repeated periodically on extant websites. The result would be a longitudinal study, making it possible to witness any evolution in the structural features of pages found on the Internet over time.
In the meantime, we deemed interesting to conduct such a longitudinal study by looking back at what pages used to be. This could help identify any trends that occurred in the Internet of the past, and help anticipate important features of the web pages in the Internet of the future. This section describes the methodology and results extracted by this study, which was conducted in September and October of 2020. As with the contemporary study, all the data files and source code for the analysis are available online [4].
3.1 Methodology
Our primary source of information for this longitudinal study is the Internet Archive, through a feature called the Wayback Machine.6 The Internet Archive is a free digital library archiving the internet itself, among other things like TV shows or books. For over 20 years, it has been collecting web pages to generate an historical database of how the websites, and thus the Internet itself, evolved throughout the years.
To gather pages, the archive uses the Alexa Internet7 crawler, which was created around the same time as the Internet Archive in 1996, which was archiving the pages that where visited, or crawled. Theses archived pages, taken at a specific moment, are often referred to as snapshots. The goal of this method was to archive as much of the public web as possible. It is noteworthy to mention that the crawler archives a single page at a time, and not a whole website. Thus it is possible that some parts of a specific website do not have matching snapshots, since they may have been taken days or even years apart.
The data harvested by the machine was not accessible to the public until 2001, when it has been complemented by the Wayback Machine, which is a tool allowing everyone to freely navigate throughout all the archived pages throughout the years. This web application is fairly easy to use by anyone. First of all, a user searches the Internet Archive’s data for a specific website. Once he has found the desired site, he can then navigate throughout snapshots taken over the years for that specific website. Once one has been selected, the website’s page, as it was when the snapshot was taken, is loaded in the user’s browser. Figure 12 shows an example of such a page.
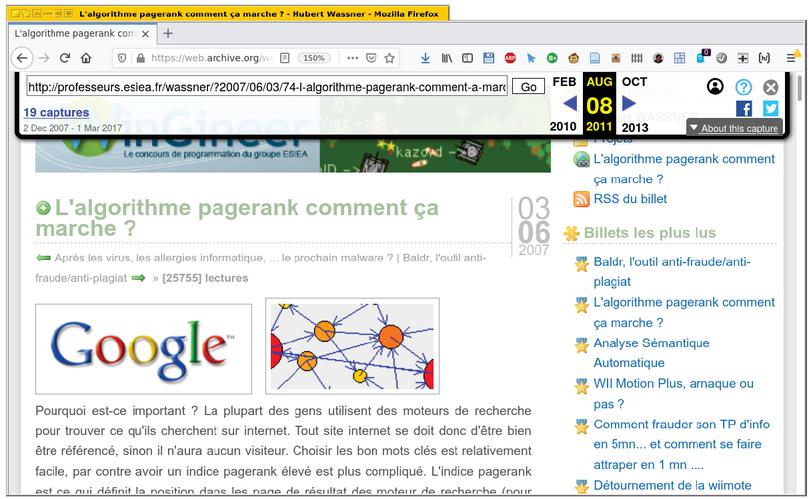
Figure 12 A page displayed within the Wayback Machine. The top menu is overlaid on the original page; it shows that the snapshot has been taken in August 2011.
Over the years, the archive has been used for various purposes such as legal actions [10], patent litigation [11], study of the evolution of JavaScript remote inclusions [14], and has also been the subject of academic studies in its own right [2].
3.1.1 Web site selection
In order for our longitudinal study to show the evolution of websites over a long period of time, our first design decision was that our selection of websites needed to include the same set of pages on every year. We quickly found that this seriously limits the number of sites that can be included in the analysis.
Therefore, the data harvesting was made with two different methods. Since the data collection through the Wayback Machine is a very long process, the first selection of websites aimed to test the field and see if we could find some tendencies, thus revealing if a larger analysis was worth making. We opted for ten well-known websites that we chose among the list created and described in Section 2.1.1, which are Amazon,8 Ebay,9 Microsoft,10 Yahoo,11 Nytimes,12 Cnn,13 Apple,14 Blogger,15 Adobe16 and Mozilla.17 Once we ran a first check through the data harvested, we chose to extend our sample. Once again, we started from the websites list of the previous research. We then randomized the list, minus the ten above mentioned sites. From this now randomized list, we took the first hundred of them as the remainder of the sample for this study.
This study uses a much smaller sample than the previous one since data harvesting from the Wayback Machine is extremely long; this will be discussed in the following section. Moreover, it shall be mentioned that our sample does not include a snapshot of every site on every year from 1996 to 2020, for the simple reason that few sites on the archive would satisfy this condition and would reduce our selection even further.
3.1.2 DOM harvesting
For each individual website, we wanted to harvest, as much as possible, the first snapshot taken for every year. This is possible, thanks to the Wayback Machine providing a programmatic API that allows users to query the database for the presence of a snapshot, for a given URL and a specific timestamp. Figure 13 shows an example of the JSON reply obtained by querying the API for the site foo.com and the timestamp 20060101 (January 1, 2006).
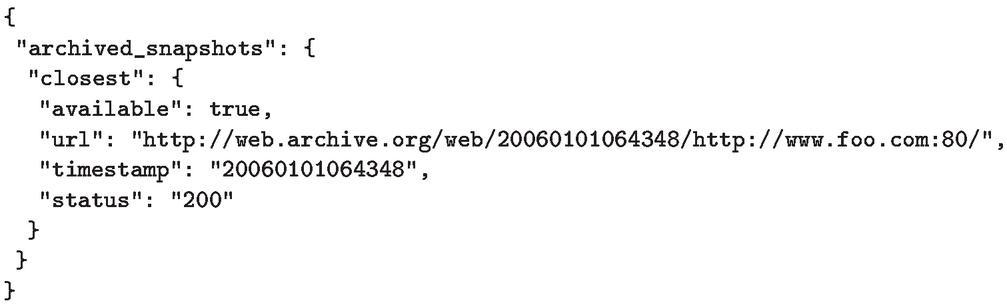
Figure 13 An example of the reply provided by the Wayback Machine’s API.
However, for a given timestamp, the API only returns the closest snapshot found within the corresponding month, if such a snapshot exists. That is, one cannot simply ask for the list of all available snapshots. Therefore, in order to collect site snapshots based on the list created in the previous step, we had to query the API for every month of every year from 1996 to 2020. The response from the API is relatively slow; to prevent any race conditions, we had to add a 20-second delay between each call, to make sure the API had responded before launching a new request.
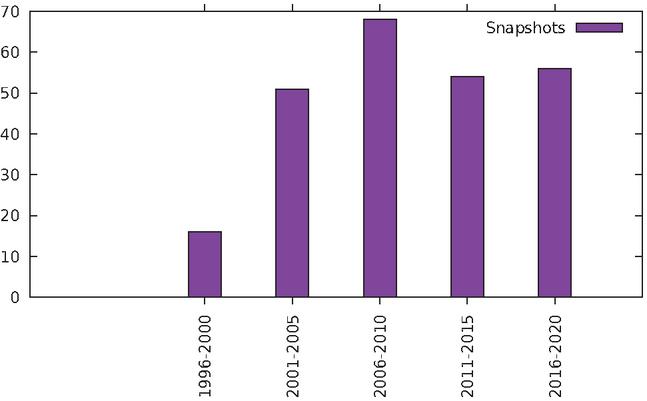
Once a snapshot was found, our script could then open the snapshot in a new browser tab, and wait for it to finish loading. This was done through the run-at parameter of the TamperMonkey extension. The snapshots’ loading time varied between a few seconds to several minutes; in addition, the DOM harvesting script has a hard-coded delay of 30 seconds to allow for the files to be generated before closing the tab. Adding all these various delays together results in a very slow extraction procedure, which was run overnight on spare computers. A typical 10-hour scraping session could extract 25-year historical snapshots for no more than a dozen websites at a time. Table 2 presents a summary of the number of site snapshots obtained for each 5-year window, between 1996 and 2020.
Table 2 Number of web page snapshots included in each time window, for our longitudinal study
 |
The harvesting step for each snapshot has been conducted in a similar way as in the first part of the study. However, it shall be noted that the collected snapshots are not exact replicas of the original pages: the Wayback Machine performs a few modifications when displaying them to the user. First, any external resources referenced in the page (CSS and JavaScript files, in particular) are rewritten so that they can point to the corresponding archived copy inside the database. Second, the Wayback Machine injects scripts and HTML code in order to display a menu and a timeline, overlaid on top of the page’s contents (cf. Figure 12). This allows users to continue to navigate through all the snapshots taken for the selected website.
Therefore, pages had to be cleaned before being analyzed by the scripts described
in Section 2.The page cleaning was made in two separate
steps. First of all, the JavaScript probe removed the div element, and all
its children, representing the Wayback Machine control display. Once this first
clean up has been made, the probe harvests the DOM of the web page. A second
cleaning step is made directly in the LabPal laboratory that processes the data
files: from the count of elements by tag name read from each file, it subtracts
two div and one iframe (these are hidden elements on the page
included by the Wayback Machine to handle donations), and two script tags.
This step had to be done from within the LabPal, and not the JavaScript probe, for
the main reason that the script elements could not be removed neatly from
within JavaScript – we would have had to always remove the first two
scripts tags encountered within the page, hoping that they were always
Wayback Machine’s included elements. If this were not the case, removing these
scripts could have prevented legitimate scripts in the actual page snapshots from
executing, potentially disturbing the display.
3.1.3 Data analysis
After cleaning, the files produced by the harvesting step described above were in exactly the same format as those produced in Section 2. The analysis could then be performed in the same way. As was hinted earlier, in most of the analysis steps we chose to group the harvested sites into “pools” or “windows” of five years, in order to even out variations that could be caused by the relatively small size of our sample.
Our scripts from the original study were adapted to produce the same tables and plots, but for a given pool of web pages, making it possible to make comparisons between pools. In addition, new tables and plots were created to witness the evolution of a particular metric across snapshots; Figures 14 and 17 are two examples of such plots.
3.2 Results and Discussion
We shall now present a summary of the most important features, as well as a few interesting highlights and take-home points that should be taken from this second part of our study. As for the results in Section 2, complete datasets are again publicly available online.
3.2.1 Structural properties
This is shown in Figure 14. One can see that the median size of pages, in our samples, has been constantly increasing, and at a relatively even pace, rising from under 300 elements in 1996–2000 to over 800 in 2016–2020. However, the depth of the resulting DOM trees has remained largely unchanged throughout. One can see in Figure 15 that that depth oscillates in the range 15–20, without any clear upward or downward trend. In other words, although pages are bigger overall, they do not nest significantly more elements than 20 years ago. From this, we can conclude that the size of pages has grown through an increase in the breadth of the DOM tree, i.e. by the fact that each node contains on average more direct children than in the past.
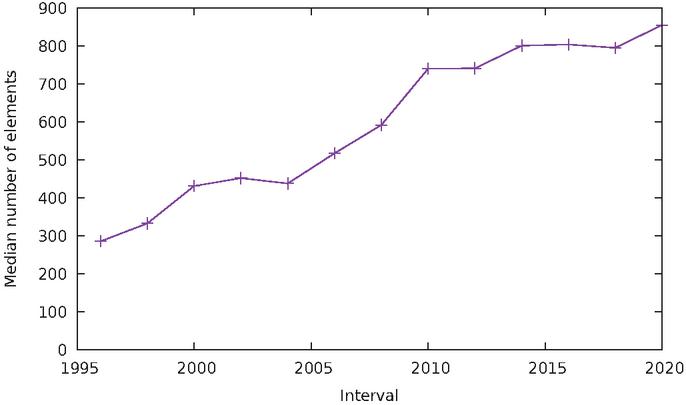
Figure 14 Median size of the DOM tree over time.
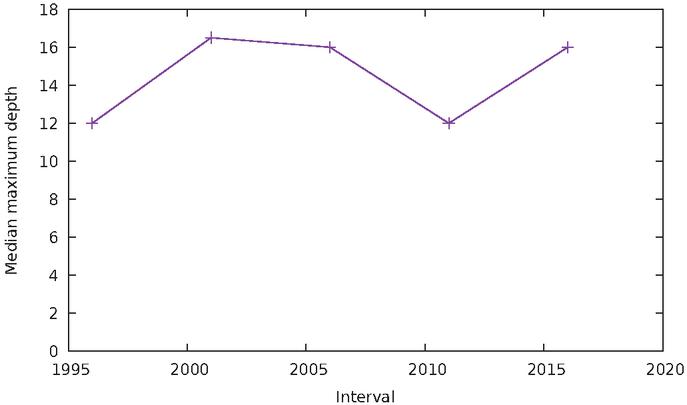
Figure 15 Median depth of the DOM tree over time.
3.2.2 Use of the class attribute
In a similar way as for the contemporary study, we also measured the fraction of sites that make use of the class attribute, as well as the number of distinct classes that appear in the document. First, we can observe that almost no site contained class attributes in the earliest (1996–2000) snapshot. This is not to mean that CSS was not in use to apply visual styling to the page, but rather that elements were referred to using tag names or IDs, and not user-defined classes.
Figure 16 shows a scatterplot similar to Figure 11a, comparing the size of the DOM tree to the number of classes occurring in a document, for two different time windows. One can see that most points lay on a roughly horizontal line in the first case, and show a much more definite increasing trend in the second. This seems to indicate that page size did not seem to have a link with the variety of classes in the past, while it does have one nowadays.
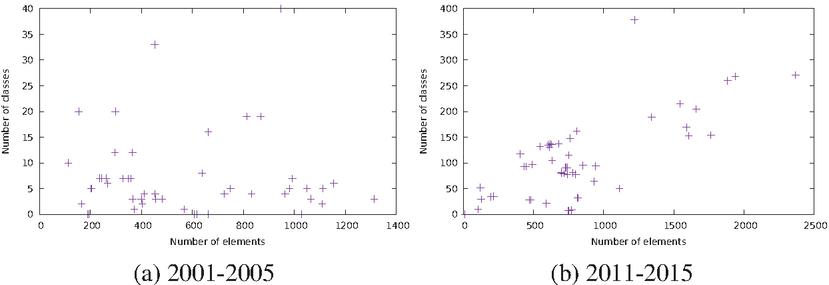
Figure 16 Scatterplot of number of classes vs. number of elements, for two 5-year intervals.
Table 3 gives credence to this visual impression. It shows the correlation coefficient () between DOM size and number of classes, for each 5-year window interval. It can be observed that before 2006, there is no correlation between the number of classes and the size of the DOM tree in a page. However, as soon as the 2006–2010 window is reached, correlation becomes much more manifest, with a value of . We can also note that this correlation becomes stronger over time, and reaches for the latest snapshot.
Table 3 Pearson correlation coefficient () between DOM size and number of classes, for each 5-year window interval
| Years | |
| 2001–2005 | -0.001 |
| 2006–2010 | 0.652 |
| 2011–2015 | 0.734 |
| 2016–2020 | 0.835 |
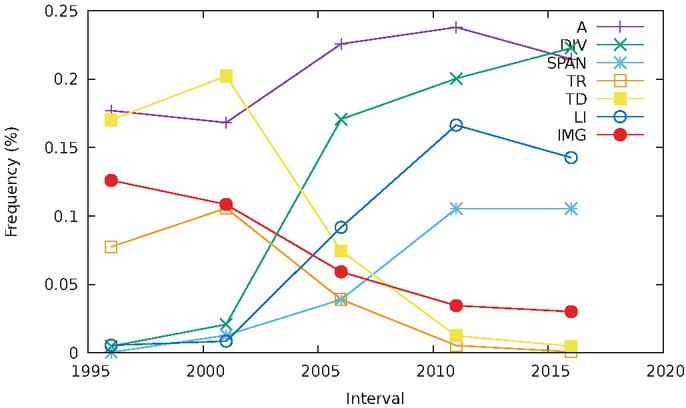
Figure 17 Evolution of tag usage over time.
3.2.3 Tag usage
Figure 17 shows the relative proportion of various tags in
web pages over time. It shows an interesting shift that occurred between the 2001
window and the 2006 window. In 2001, td and tr were very common,
while div and span were almost nonexistent. In the 2006 window, the
situation is reversed: div and span are now much more prevalent than
td and tr.
This is consistent with the fact that early web pages largely used tables as a way
to impose a screen layout. Although it was recognized early on that such a design
technique caused issues (not the least because it used semantic markup for
presentation purposes), no better way of placing elements in a page existed before
the advent of CSS (especially version 2). Table-based layout has then been
replaced by div elements to which positioning and size is stipulated
through CSS declarations. An interesting finding of our study is that this change
in design practices seems to have occurred relatively quickly, with a transition
occurring sometime around the boundary of these two time intervals. From 2006 on,
tables take up an increasingly negligible proportion of pages, probably due to the
fact that they start being only used for their true purpose of formatting tabular
data. The div tag continues to proliferate, albeit at a slower pace: while
its presence jumped from about 2% to almost 20% within 5 years, it only
increased by another 10% in the following 15 years.
Under this hypothesis, one can measure the amount of tagging inserted inside a
page for layout and presentation, by counting all elements that have been used for
that purpose: div and span for modern sites, and table elements
coupled with the font tag for older sites. This produces the plot of Figure
18. It shows a relatively steady, linear increase in the
proportion of pages accounting for layout. Not only has the CSS box model replaced
tables, the global fraction of a page that contains non-semantic markup keeps
increasing at a rate of about 1% per year since 1996. By this graph, one could
make the projection that half of HTML markup in a page will consist of div
and span by 2030.
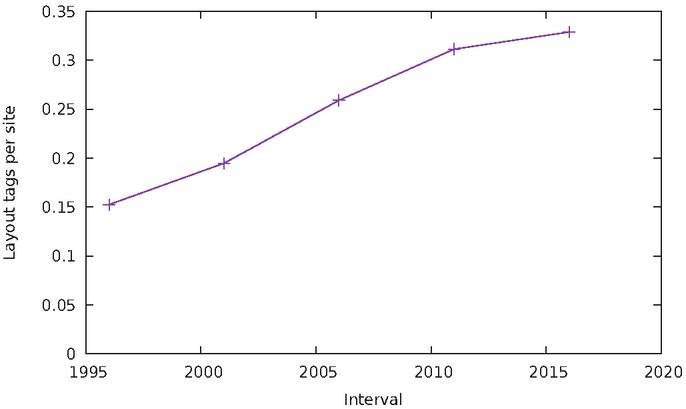
Figure 18 Fraction of layout tags inserted in a page.
Another element that experienced some decrease in popularity is img. Its
proportion has been steadily falling, especially between 1996 and 2011. Two
factors can brought forward to explain this decline. First, Scalable Vector
Graphic support in browsers made it possible to include vector images inside
svg tags, replacing some images that used to be included as bitmaps using
img before. Second, and most importantly, images were widely used in the
past to act as decorations for the user interface (e.g. menu items, bullets or
buttons with graphical elements). Akin to the table-based layout, this was
discouraged on the grounds that it confused semantics and presentation. Following
modern programming practices, such graphical elements can now be specified as CSS
properties of other HTML elements, leaving img to its true function of
including images that are actually part of the text (such as figures).
3.2.4 Adoption of HTML5
Studying tag usage makes it possible, among other things, to witness the adoption of HTML5 over time. A first working draft was published in 2008 [9], and the standard was finalized in 2014 [8]. To this end, we measured the fraction of sites that include at least one of 25 new elements introduced in the latest version of the standard.18
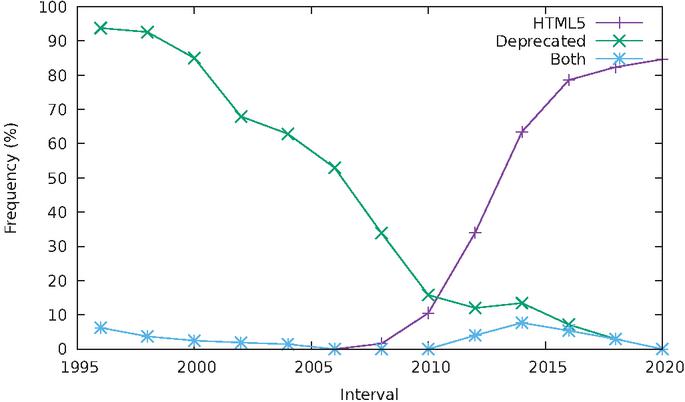
Figure 19 Proportion of sites using HTML5 markup.
The result is shown in Figure 19; exceptionally for this part of the analysis, we used time intervals of two years. One can see that adoption of HTML5 markup started in the 2008–2010 interval, and, following what appears like a logistic curve, increased to reach just over to 80% in 2018–2020. The increase in the fraction of sites using HTML5 tags has markedly slowed down since 2015. If this trend continues, it appears that the proportion of sites that use none of HTML5’s new elements will stabilize between 10% and 15% for some time in the future.
The spurious non-zero points at the left of the graph deserve an explanation. Upon closer examination of the data, we discovered that they are all explained by the presence of a handful of sites using a tag called wbr, well ahead of its official introduction in HTML5. This is all the more surprising that earliest reported browser support for this tag, according to references such as W3Schools19 corresponds to versions from 2008. This is the only tag whose presence predates the publication of the standard.
The second line in the plot of Figure 19 shows the fraction of sites using tags that have been deprecated in HTML5.20 In the first sets of snapshots, almost all sites use some of these tags, but this fraction had already dropped to less than a quarter around the time of HTML5 first draft publication. More interestingly, the last line in the plot shows the fraction of sites using both tags introduced in HTML5, and tags deprecated in HTML5 – resulting in an invalid document by any standard one wishes to look at. After a short spike a few years ago, this fraction is now back to zero. However, this reveals that the switch to HTML5 has resulted in a transitional period where “hybrid” markup has been in use, albeit marginally.
3.2.5 Prevalence of JavaScript
What can be done for HTML5 can also be done for the adoption of JavaScript, by
counting sites containing at least one script tag. We remind the reader
that is element is used, regardless of whether JavaScript is included directly
inside the page, or executed from an external resource. Therefore, it can be used
as a reliable indicator of whether a page uses scripting or not.
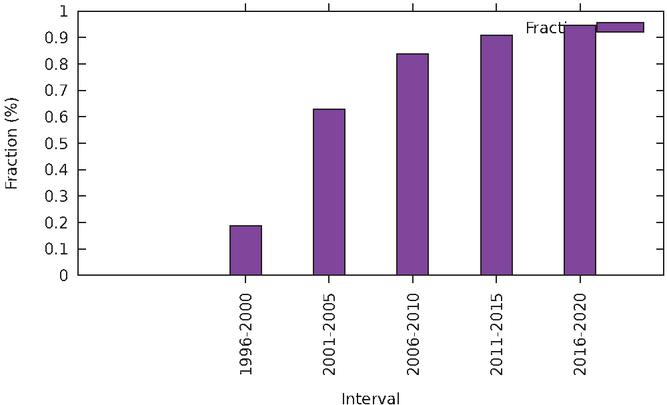
Figure 20 Proportion of sites having script and embed tags.
The results are plotted in Figure 20. Surprisingly, the number of
websites containing script tags has increased from 10% to almost 100%,
with the largest increase between the first and second snapshots.
This, however, does not indicate how much JavaScript code is included inside
pages. Our harvesting script is not equipped to analyze inline and external script
files. However, an indirect measure of the amount of code included in the page can
be obtained by counting script tags inside a page; this is shown in Figure
21. Again, a clear increasing trend can be observed, with the number
of script tags increasing at an average rate of roughly one per year. Therefore,
one can conclude that more sites use JavaScript than before, and sites seem to use
more JavaScript over time.
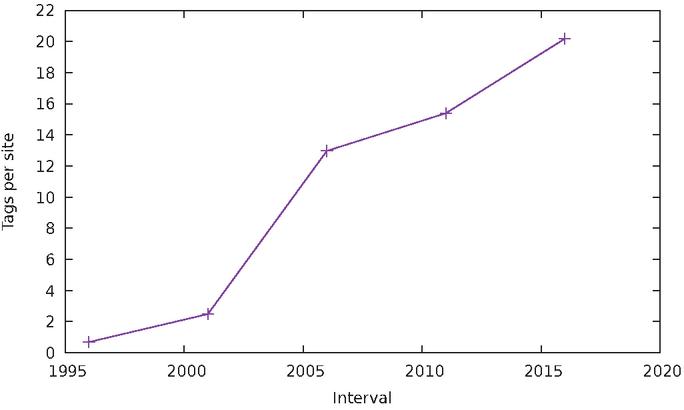
Figure 21 Average number of script tags per page.
3.2.6 Invisible Elements
While perusing the various statistics generated by our harvesting scripts, one of them caught our attention in an unsuspected way. Figure 22 shows the evolution of the use of invisibility, similar to the statistics presented in Section 2.2.2. One can see how the prevalence of negative positioning, which we had observed in contemporary websites, is relatively recent. In the early snapshots, the majority of elements were invisible because they were given very large – coordinates (the outside data series in the plot). Negatively-positioned elements have then started gaining prominence, to the point where both modes of invisibility end up mostly nose-to-nose in the last snapshot.
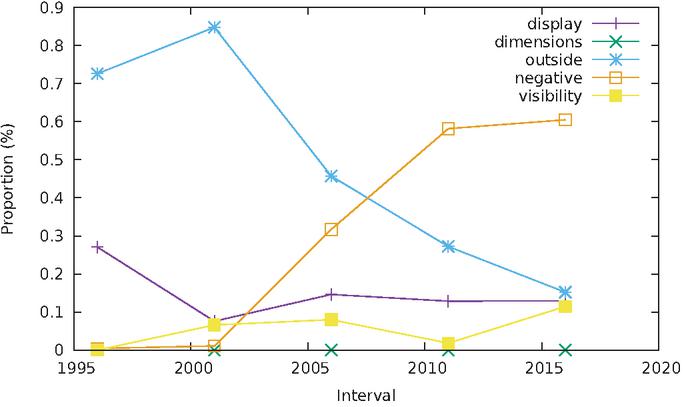
Figure 22 Evolution of invisibility over time.
This snapshot should be compared with the results for the 700 web pages from the 2019–2020 contemporary study (Table 10), which shows an even greater proportion of negatively-positioned elements.
4 Threats to Validity
We identify in the following a few of the factors that may influence the validity of the reported results, both for the contemporary study (Section 2) and the longitudinal study (Section 3).
4.1 Website Sample
All the distributions and statistics computed in this study obviously depend on the sample of websites used for the analysis. Different results could be obtained by using different selection criteria. In the contemporary study, we tried to alleviate this issue by including in our sample a good fraction of sites selected using an objective and external criterion (the Moz top-500 list, which ranks sites according to their traffic). However, we also balanced this selection by including lesser known sites suggested by people based on their daily usage of the web. Finally, the relatively large size of our study (708) lessens the odds that our selection fortuitously picked only outliers in terms of size or structure.
The longitudinal study uses a smaller sample, both due to long extraction times and the fact that sites in the Wayback Machine must be obtained by providing an explicit URL. In other words, there is no way to obtain a list of the sites for which a snapshot is available, which makes it increasingly hard to find sites as we go back in time. As we already mentioned, we attempted to mitigate this issue by grouping sites into pools of 5 or 2 years, depending on the metric. However, our selection of sites is such that each pool does not necessarily contain the same set of sites (and most often does not), for reasons that have been explained in Section 3.1.1. Therefore, the results we present should be taken as samples of available pages for each time period; this is why only aggregated metrics (average or median) on each sample are being compared. Nevertheless, most of the results we obtain are taken from samples containing at least 60 pages, and show clear trends that seem to indicate that these samples are large enough to be representative.
4.2 Variance Due to Browser
A single browser was used in our study, namely Mozilla Firefox. Since there sometimes exists a discrepancy between the pages rendered by different browsers, the actual DOM trees obtained could differ when using a different browser. However, this is mitigated by the fact that standards compliance in browsers has greatly improved over the past years, with all major browsers now scoring a perfect 100 in the Acid3 tests [15]. However, most compliance violations affect the way elements are graphically rendered on the page, but not the actual contents of the DOM tree from which the page is rendered; hence these discrepancies do not affect the statistics we measure in our study. It shall also be noted that our use of Firefox has been made out of commodity: nothing technically prevents the same scripts from running in other browsers, thanks to TamperMonkey’s wide support.
Browser variance may also have an additional impact on the longitudinal study, as pages from more than two decades are being processed through a contemporary web browser. Indeed, default font size and presentation rules for elements (margins and padding) have varied over the years. However, the same argument as before applies here: these rendering differences have no effect on the actual HTML markup.
4.3 Influence of the Wayback Machine
Also worthy of mention, in the case of the longitudinal study, is the impact of viewing archived copies of websites through the Wayback Machine. As we have discussed in Section 3.1.2, the machine does not provide an exact replica of the archived pages. However, most of the modifications made to the page either have no effect on the display (e.g. changing the path of external resources to point to files from within the archive), or are easily reversible (e.g. removing the menu overlaid on top of the screen).
However, it has been reported that snapshots from the machine may be composed of
pieces harvested at different points in time, and hence that the pages that are
displayed do not represent the way the page looked at any given moment
[2]. This mostly affects the exact content of the
page; it is relatively unlikely that such “composite” snapshots be meaningfully
different in terms of DOM tree structure. (For example, a site that does not use
div elements will still have no more divs if composed from pieces
from different, but close moments in time.) The Machine is also subject to
security breaches allowing one to tamper with archived snapshots
[12]. Our study is obviously vulnerable to this issue,
as there is no way to discover that snapshots have been tampered with.
Nevertheless, we deem this eventuality very unlikely.
4.4 Homepage Analysis
For all the sites considered, only the homepage has been analyzed. This is deliberate, so that the same methodology could be applied uniformly to all the sites in our study. Although many websites allow users to access to a different section after logging in, most of them have a relatively complete and usable homepage. There are, however, some exceptions; the most notable is Facebook, which shows nothing but a login form to non-authenticated visitors. This has repercussions on the reported page size and structure.
To minimize the impact of this phenomenon, it could be possible to choose a different page in each website, in order to pick one that is representative –for example, one of the pages shown to the user after logging in. This, however, would introduce considerable complexity: valid credentials would need to be provided for all these sites, and specific instructions on how to reach the desired page (automatically) would have to be defined. More importantly, the choice of the “representative” page would introduce an additional arbitrary element that could in itself be a threat to validity.
5 Conclusion
In this paper, we have presented various statistics about the structural content of web pages for a sample of 708 websites, which includes the 500 most visited sites according to Moz [1]. Our analysis has revealed a number of interesting properties of websites in the wild. For example: the distribution according to their size closely follows an inverse exponential; most pages have fewer than 2000 nodes and a tree depth less than 22; more than half of all elements are hidden, and the majority of them are concealed by setting them to a negative position; most websites have CSS classes containing on average 10 elements or fewer.
The second part of our analysis studied the evolution of various structural metrics over a span of 25 years, by leveraging archived snapshots of websites hosted by the Internet Archive. Our analysis of more than 100 sites over that period enabled us to identify a few interesting – and sometimes surprising – trends. For example, the fraction of elements devoted to layout and presentation has steadily increased by about 1% per year, and could be expected to account for the majority of the markup in a near future; the DOM tree of a web page has grown in total size, but not in depth; and the amount of JavaScript in a page is constantly increasing. Combined, these observations indicate that HTML pages slowly but assuredly evolve from the textual documents adorned with a few layout and programmatic elements they used to be, to become in essence heavy programmatic containers for a small amount of textual data.
It is hoped that these findings, and many more included in our online experimental package, can be used as a reference point for future research works on website analysis. They can help situate a particular benchmark or sample used in an empirical study, with respect to a larger population of websites “in the wild”. As future work, we plan to expand the amount of data collected on each page, and intend to periodically rerun this study in order to witness any long-term trends over the structure of websites, in a way similar to the retrospective longitudinal study that was accomplished in Section 3.
The study of the results compiled in this paper has led the authors to formulate a number of additional research questions that could be the focus of further empirical studies on websites. First, one shall remark that our survey has limited itself to HTML tags and their attributes, and almost completely discarded CSS and rendering properties. A subsequent study focusing on the use of CSS, and its evolution over time, could shed further light on how this technology is used in combination with HTML to create the pages that form the web. As additional future work, one could consider tracking not only the aggregated evolution of HTML/CSS/JS usage across all sampled websites, but also the evolution of individual websites and observe whether similar change patterns occur across multiple websites.
Notes
2DOI: 10.5281/zenodo.3718598
5This also includes any pop-ups triggered by the loading of the main page, such as advertisements. Section 2.1.3 explains how these additional windows have been filtered out from the analysis.
18The list of structural tags found at https://www.htmlgoodies.com/tutorials/html5/new-tags-in-html5.html, plus the audio and video elements.
19https://www.w3schools.com/TAgs/tag_wbr.asp
20https://www.tutorialspoint.com/html5/html5_deprecated_tags.htm
References
[1] The Moz top 500 websites. https://moz.com/top500, Accessed October 20th, 2019.
[2] S. G. Ainsworth, M. L. Nelson, and H. V. de Sompel. Only one out of five archived web pages existed as presented. In Y. Yesilada, R. Farzan, and G. Houben, editors, Proceedings of the 26th ACM Conference on Hypertext & Social Media, HT 2015, Guzelyurt, TRNC, Cyprus, September 1-4, 2015, pages 257–266. ACM, 2015.
[3] X. Chamberland-Thibeault and S. Hallé. Structural profiling of web sites in the wild. In M. Bieliková, T. Mikkonen, and C. Pautasso, editors, Web Engineering - 20th International Conference, ICWE 2020, Helsinki, Finland, June 9-12, 2020, Proceedings, volume 12128 of Lecture Notes in Computer Science, pages 27–34. Springer, 2020.
[4] X. Chamberland-Thibeault and S. Hallé. Longitudinal study of website structure (LabPal instance). DOI: 10.5281/zenodo.4752419.
[5] S. R. Choudhary, M. R. Prasad, and A. Orso. X-PERT: accurate identification of cross-browser issues in web applications. In D. Notkin, B. H. C. Cheng, and K. Pohl, editors, Proc. ICSE 2013, pages 702–711. IEEE Computer Society, 2013.
[6] S. Hallé, N. Bergeron, F. Guerin, G. L. Breton, and O. Beroual. Declarative layout constraints for testing web applications. J. Log. Algebr. Meth. Program., 85(5):737–758, 2016.
[7] S. Hallé, R. Khoury, and M. Awesso. Streamlining the inclusion of computer experiments in a research paper. IEEE Computer, 51(11):78–89, 2018.
[8] I. Hickson, R. Berjon, S. Faulkner, T. Leithead, E. D. Navara, and T. O. S. Pfeiffer. HTML 5: A vocabulary and associated APIs for HTML and XHTML (recommendation). Technical report, World Wide Web Consortium, 2014. http://www.w3.org/TR/2014/REC-html5-20141028/.
[9] I. Hickson and D. Hyatt. HTML 5: A vocabulary and associated APIs for HTML and XHTML (working draft). Technical report, World Wide Web Consortium, 2008. http://www.w3.org/TR/2008/WD-html5-20080122/.
[10] B. A. Howell. Proving web history: How to use the Internet archive. Journal of Internet Law, 9(8):3–9, 2006.
[11] J. L. Q. III and R. A. Crudo. Using the Wayback Machine in patent litigation. Landslide Magazine, 6(3), 2014.
[12] A. Lerner, T. Kohno, and F. Roesner. Rewriting history: Changing the archived web from the present. In B. M. Thuraisingham, D. Evans, T. Malkin, and D. Xu, editors, Proceedings of the 2017 ACM SIGSAC Conference on Computer and Communications Security, CCS 2017, Dallas, TX, USA, October 30 - November 03, 2017, pages 1741–1755. ACM, 2017.
[13] S. Mahajan, A. Alameer, P. McMinn, and W. G. J. Halfond. Automated repair of layout cross browser issues using search-based techniques. In Proc. ISSTA 2017, pages 249–260, 2017.
[14] N. Nikiforakis, L. Invernizzi, A. Kapravelos, S. Van Acker, W. Joosen, C. Kruegel, F. Piessens, and G. Vigna. You are what you include: large-scale evaluation of remote JavaScript inclusions. In T. Yu, G. Danezis, and V. D. Gligor, editors, the ACM Conference on Computer and Communications Security, CCS’12, Raleigh, NC, USA, October 16-18, 2012, pages 736–747. ACM, 2012.
[15] D. Perry. Acid3 test simplified; all modern browsers score 100, 2011. https://www.tomsguide.com/us/acid3-browser-test-web-standard-compatibility-IE9,news-12583.html, Retrieved January 14th, 2020.
[16] T. A. Walsh, P. McMinn, and G. M. Kapfhammer. Automatic detection of potential layout faults following changes to responsive web pages (N). In M. B. Cohen, L. Grunske, and M. Whalen, editors, Proc. ASE 2015, pages 709–714. IEEE Computer Society, 2015.
Biographies

Xavier Chamberland-Thibeault is an M.Sc. candidate at Université du Québec à Chicoutimi, Canada, and a lecturer of Computer Science at Cégep de Jonquière, Canada. In parallel to his work on web site profiling, Xavier has been involved in the development of auto-repair features in Cornipickle, a declarative website testing tool. His work has been published at the International Conference on Web Engineering in 2020 and 2021.

Sylvain Hallé is the Canada Research Chair in Software Specification, Testing and Verification and a Full Professor of Computer Science at Université du Québec à Chicoutimi, Canada. He started working at UQAC in 2010, after completing a PhD from Université du Québec à Montréal and working as a postdoctoral research at University of California Santa Barbara. He is the lead developer of the Cornipickle declarative web testing tool, and the author of more than 100 scientific publications. Pr. Hallé has earned several best paper awards for his work on the application of formal methods to various types of software systems.
Journal of Web Engineering, Vol. 20_4, 971–1002.
doi: 10.13052/jwe1540-9589.2044
© 2021 River Publishers