A High Autonomous Sea Front Detection Algorithm Based on SAR Data
Su-qin Xu1, †, Hao Jiang1, 2, *, †, Ting-ting Li1, Li-ming Yuan1, 2, Lu Yu1, Jie Chen1, Biao Chen1 and Bao-qiang Zhang1, 2
1Navy Submarine Academy, Qingdao 266199, China
2CSSC Ocean Exploration Technology Institute Co., Ltd, Wuxi 214028, China
E-mail: jhao_ocean@163.com
*Corresponding Author
†These two authors contributed equally to this work
Received 13 November 2020; Accepted 16 December 2020; Publication 09 March 2021
Abstract
This paper has proposed a high autonomous sea front detection algorithm based on SAR data. Through the innovative introduction of empirical mode decomposition method, a good image de-trend and de-stripe effect is achieved. By introducing the calculation of the maximum interclass variance, the automatic conversion of binary images is realized; through the use of polynomial fitting method, the independent screening of front information is realized, and the continuity of front detection results is improved. After comparison, it is found that the new algorithm proposed in this paper has greatly improved detection accuracy and autonomy compared with the old algorithm. Finally, a SAR data of the GF-3 satellite on the west side of Taiwan Island is used to test the new algorithm proposed in this paper. The results show that the detection results are highly consistent with the original image in morphology, and the changes in frontal intensity are also very detailed, verifying the accuracy and autonomy of the new method.
Keywords: Sea front, SAR, high autonomy, graphic detection.
1 Introduction
Ocean front is an important sub-mesoscale phenomenon. It is a narrow transition zone between two or several water bodies with different characteristics. There are strong horizontal convergence/divergence and vertical movement nearby, in which there is a gradual degeneration process and various scales of bending. It has important research value in marine resource development and military [1–4].
With the development of remote sensing technology, people have been able to conduct large-scale observations of the ocean. As a result, many ocean front automatic detection algorithms based on remote sensing fusion data products have been developed [5–7]. One of the more common ones is the gradient detection algorithm, and operators such as Canny, Sobel, Prewitt, and Roberts are commonly used to extract the ocean front boundary [8–10]. In recent years, due to its high observation resolution, all-weather, all-weather work, and synchronous, large-scale real-time acquisition of observation data [11–13], synthetic aperture radar (Synthetic Aperture Radar, SAR) is widely used in the study of small and medium-scale ocean phenomena [14–17].
Among them, Li Tingting et al. [18] started from the perspective of image processing and studied the ocean front detection method based on SAR data, and achieved good detection results. This article conducted an in-depth study on the method and found the following problems: (1) The detection process is highly subjective. Multiple links in the detection process have not formed a judgment standard, and the threshold setting may vary from person to person, resulting in unstable detection results, detection methods difficult to be fixed, and weak universality and popularization. (2) The detection effect needs to be further improved. It is mainly reflected in two aspects. One is that the detection results are not in good agreement with the real front in the image, and the other is the lack of ability to characterize the changes in the width of the ocean front, which makes the front details not prominent and cannot effectively reflect the local strength changes of the front. (3) No effective interference information removal method is proposed, and the interference information in the edge detection results cannot be removed from the algorithm level. (4) The frontal continuity problem cannot be solved well.
In view of the above problems, this paper further studies the ocean front detection method based on SAR image data. By introducing methods such as empirical mode decomposition, maximum interclass variance calculation, graph roundness calculation, polynomial fitting, etc., and based on the original algorithm, a new efficient and highly autonomous ocean front detection method is proposed. Through comparative analysis, the new method overcomes the above-mentioned shortcomings in the old method and broadens the thinking for the extraction of ocean front information.
2 Method Principle
2.1 Imaging Principles of Ocean Front in SAR Images
SAR is an active microwave imaging sensor that can receive the backscattered signal of the observation object, and form a distribution image of the backscattering coefficient in the observation range by analyzing the amplitude and time phase of the signal. The sea surface mainly affects the backscattering coefficient through its roughness, which causes the gray value in the SAR image to change. At the place where the seawater converges, the roughness of the sea surface is large, and the backscattering coefficient is high. The gray value of the corresponding position in the SAR image is high, and the image appears bright, otherwise it is dark. Due to the strong convergence/divergence and vertical movement of the sea near the ocean front, the roughness of the sea surface is changed, which affects the backscattering coefficient, which is finally reflected in the SAR image as a bright or dark streak.
2.2 Main Algorithm
2.2.1 Empirical mode decomposition
Unprocessed SAR images often have light and dark stripes, and their gray values often have an overall trend in a certain direction. These phenomena make the local and overall thresholds in edge detection unable to be effectively unified, resulting in missed and false detections of the boundary. To solve this problem, we introduced the Empirical Mode Decomposition (EMD) algorithm. The algorithm is a signal decomposition method based entirely on the data itself [19]. The data can be decomposed into a series of Intrinsic Mode Function (IMF) and a residual term (R), the process is as follows:
(a) Find all extreme values of ;
(b) Use the cubic spline fitting method to connect these maximum and minimum values to obtain the upper and lower envelopes of , and find the mean curve between the upper and lower envelopes ;
(c) Subtract from to get a new time series ;
(d) Repeat the above operations (a) to (c) for the new time series until the following condition is met,
| (1) |
Where is the number of repetitions of operations (a) to (c), and are the mean envelope and time series obtained after the operations are repeated times.
| (2) |
Let , is the first natural mode decomposed from .
Remove from to get and repeat the above operations (a) to (d) for until is monotonic
| (3) |
Let , and is the changing trend of in the time period. Thus, the result of EMD decomposition of a time signal S can be expressed as:
| (4) |
Where, represent the amount of pulsation with different time scales in the signal S (the larger the time scale, the stronger the periodicity), and R represents the change trend of S.
We decompose the gray value data of each row (column) by EMD one by one, and remove the trend item and the first two items with the largest scale, which well removes the changing trend of the image and the periodic light and dark stripes, and effectively improves the accuracy of edge detection.
2.2.2 Calculation of maximum interclass variance
When detecting ocean fronts, in order to facilitate subsequent edge detection, the image needs to be converted into a binary image. In the old method, the threshold for converting an image to a binary image is manually selected. It is necessary to repeatedly observe and compare the converted binary image effect according to the human eye, and finally determine the threshold. Obviously, this process is extremely dependent on the experience of the operator. Different people are likely to set different conversion thresholds when performing this step. Even the same person may set different thresholds at different time periods, influencing the image conversion effect. Furthermore, the binary conversion is the initial step of the entire detection algorithm, and its effect is very obvious on the entire detection process, and ultimately affects the detection effect of the front.
In order to avoid the above problems, this paper introduces the maximum between-class variance method for binary conversion. The maximum interclass variance method (OTSU) is a global-based binarization algorithm that can adaptively divide the image into two parts: foreground and background [20]. The calculation is as follows:
Let be the segmentation threshold between foreground and background, the ratio of foreground pixels to the total number of pixels is , the average gray value of foreground pixels is , the ratio of background pixels to the total number of pixels is , and the average gray value of background pixels is , the average gray value of all pixels in the image can be expressed as:
| (5) |
The interclass variance between the foreground and the background is as follows:
| (6) |
Then can finally be expressed as:
| (7) |
Where .
When the variance reaches the maximum, the difference between the foreground and the background is considered to the maximum, and the segmentation threshold at this time is the optimal threshold for binary conversion. This method solves the problem of segmentation threshold value during the conversion of image binary image, thereby avoiding the interference of artificial factors, reducing the influence of subjective factors, and improving the autonomy of the algorithm.
2.2.3 Graphic screening based on polynomial fitting
In the front detection, we found that no matter what pretreatment method is used, the detected front line will inevitably break. There are two main reasons for this phenomenon: First, due to the weak signal in some areas of the front line, the detection is missing. Secondly, the front line itself is indeed discontinuous in the observation data due to some reason. However, judging from the human eye, these broken lines have the strong positional logical relationship, and it is easy to judge from the form that they belong to the same front. For this situation, we introduced a polynomial fitting algorithm to judge whether the detection results belong to the same front, and connect the structures belonging to the same front to solve the problem of continuity of the detection results. The operation process is as follows:
(a) Perform curve fitting on the coordinates of all pixels of the suspected front signal. Among them, according to the results of multiple experiments, we found that linear Fourier fitting is better;
(b) Keep the test results that are crossed by the fitted curve and close enough to the fitted curve (the distance between polygon centroid and fitting curve is small enough), and according to their spatial relationship, find the nearest 10% points between the adjacent test results, and connect these points to complete the front connection works.
2.3 Front Detection Process
The ocean front detection algorithm in this article is developed based on MATLAB, and its specific operating procedures include (As shown in Figure 1):
(1) SAR image preprocessing, including detection range selection, image rotation, etc.;
This algorithm has certain requirements for the detection image. It requires that there is one and only one front body in the image, otherwise it will cause inaccurate polynomial fitting and cause misjudgment of the front signal.
(2) Remove trends and stripes with EMD algorithm;
In the process of SAR observation, With the increase of incident angle, there will be a change trend of SAR image brightness. The purpose of removing trend is to solve this problem. And in the results of EMD, the large-scale term represents the regular signal in the data, the small-scale term represents the detail signal in the data, and the light and dark stripes have strong periodicity, which correspond to the large-scale terms in the decomposition results of the data. After a lot of experiments, we find that removing the first two items with larger scale can effectively remove the fringe phenomenon in SAR image.
(3) Convert the image to a binary graph using the maximum interclass variance method.
At this time, the SAR image is converted into a black and white image with only two values of 0 and 1;
(4) Remove polygons with smaller area in the image;
After the conversion, we found that there are many isolated graphics with a small area (less than 8 pixels) in the image, most of which are the original noise in the SAR image, which should be removed first;
(5) Image closing operation;
Use the diamond structure element to expand the image first and then perform the corrosion operation, the purpose is to merge the small area polygons that are closer in the image;
(6) Graphic roundness screening
During the operation, we found that most of the frontal signals will show slender features. In order to further remove noise signals, we conduct roundness inspections on all detected polygons and remove polygons with higher roundness, in this paper roundness R is defined as
Where S is the area of the polygon and L is the perimeter of the polygon. The closer the polygon is to the circle, the closer the value of R is to 1;
(7) Graphic edge extraction and centroid calculation;
(8) Curve fitting
Curve fitting is performed on the positions of all pixels suspected to be frontal signals. In this paper, a linear Fourier fitting is used. In actual operation, other fitting methods can also be used;
(9) Confirmation of frontal signal
We use two rules to determine whether the image signal is a frontal signal. First, we consider the polygon that is crossed by the fitted curve as the front. Secondly, we consider the figure whose centroid is close enough to the fitted curve as the front signal. In this study, we use the amplitude of a linear Fourier fitting curve as the threshold distance. Polygons whose distance is less than the threshold are regarded as frontal signals;
(10) Graphical connection
After selecting the front signal, calculate the distance between adjacent polygons, select the 10% point with the smallest distance between the two polygons, and connect them;
(11) Extract frontal bones and boundaries.
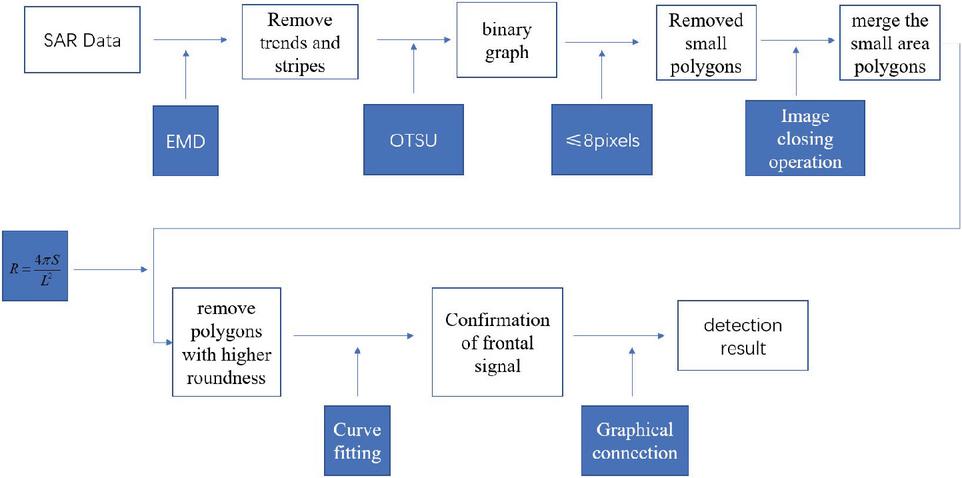
Figure 1 Process flow chart.
3 Test and Analysis
3.1 Test Data
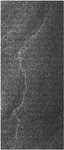
In order to compare with the method in Li Tingting et al. [18], this paper selects the same Level1B product data of the ENVIST satellite A SAR for front extraction. The SAR image was taken on June 7, 2009. The image area is pixels, and the image resolution is 7.8 m 4.06 m. As shown in Figure 2, the front surface is shown as a bright stripe.
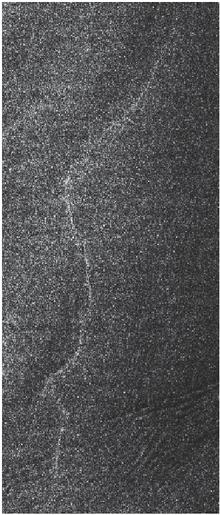
Figure 2 The original SAR image of eastern Hainan Island on June 7, 2009.
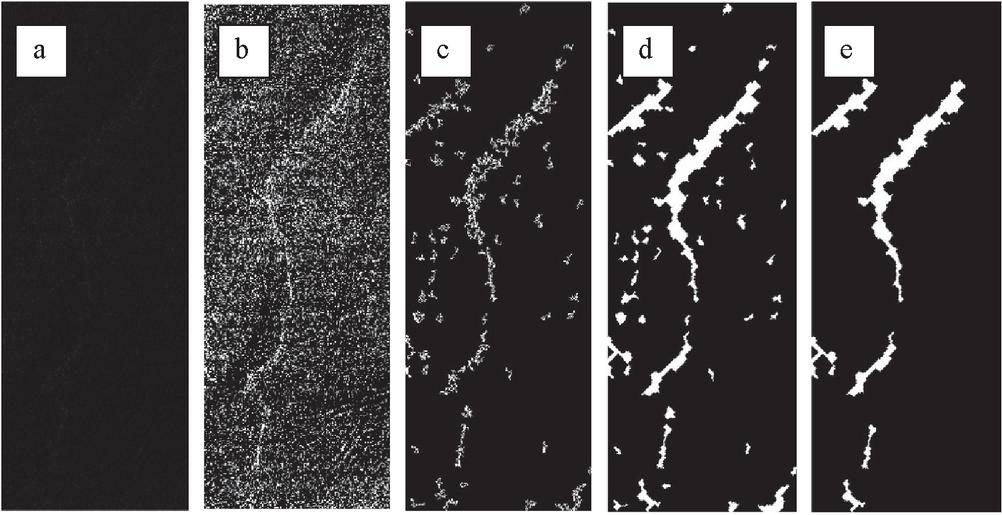
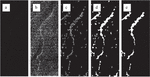
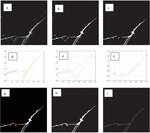
Figure 3 The intermediate process of image processing (from left to right are the results after EMD removal of background, binary conversion, figure area filtering, closed operation, and roundness filtering).
Figure 3 shows the image processing process. Among them, Figure 3a is the image after the original image is decomposed by EMD (At this time, the value of the image data is small, so the picture is dark); Figure 3b is the image converted into a binary image using the maximum interclass variance method. It can be clearly found that the gray value distribution of the image is more uniform than that of the original image and the horizontal stripes of light and dark in the original picture have also been greatly improved; Figure 3c shows the effect after removing the smaller polygons; Figure 3d shows the effect after the closing operation; Figure 3e shows the effect of roundness screening, after removing polygons that are too round.
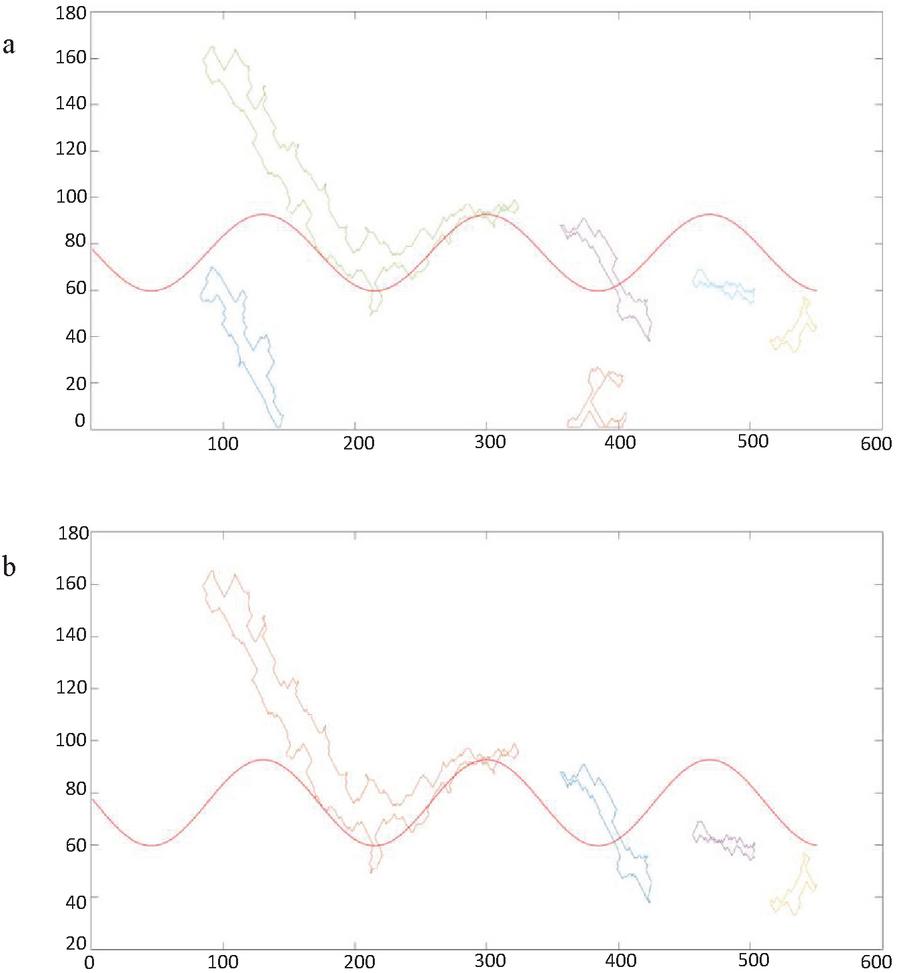
Figure 4 Front signal selection using curve fitting.
After the above operation, we extracted the boundaries of all polygons, and performed a linear Fourier fitting on all suspected frontal signals, as shown in Figure 4a. According to the selecting method proposed in this article, the polygons that are crossed by the fitted curve and within two amplitudes of the fitted curve are retained, as shown in Figure 4b. These are all frontal signals.
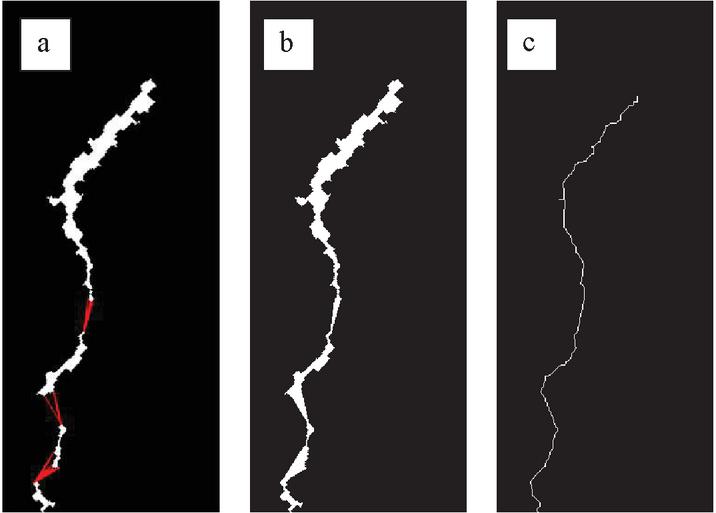
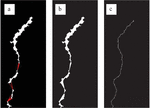
Figure 5 Front connection and skeleton extraction.
Calculate the distance between the polygons, select close enough points on the adjacent graphics, and connect them. The connection effect is shown in Figure 5a, where the red line is the connection line. Then fill in the gaps, and the effect is shown in Figure 5b. This image is the final ocean front detection result; Figure 5c shows the corresponding graphic skeleton.
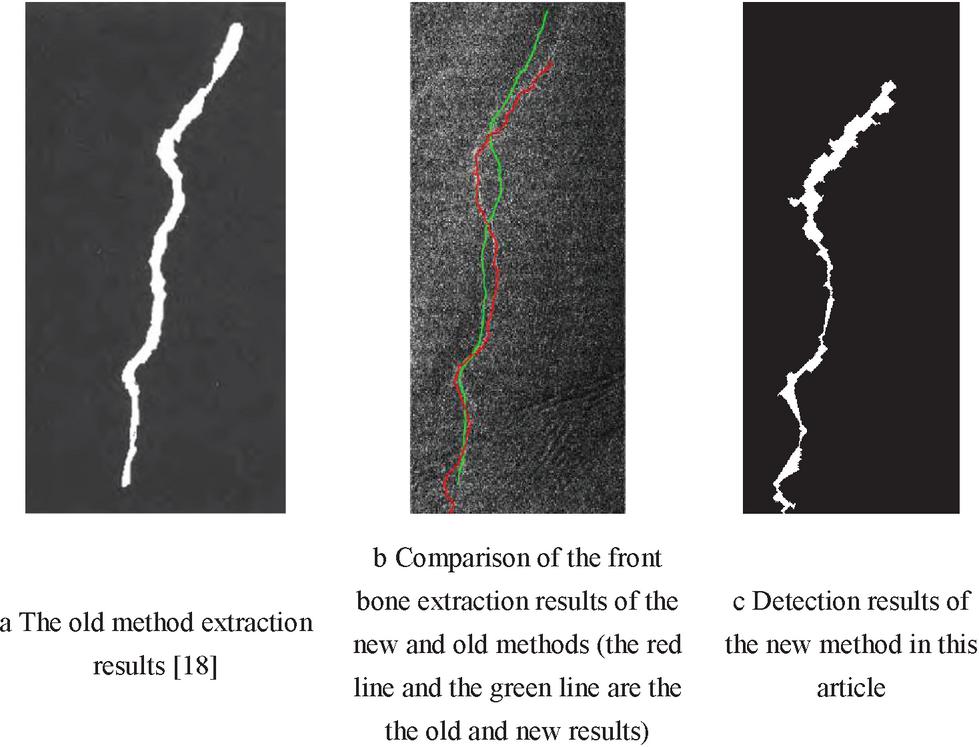
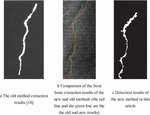
Figure 6 Comparison of ocean front detection results of the new and old methods.
Figures 6a and 6c show the ocean front extracted by Li Tingting et al. [18] and the ocean front extracted in this paper, respectively. Figure 6b shows the position of the frontal skeleton in the original image, where the red line is extracted by the old method, and the green line is extracted by the new method. In contrast, the performance of the new method is significantly better than the old method, which is mainly reflected in the following two aspects:
(1) Significant improvement in frontal morphology: From the morphological point of view, the frontal bone extracted by the new method almost completely overlaps the frontal surface in the original image, while the bone extracted by the old method has a large deviation;
(2) The change of frontal width is more detailed: we found that the frontal width extracted by the new method has obvious differences in different parts. It appears thick where the frontal phenomenon is strong, and looks thinner where the frontal phenomenon is weak. Through human eye comparison, these changes correspond well to the frontal changes in the original image. In contrast, the front extracted in the old method has almost no change in its width from top to bottom, which obviously does not reflect the local strength changes on the front.
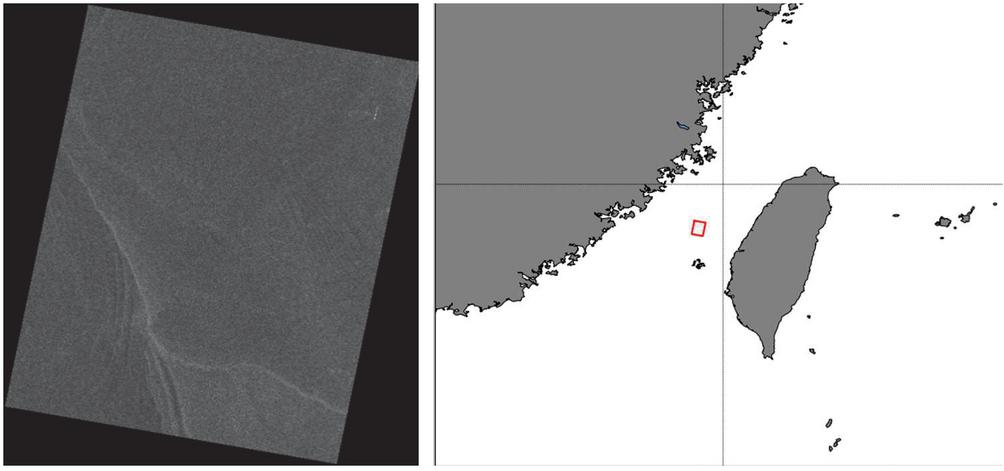
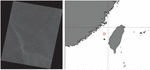
Figure 7 SAR image data and observation location.
3.2 Method Verification
This paper selects the SAR data of the GF-3 satellite in the west side of Taiwan Island on July 27, 2017 to verify the algorithm. The data is the full polarization strip 1 (QPSI) imaging mode, the standard resolution is 8 m and the width is 30 km, with full polarization (HH/HV/VH/VV) imaging. The center latitude and longitude are 24.2N, 119.6E. The image width is 5530 and the height is 5265, and the width and height resolution are 2.2484 m and 5.0407 m (Figure 7).
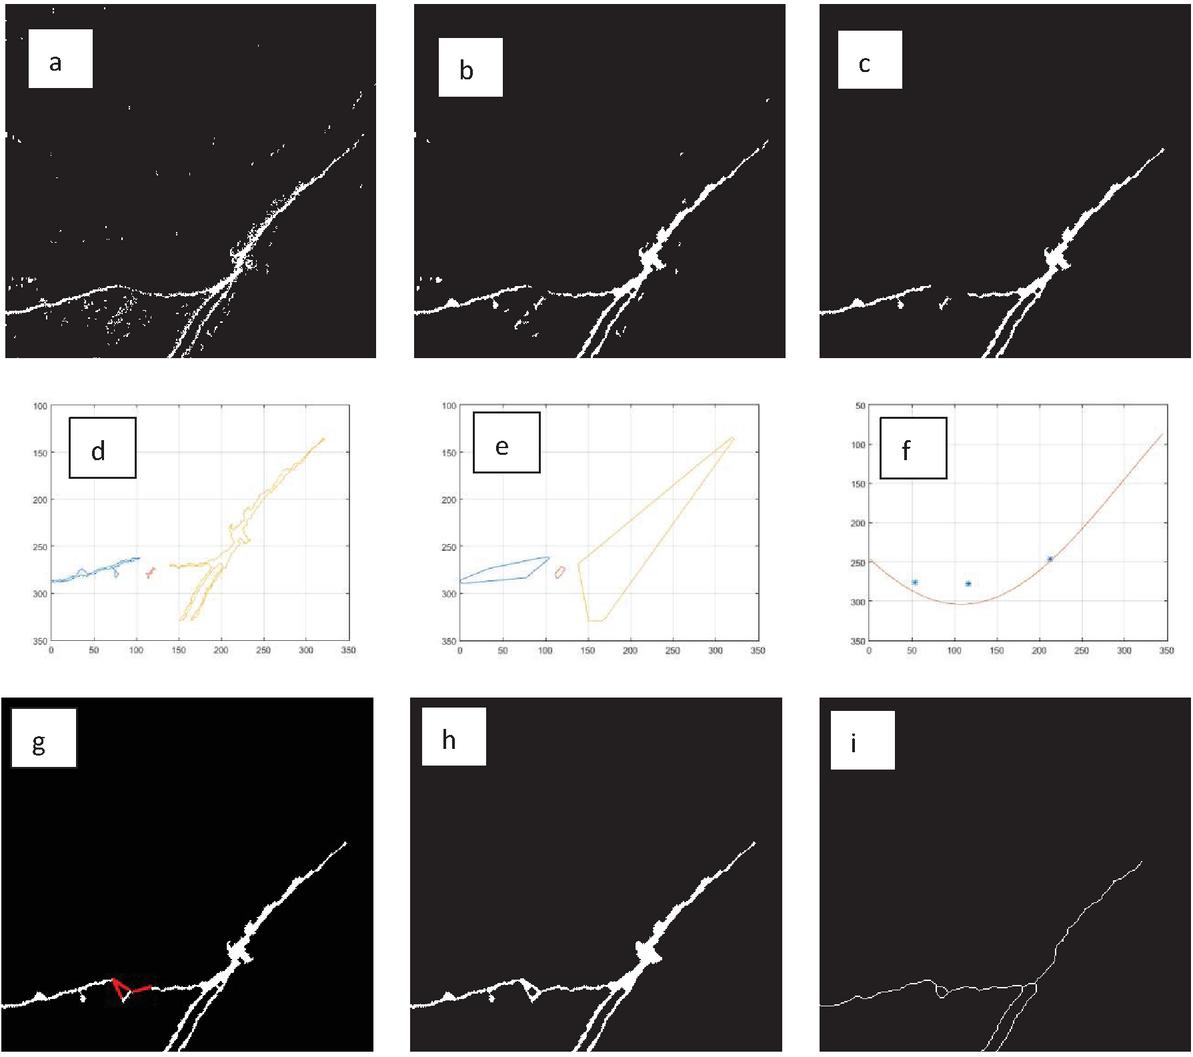
Figure 8 Image stitching and skeleton extraction process.
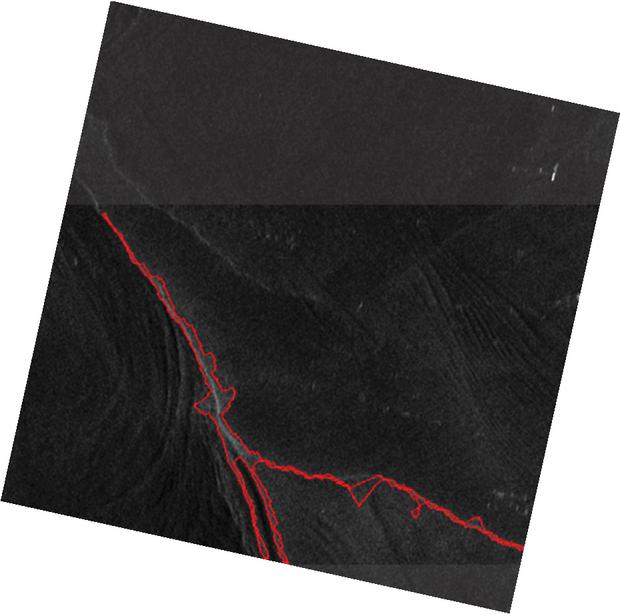
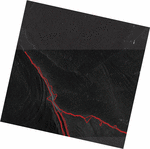
Figure 9 Results of ocean front detection.
Figure 8 shows the key steps when using the data for algorithm verification. Figures 8a to 8i are: (a) binary graph conversion, (b) closing operation, (c) roundness filtering, (d) boundary extraction, (e) calculation of the largest external polygon, (f) curve fitting, (g) image connection, (h) front extraction result, (i) front bone.
Figure 9 shows the result of front extraction, and the red line is the ocean front boundary. It can be seen that the extracted front morphology and the front on the original image are very consistent, and the width of the front changes well with the intensity of the phenomenon, and the front extraction effect is excellent. It demonstrates that the ocean front extraction algorithm proposed in this article has good universality.
4 Conclusion
Based on the research of Li Tingting et al. [18], this paper proposes a new highly autonomous ocean front detection method. First of all, using the EMD decomposition method, effective processing of SAR image trends and stripes has been done to lay a good foundation for subsequent image processing. Then, it effectively avoids the problem of requiring the human eye to determine the conversion threshold by calculating the maximum interclass variance, while ensuring the best conversion effect of the binary graph. Later, the curve fitting method was creatively used to further screen the frontal signals and prepare for the front connection. Through comparative analysis of the detection results with the old method, the new algorithm is significantly better than the old method in detection accuracy and detection efficiency. It is mainly reflected in three aspects: the high degree of agreement between the front shape detected by the new algorithm and the objective phenomenon, the meticulous depiction of the change of the front intensity and the high autonomy. The new algorithm especially focuses on avoiding the dependence on people in the detection process, improving the autonomy of the algorithm, and improving the universality and generalizability of the algorithm.
However, the new algorithm currently has some shortcomings: (1) The algorithm has not yet fully achieved independence and the fitting method used in curve fitting needs to be determined after the effect comparison. (2) The algorithm currently only addresses the situation where there is only one front in an image. (3) In the front connection, this algorithm uses the straight line connection between the adjacent nearest points and does not consider the morphological logical relationship between the graphics, which may cause the front morphology to deviate from the actual situation.
Compared with other ocean remote sensing methods, SAR has many unique advantages, especially in terms of resolution, which allows us clearly to observe some small and medium-scale ocean phenomena on the ocean surface. This article discusses a highly autonomous ocean front detection algorithm based on SAR images from the perspective of image processing. With the development of SAR technology, the research of ocean phenomena based on SAR data is bound to receive more attention. This front detection algorithm will also have higher application value.
References
[1] A. Ye, F.L., ‘Physical oceanography Qingdao’, Qingdao Ocean University Press, vol. 7, pp. 166–167, 1992.
[2] Pu, S., ‘Front in the world ocean’, Transactions of Oceanology and Limnology, vol. 1, pp. 63–75, 1985.
[3] Feng S., L.F., Li S., ‘Introduction to Marine Science’, Beijing: Higher Education Press, 1999.
[4] Li F., S.Y., ‘Ocean water mass analysis’, Qingdao: Qingdao Ocean University Press (Fishery), 1999.
[5] Ping, B., et al., ‘Bohai sea front detection using BJ-1 small satellite data’, Journal of Remote Sensing, vol. 18(3), pp. 686–695, 2014.
[6] Xue, C., Su, F., and Zhou, Q., ‘Extracting feature of ocean front based on mathematical morphology’, Marine Sciences, vol. 05, pp. 57–61, 2008.
[7] Zhang B., C.J., Chen B, ‘The Baroclinic Front Detection Method for Sea Surface Temperature and Geostrophic Current Fusion’, Journal Of Ocean Technology, vol. 033(005), pp. 66–70, 2014.
[8] Davis, J.C., ‘A survey of edge detection techniques. Computer graphics and image processing’, vol. 4(3), pp. 248–270, 1975.
[9] Wei, Z., Yang, C., and Yu, L., ‘An ocean front detection method based on the Canny operator and mathematical morphology’, Marine ence Bulletin, vol. 33(2), pp. 199–203, 2014.
[10] Anzhou, L., Weifeng, Z., and Xiumei, F., ‘Research progress of methods for the extraction of mesoscale ocean fronts and eddies based on remote sensing data’, Journal of Image and Graphics, 2017.
[11] Zhongquan, W., ‘Synthetic aperture radar satellite’, Beijing: Science Press, 2001.
[12] Guo-Xiang, L., ‘Principles of Imaging SAR and Characteristics of SAR Image’, Surveying and Mapping of Sichuan, 2004.
[13] Yuguang, L., ‘Satellite oceanography’, Beijing: Higher Education Press, 2009.
[14] Chen, B., Zhang, B.-t., and He, W.-p., ‘Detection of Ocean Fronts from Spaceborne SAR Images’, Remote sensing technology and application, vol. 17(4), pp. 177–180, 2002.
[15] H. Li, T.D., ‘Theory about synthetic aperture radar imaging of oceanic internal waves’, Marine Sciences, vol. 29(10), pp. 86–89, 2005.
[16] Chen, J., Chen, B., and Xu, S.-Q., ‘Detection of ocean features in SAR images with 2D continuous wavelet power spectrum’, Dianzi Xuebao (Acta Electronica Sinica), vol. 38(9), pp. 2128–2133, 2010.
[17] Kuang, H.-l., et al., ‘Thermal front retreivals from SAR imagery’, 2012 IEEE International Geoscience and Remote Sensing Symposium, IEEE, 2012.
[18] Li, T., et al., ‘A Method for Oceanic Front Detection Based on SAR Images’, Journal of Ocean Technology, 2018.
[19] Norden, Huang, et al., ‘The empirical mode decomposition and the Hilbert spectrum for nonlinear and non-stationary time series analysis’, Proceedings of the Royal Society of London. Series A: mathematical, physical and engineering sciences, 454(1971), pp. 903–995, 1998.
[20] Lina, Q., Bo, Z., and Zhankai, W., ‘Application of the OTSU method in image processing’, Radio engineering, vol. 36(7), pp. 25–26, 2006.
Biographies

Su-qin Xu, professor. Graduated from the University of Information Engineering with a master’s degree in engineering, and now teaches in the Naval Submarine Academy. She has been engaged in the research of marine remote sensing in the application field for a long time. She has undertaken a number of scientific research projects and made outstanding achievements in marine environment remote sensing, and has published more than 40 academic papers.

Hao Jiang graduated from Shanghai Ocean University, majoring in marine technology. After that, he entered the ocean College of Zhejiang University and obtained his master’s degree, majoring in physical oceanography. He worked as a research assistant in Zhejiang University for a period of time, and now works as a research and Development Engineer in CSSC Ocean Exploration Technology Institute Co., Ltd. During his study and work, he participated in a large number of marine scientific research work, and conducted in-depth research in the field of ocean mesoscale and small-scale phenomena and the exchange of material and energy between ocean and atmosphere.

Ting-ting Li received her bachelor’s degree in atmospheric science and master’s degree in physical oceanography from Ocean University of China in 2016 and 2018 respectively. She is currently teaching at the Naval Submarine Academy. Her research field is ocean remote sensing and simulation.

Li-ming Yuan received her Bachelor’s degree in Surveying Engineering from Shandong University of Science and Technology in 2016, Master degree in Photogrammetry and Remote Sensing from Ocean University of China in 2019. She works as a research and development engineer in CSSC Ocean Exploration Technology Institute Co., Ltd., with a title of assistant engineer. Her research interests are ocean remote sensing and big data analysis, and published 1 sci paper.

Lu Yu received his B.Sc. and M.Sc degrees in Radar Engineering from Naval University of Engineering, China, and Ph.D. degree in Control Science and Engineering from Naval Aviation University, China. He is now working at Naval Submarine Academy as a researcher. His main research area including information analysis of remote sensing data, target detection and machine learning.

Jie Chen is a scientific research staff member of the Navay Submarine Academy. She graduated in 2010 and obtained a doctor’s degree. Her major is computer application. She has been engaged in marine remote sensing technology research for many years.

Biao Chen, professor and doctoral supervisor. In July 1982, he graduated from Naval University of Engineering with a bachelor’s degree in physics. In July 1991, he graduated from China Ocean University with a master’s degree in marine physics. Since 2011, he has been an expert of the 701 subject expert group of the National 863 program and a specially invited expert of the national satellite application expert group. In 2011, he has enjoyed the special allowance of the State Council. Professor Chen Biao has been engaged in the research of marine environment satellite application technology and remote sensing detection technology for a long time, and has obtained outstanding achievements.

Bao-qiang Zhang, who has a bachelor’s degree and a master’s degree in geological engineering from Ocean University of China. After graduation, he first worked in the national marine technology center, and then worked as a R & amp; D Engineer in the Institute of marine exploration technology of China Shipbuilding Corporation. At present, his research field mainly focuses on the observation and feature extraction of small and medium scale ocean phenomena.
Journal of Web Engineering, Vol. 20_2, 471–490.
doi: 10.13052/jwe1540-9589.20211
© 2021 River Publishers