Evaluating Annotated Dataset of Customer Reviews for Aspect Based Sentiment Analysis
Dimple Chehal*, Parul Gupta and Payal Gulati
Department of Computer Engineering, J.C. Bose University of Science and Technology, YMCA, Faridabad, India
E-mail: dimplechehal@gmail.com; parulgupta_gem@yahoo.com; gulatipayal@yahoo.co.in
Corresponding Author
Received 31 December 2020; Accepted 10 September 2021; Publication 22 December 2021
Abstract
Sentiment analysis of product reviews on e-commerce platforms aids in determining the preferences of customers. Aspect-based sentiment analysis (ABSA) assists in identifying the contributing aspects and their corresponding polarity, thereby allowing for a more detailed analysis of the customer’s inclination toward product aspects. This analysis helps in the transition from the traditional rating-based recommendation process to an improved aspect-based process. To automate ABSA, a labelled dataset is required to train a supervised machine learning model. As the availability of such dataset is limited due to the involvement of human efforts, an annotated dataset has been provided here for performing ABSA on customer reviews of mobile phones. The dataset comprising of product reviews of Apple-iPhone11 has been manually annotated with predefined aspect categories and aspect sentiments. The dataset’s accuracy has been validated using state-of-the-art machine learning techniques such as Naïve Bayes, Support Vector Machine, Logistic Regression, Random Forest, K-Nearest Neighbor and Multi Layer Perceptron, a sequential model built with Keras API. The MLP model built through Keras Sequential API for classifying review text into aspect categories produced the most accurate result with 67.45 percent accuracy. K- nearest neighbor performed the worst with only 49.92 percent accuracy. The Support Vector Machine had the highest accuracy for classifying review text into aspect sentiments with an accuracy of 79.46 percent. The model built with Keras API had the lowest 76.30 percent accuracy. The contribution is beneficial as a benchmark dataset for ABSA of mobile phone reviews.
Keywords: Aspect based sentiment analysis, customer reviews, e-commerce; labelled dataset, machine learning, recommendation system, supervised learning.
1 Introduction
Customer feedback in the form of user reviews provides an account of a user’s hands-on experience with a product. Many e-commerce users rely on and trust these reviews more than other forms of advertising when making a purchase decision [1]. It has become obvious to analyse people’s opinions since the rise of social media [2]. In an online survey conducted by the authors, 70.3 percent of the 202 survey respondents considered a product review before purchasing it. This indicates the importance of product reviews in today’s world. Not only users, but stakeholders such as competing brands, can also learn the true intent of the customer from these reviews, which is useful in developing strategies to convert a potential customer into an actual customer. Sentiment analysis (SA) (also known as opinion mining) is a data mining field that can assist in understanding the user’s experience and categorising it as positive, neutral, or negative [3, 4]. SA’s focus has shifted from detecting the polarity of an entire document, paragraph, or sentence to the product aspects [5]. The idea behind aspect-based sentiment analysis (ABSA) is to identify the polarity of an aspect in a review sentence [6]. This type of sentiment analysis is a finer-grained version of previous versions such as document level and sentence level sentiment analysis [1]. Product reviews convey the users’ overall sentiment for a product and reveal their sentiment for product features such as processor, battery, accessory, etc. The following steps mark the ABSA process [7]:
1. Identification of aspect terms from sentences
2. Determination of polarity of aspect terms
3. Detection of aspect categories
4. Determination of polarity of aspect categories
ABSA consists primarily of two tasks: the first is to identify the aspects of the reviewed product, and the second is to unearth the sentiment expressed by the user for these aspects. In 2014, the first ABSA task was performed for restaurant and laptop reviews in the English language at the Semantic Evaluation (SemEval) workshop on NLP. In its annotation process apart from categories and polarity of aspects, aspect terms were also tagged. Annotation process usually involves assigning of aspect categories and polarity labels manually [8]. In 2015, the SemEval task tagged aspect polarity values and aspect categories as a combination of entity and attribute. In 2016, as part of SemEval task, datasets for multiple languages were created. The entities for which ABSA has been performed are movie reviews, digital cameras, restaurants, telecommunications, consumer electronics, and museum [3] in a variety of languages such as Czech, Bangla [1], French and Hindi [5]. However, no labeled dataset exist in the literature for the mobile phone domain in the English language. As the growth of labeled datasets is dependent on human intervention, it is critical to contribute annotated datasets [9]. Tagging aspect categories entails identifying an aspect category and assigning it to a review sentence. For example, “The iPhone design is good and the camera quality is awesome” has two aspect categories: Mobile Design and Camera Quality. The polarity label for both of these categories will be positive in this example.
An annotated dataset has been created for performing aspect-based sentiment analysis of mobile phone reviews provided by Amazon’s customers in the English language. The phone under consideration is Apple’s iPhone11. Labelled dataset is required for execution of supervised machine learning algorithms. The contribution of the paper is a dataset of mobile phone reviews from Amazon India which has been manually tagged for aspect categories and aspect sentiments by a team of 6 people including the authors. The prepared dataset is novel as no other dataset for performing supervised machine learning for aspect based sentiment analysis of mobile phone reviews in English language was available. Also, preparation of such kind of dataset requires human effort leading to a declined growth of such datasets making it all the more important for contributing annotated datasets. This dataset can be used in the area of recommender systems to understand the mindset of customers towards the aspects of mobile phone [10]. 960 user reviews of the black-colored 64GB variant have been downloaded through Python. These user comments have been collected in an excel file using Python’s BeautifulSoup package that traverses the HTML parse tree to access web page elements. Once collected, the reviews have been divided into sentences, resulting in a total of 2109 review sentences. The resulting dataset’s accuracy has been validated using state-of-the-art machine learning techniques. The goals are as follows:
• To build a labeled dataset of mobile phone reviews in English language by Amazon customers for automated ABSA.
• To conduct experiments so as to validate the effectiveness of the prepared dataset through machine learning models.
The remainder of the article is organized as follows: Section 2 consists of related work existing in literature. Section 3 describes the data collection process as well as the underlying survey that supported the dataset. Section 4 discusses the experimental evaluation and the results obtained. Lastly, Section 5 concludes the article.
2 Related Work
Classification is the process of identifying a class, distinguishing it from other classes, and finally assigning it to an object. In this process, objects are assigned to predefined classes. Text classification is the process of categorizing textual data, which can take the form of documents, paragraphs, sentences, or phrases [11, 12]. Sentiment analysis of textual data involves categorizing the data based on whether it contains positive, negative, or neutral opinions. Aspect-based sentiment analysis is a fine-grained version of sentiment analysis in which these opinions are assigned based on the product’s aspects. This aggregate result of aspects and their polarities can then be used to learn the finer details of existing features and their goodness, which is more helpful than the product’s overall opinion. E-commerce and other companies can also use this data to improve the quality of their products. Google Play Store, for example, uses reviews to rate the individual features of applications [2].
At SemEval 2014, the dataset for laptops and restaurants that included the aspect term, the polarity of the aspect term, the aspect category, and the polarity of the aspect category for each review was generated [3]. Aspect category was defined as a combination of entity type and its attribute type in a dataset created as part of SemEval 2015 [13]. As part of SemEval 2016, multilingual datasets were created for the restaurant (English, French, Spanish, Turkish, Russian, and Dutch language), laptop (English), mobile phone (Chinese, Dutch), digital camera (Chinese), hotel (Arabic), museum, and telecom (Turkish) domain [14]. A book-review dataset in Arabic with 14 aspect categories and 4 polarities (including the polarity ‘conflict’) was provided [15]. In [16], IT product- review dataset was provided for the ABSA task. Machine learning (linear-chain conditional random fields (CRFs)) approach was used to identify aspect terms and rule based approach supplemented this process.
When a machine is trained to predict the output given the input text to be classified and the output label or aspect categories/sentiments, this is referred to as supervised learning [11, 17–20]. The goal was to use deep learning and machine learning methods to determine the aspect category and sentiment of the collected review texts. The following are the various supervised machine learning techniques used:
K nearest neighbor (KNN)
KNN is an abbreviation for k-nearest neighbor, a statistical classification method. It is a nonparametric classifier from the family of proximity-based algorithms [9, 12, 21]. In this method, the nearest neighbors of the labeled examples from the training review are ranked for each test review, and then a class assignment is derived using the categories of the highest-ranked neighbors [22]. This model does not learn; instead, it memorizes and represents the entire dataset [23]. For high dimensional and sparse data, distance computation for the similarity between test and training reviews is computationally expensive. The most commonly used distance measures in this method are:
1. Euclidean distance: Euclidean distance between two points X and Y is determined as square root of sum of sum of their squared differences across all input attributes i [23]:
| (1) |
2. Manhattan distance: Sum of absolute difference of two points gives the Manhattan distance between two points.
| (2) |
3. Minkowski distance: Generalization of above two distances gives the Minkowski distance.
| (3) |
where, value of p is either 1 or 2. Manhattan distance is obtained when i is equal to 1 and Euclidean distance is obtained when p is equal to 2.
As a non-parametric method, this method suffers from the curse of dimensionality, requiring a large number of training examples to generalise satisfactorily for more features. Overfitting is more likely when large amounts of training data are provided in this manner. As a result, it is preferred for short texts rather than long texts [24].
Logistic Regression (LR)
In this method, given the input vector, the output class is assigned a probability [23, 25, 26]. The Logistic Regression model is based on the logistic function or sigmoid function. An S-shaped curve maps real values to values between 0 and 1. The standard notation for the sigmoid function is:
| (4) |
Where, z is any real number to be transformed between 0 and 1. Logistic regression is a multi-class classification problem that began as a binary classification problem. For an input sample z, the probability of being in the first class is given as:
| (5) |
Where, is parameter vector and z is the training sample. During training, algorithms such as maximum-likelihood estimation are used to minimize errors in the predicted probability.
Naïve Bayes (NB)
Naïve Bayes is a generative probabilistic classifier that makes use of the properties of the Bayes theorem to hypothesize the relationship between independent variables. The training documents estimate the conditional probability P(d|c) of a document belonging to a class, and the test documents estimate using the Bayes theorem.
| (6) |
It works well for independent features, which is also the method’s underlying naive assumption. Due to the inherent regularisation, NB is less likely to overfit than discriminative classifiers and performs well for smaller samples. This method is incapable of modeling feature interaction. NB classifiers have three types: Bernoulli, Gaussian, and Multinomial. Gaussian is used for continuous datasets, Bernoulli is used for binary datasets, and Multinomial Nave Bayes is used for count datasets [12, 27]. This classifier is used when memory and processing are important factors [17].
Random Forest (RF)
It is a discriminative classifier [12] based on multiple decision trees. A decision tree is made up of nodes and edges, where nodes represent the value of an attribute and edges represent the result of a test [28]. The best feature is chosen for splitting the node in the forest. For classification, the test is started at the root node and the edges are followed based on the results; the process is repeated until the leaf node is reached, and finally, the outcome corresponding to the leaf is predicted [29].
Support Vector Machine (SVM)
This is a discriminative classifier that attempts to identify a decision boundary by transforming non-linearly separable data to a higher dimension space with a separating hyperplane. The hyperplane can be represented as:
| (7) |
Where w is the weight and b is the bias or the intercept. Each input point representing the sample lies on either side of the hyperplane. Initially designed for solving two-class problems, the decision surface separates the data points in the best manner with a maximum possible margin between the two classes. The data points which contribute to defining the margin are called support vectors. The magnitude of margin is the perpendicular distance from the hyperplane to the data points. The goal of training in SVM is to find the coefficients that separate the classes optimally.
| (8) |
Deep Learning (DL)
Deep learning is a branch of machine learning that was inspired by neural networks. Deep learning models, as opposed to machine learning, learn the problem’s features on their own without requiring it to go through a feature extraction process [25]. Layers are stacked on top of one another in the Sequential model one at a time until we achieve the desired architecture for Multilayer Perceptron [30]. The first step is to provide the input features to the input layer, after which the number of layers, the number of neurons in each layer, and the activation function are determined. The following step is to compile the model for training. Training the model entails determining the best weight parameter values to map our input to the output over several iterations known as epochs. The loss function for weight evaluation must be specified in this step. The batch size corresponds to the number of training samples to be considered within an epoch before the weight variables are updated, can also be specified.
Multi Layer Perceptron (MLP)
The Perceptron was first introduced as a model of the biological neuron for binary classification [23]. It has been generalized to deal with multi-class problems. In Perceptron, the input is mathematically transformed by multiplying the input by the weight parameter, summing the weighted inputs, adding the bias variable, and passing it to an activation function, which produces the final output [31]. The binary classification activation function is defined as follows:
| (9) |
where, z is the net input defined as:
| (10) |
where, x is a sample from the training set, w is the corresponding weight vector and is threshold.
The algorithm begins by initializing the weight vectors with zero. The corresponding predicted class for each sample is computed and compared to the actual class value. If the predicted and actual class values differ, the weights are updated. The updated weight vector is as follows:
| (11) |
where, is the learning rate, represents the actual class and represents the predicted class for sample . Several layers guide classification in a Multi-layer Perceptron network [28]. It is termed as a logistic regression classifier variant [25]. It is a subtype of the feed-forward artificial neural network where the features of the input data are transformed into a predefined number of linearly separable spaces, with each layer fully connected.
3 Dataset Description
The dataset constructed for ABSA consists of product reviews of the Apple-iPhone11 mobile written by Amazon customers in the English language. A survey of 21 questions and 202 respondents conducted by the authors was used to scrap the dataset comprising of 960 product reviews. The online survey was conducted to understand the users’ preference for usage of e-commerce platform for purchasing products online, consideration of product reviews in making their decision to purchase/reject a product, preference towards the brand and aspects/features of a mobile phone and their inclination for the operating system of a mobile phone.
The survey questions have been included in the appendix below. Apart from questions about the survey’s objective, the survey included questions about user demographic information such as age, gender, profession, and education level. The questionnaire responses assisted us in justifying our dataset preparation. 18.3 percent of respondents were between the ages of 16 and 20, 45 percent of respondents were between the ages of 21 and 25, 19.8 percent of respondents were between the ages of 26 and 30, 5.4 percent of respondents were between the ages of 31 and 35, and 7.9 percent of respondents were between the ages of 36 and 40. The remaining respondents belonged to the remaining age groups, as shown in Figures 1 and 2. It should be noted that there is no relationship between the questionnaire respondents and the product reviewers under consideration. The responses were collected using Google forms, and the reviews were obtained from the Amazon India website.
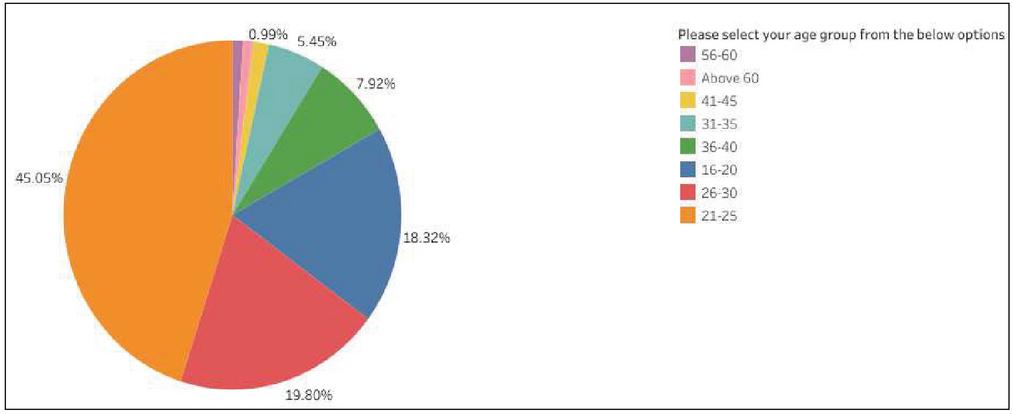
Figure 1 Responses to age group.
From the total responses received, 61.9% were female respondents and 35.6% were male respondents.
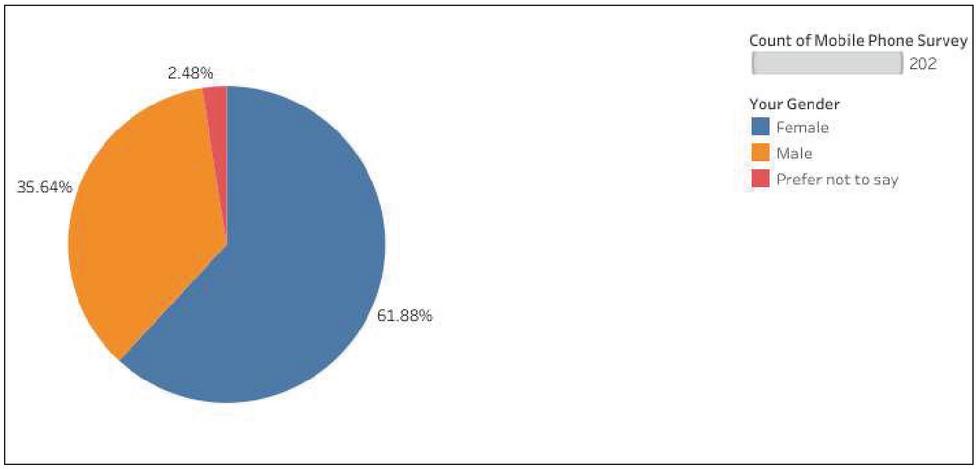
Figure 2 Responses to gender.
The majority of respondents (67.3 percent) were students, with only 16.3 percent working and 2 percent running their businesses. The majority of respondents (31.2 percent) owned a Redmi phone, followed by Samsung (15.3%), OnePlus (11.9%), and Apple (11.4 percent). Approximately 65.9 percent of respondents have been using their current mobile phones for the past two years, while only 6.4 percent have been using it for more than four years. The majority of respondents (53%) were satisfied with their current mobile phones, and 81.2 percent thought Android was a better operating system in a mobile phone. From the total responses recorded, 61.9% were female respondents and 35.6% were male respondents.
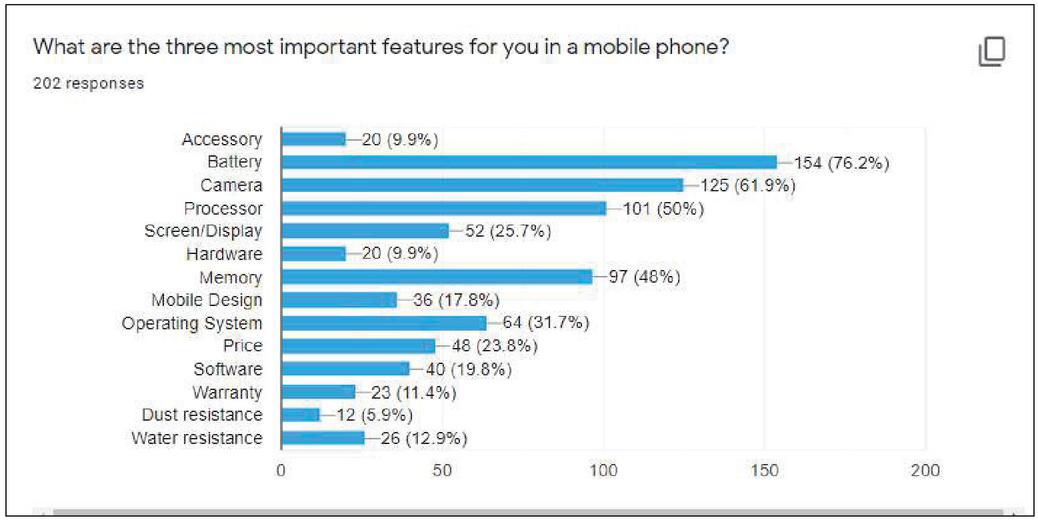
Figure 3 Responses to important aspect of mobile phone.
29.2 percent of all respondents voted for Amazon’s e-commerce platform as a better place to buy a mobile phone. Another 29.2 percent of respondents thought that offline stores were a better option. Furthermore, Amazon and Flipkart received 25.7 percent of the responses. However, as shown in Figure 4, Flipkart received only 11.4 percent of the responses.

Figure 4 Responses to preference for e-commerce platform.
Most importantly, as illustrated in Figure 5, 70.3 percent of respondents considered a product’s review before purchasing a product from e-commerce platforms, and only 23.5 percent provided the review after purchasing the product indicating the sparsity of data on user reviews.
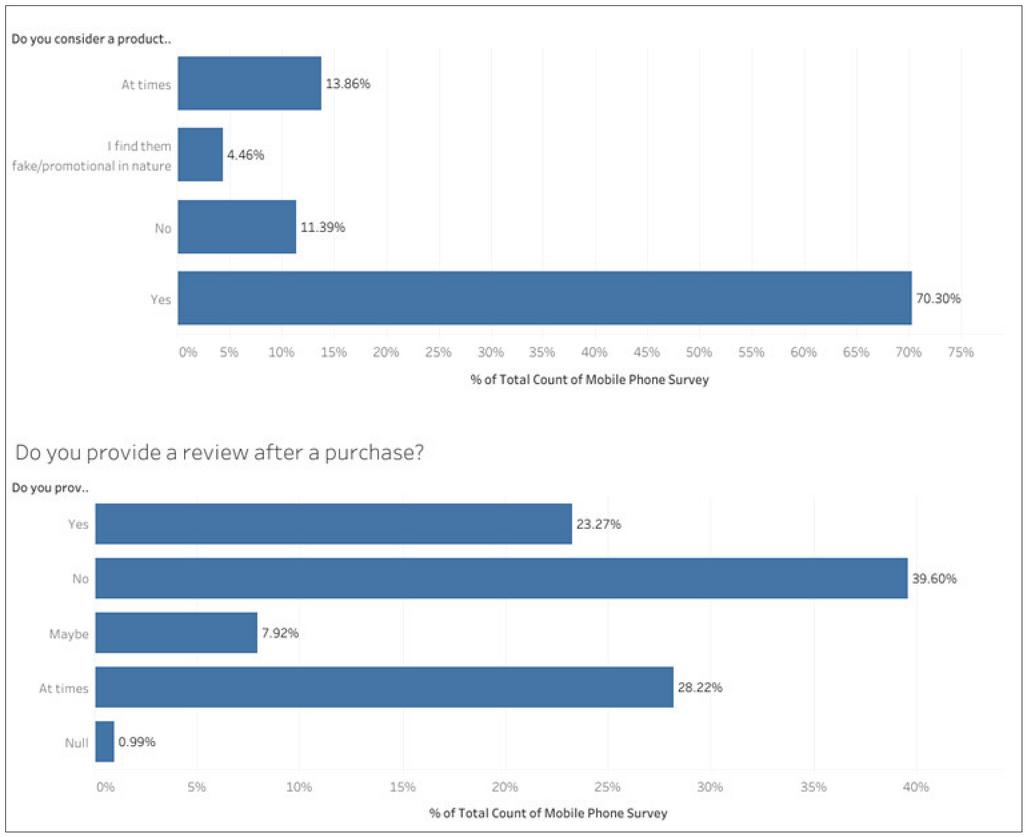
Figure 5 Responses to consideration of product reviews before and after purchase.
As shown in Figure 6, when comparing user review and rating as to which one is more dependable, user review received 18.8 percent of the responses alone and user rating received only 5.9 percent of the responses.

Figure 6 Responses to dependability of user reviews vs user ratings.
Finally, 32.7 percent of respondents thought Apple had the best phone on the market right now, but only 11.4 percent of the total owned it, as shown in Figure 7. We chose Apple-iPhone11 reviews to prepare the dataset because the majority of the users thought Apple was the best phone manufacturer.
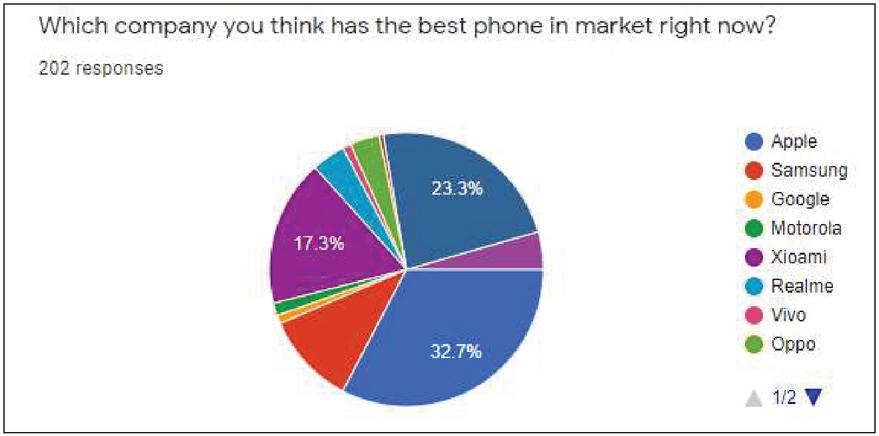
Figure 7 Responses to best brand of phone.
The dataset for ABSA of mobile phone reviews in the English language was created programmatically by scraping publicly available reviews from Amazon’s Indian e-commerce site of Apple-iPhone11. Following data collection, the dataset was annotated with a predefined set of aspect categories.
a. Data collection
The scraped dataset includes 960 mobile phone reviews (2542 sentences). For training and testing the ABSA system, the dataset was cleaned manually to remove review sentences with no semantics. As a result, a total of 2109 sentences have been manually annotated with relevant aspects/features and sentiment categories by annotators described in Table 3. Figure 8 depicts the ten most frequently occurring words in the scrapped dataset.

Figure 8 Top ten commonly occurring words in reviews.
Each review has been broken down into sentences using a full stop as the sentence terminator programmatically. A common review ID has been assigned to all the sentences of a review. Sentences with fewer than three alphabets were eliminated. Because review sentences can have multiple aspects, such sentences have been repeated and different aspect categories have been tagged for each of them, as shown in Table 1.
Table 1 Sample annotated dataset
| S.No | Review Text | Aspect Sentiment | Aspect Category |
| 1 | 28/09/19, but the thing I got started heating up every now and then | Negative | Performance |
| 1 | As it continued, tried to return the product by speaking to Amazon customer support but in vain | Negative | Amazon |
| 1 | Contacted Applecare, just to be consoled that it’s quite normal | Neutral | Brand |
| 1 | I was much elated to receive the iPhone 11 so fast, next day of dispatch i.e. | Positive | Delivery |
| 1 | It was handed over to the Apple ASP as the return window closed on 10/10/19 (what use it was for??) and diagnosed as having issues and has further been sent to Apple repair facility at Bengaluru | Negative | Brand |
| 1 | So I’m here w/out my first iPhone after using it(suffering for??) just a little over 2 weeks and the CREDIT GOES TO AMAZON !! Bravo, keep it up Amazon | Negative | Amazon |
| 1 | Some body called me back to convey that only Apple will decide which one to take back | Negative | Amazon |
| 1 | Why is then Amazon took up the sacred duty of selling such an item which they can’t exchange/ have no control ? The product developed new issues like proximity sensor malfunction and last but most importantly loosing mobile network every other minute(even had two software updates) | Negative | Amazon |
| 1 | Why is then Amazon took up the sacred duty of selling such an item which they can’t exchange/ have no control ? The product developed new issues like proximity sensor malfunction and last but most importantly loosing mobile network every other minute(even had two software updates) | Negative | Hardware |
| 1 | Why is then Amazon took up the sacred duty of selling such an item which they can’t exchange/ have no control ? The product developed new issues like proximity sensor malfunction and last but most importantly loosing mobile network every other minute(even had two software updates) | Negative | Software |
| 1 | May be my first negative review about the product & Amazon both | Negative | General |
| 1 | May be my first negative review about the product & Amazon both | Negative | Amazon |
| 2 | I grabbed this phone with HDFC 6K Instant Discount Offer at Just 64K (128 GB Variant) | Positive | Price |
| 2 | I recommend you to prefer using 18W charger | Neutral | Hardware |
| 2 | The phone comes with 5W charger which charge your phone slowly | Negative | Hardware |
| 2 | The phone is great but if you use “in the box” accessories like “EarPods with Lighting Connector”, then you might feel a little pain in your ears | Negative | Hardware |
| 2 | You can also take pictures in wide angles and the image quality is awesome | Positive | Camera |
| 2 | The iPhone design is good and the camera quality is awesome | Positive | MobileLooks |
| 2 | The iPhone design is good and the camera quality is awesome | Positive | Camera |
| 2 | But the product is great and I’m just lovin it | Positive | General |
| 2 | Phone got delivered at 9am on 28th September (I pre-order it on 27th September at 3am in the morning), I got my phone before the delivery date with nice and secured packaging | Positive | Delivery |
| 2 | The overall look of the phone is premium and face unlocking is fast | Positive | MobileLooks |
| 2 | Well, I’ve never tried the iPhone before and I’m using this for the first time (Yes, I’m already using other apple products like MacBook Air & Pro) | Neutral | General |
As of now, interpretation of emoticons by the users has not been taken into consideration and emoticons have been removed when found. The dataset has been divided into 70:30 for training and testing. Table 2 displays the statistics for the scraped data. It lists the predefined aspect categories that were identified prior to the start of the manual tagging process.
Table 2 Dataset statistics
| Polarity | ||||
| Aspect Categories | Positive | Neutral | Negative | Total |
| Accessory | 14 | 4 | 49 | 67 |
| Amazon (Service Seller) | 28 | 8 | 32 | 68 |
| Battery | 147 | 9 | 38 | 194 |
| Brand | 103 | 10 | 20 | 133 |
| Camera | 221 | 11 | 39 | 271 |
| Delivery | 47 | 2 | 17 | 66 |
| Display | 72 | 9 | 40 | 121 |
| General | 491 | 47 | 45 | 583 |
| Hardware | 32 | 7 | 40 | 79 |
| Mobile_Looks | 64 | 6 | 21 | 91 |
| OS | 57 | 5 | 17 | 79 |
| Performance | 45 | 0 | 24 | 69 |
| Price | 108 | 10 | 39 | 157 |
| Processor | 6 | 3 | 6 | 15 |
| Software | 50 | 4 | 37 | 91 |
b. Annotation Steps
Six annotators identified the aspect category from a predefined list of aspect categories and expressed their polarity (positive, neutral, or negative) toward the identified aspect. A total of 15 potential aspect categories of a mobile phone were identified. For tagging, the dataset was divided equally among three annotators. In the event of a tagging conflict, the authors made the final decision. Table 3 displays information about the annotators of the dataset.
Table 3 Details related to annotators of the dataset
| Annotator ID | Profession | Task |
| 1 | Research Scholar | Data Collection and final annotation |
| 2 | Faculty/ Author | Final decision on annotation |
| 3 | Faculty/Author | Final decision on annotation |
| 4 | Post Graduate Student | Initial annotation of dataset |
| 5 | Post Graduate Student | Initial annotation of dataset |
| 6 | Post Graduate Student | Initial annotation of dataset |
4 Baseline Experiments and Results
Based on supervised machine learning, models such as Naive Bayes (NB), Support Vector Machine (SVM), Logistic Regression (LG), Random Forest (RF), K Nearest Neighbor (KNN), and Deep Learning Model (Keras-MLP) using Keras Sequential Model API in Python were constructed to identify the best model for classifying the reviews. Aspects such as memory, mobile quality, dust resistance, and water resistance were discarded in the machine learning process due to significantly fewer reviews. By removing them from the training and testing datasets, the accuracy of all models improved significantly, depicting the application of our annotated dataset, namely the detection of aspect category and sentiment.
Accuracy (ACC) is defined as the proportion of correctly classified reviews divided by the total number of reviews. It is a widely used metric for assessing the performance of classification methods [9]. Higher accuracy is preferred. Table 4 shows the accuracy scores from the training and testing phases for classifying review sentences based on their aspect categories and sentiments. The best results are highlighted in bold and green, while the worst results are highlighted in bold and red. The result was obtained through 3-fold cross-validation, and hyperparameter tuning was used to improve the accuracy of these models.
| (12) |
where, TP stands for True Positive, i.e. percentage of actually correctly classified reviews that are predicted classified correctly.
FP stands for False Positive, i.e. percentage of incorrectly classified reviews that are predicted correctly.
FN stands for False Negative i.e. percentage of incorrectly classified reviews that are predicted incorrectly.
TN stands for True Negative i.e. percentage of correctly classified reviews that are predicted incorrectly.
Table 4 Accuracy of machine learning models on proposed dataset
| Accuracy | Accuracy | |||
| Aspect Category | Aspect Sentiment | |||
| Model | Training Phase | Testing Phase | Training Phase | Testing Phase |
| Keras-MLP | 0.8896 | 0.6745 | 0.977 | 0.763 |
| LR | 0.9241 | 0.6319 | 0.9864 | 0.7709 |
| KNN | 0.5325 | 0.4992 | 0.8679 | 0.7725 |
| NB | 0.878 | 0.5719 | 0.981 | 0.793 |
| RF | 0.7168 | 0.6319 | 0.9018 | 0.7757 |
| SVM | 0.8656 | 0.6398 | 0.8875 | 0.7946 |
Table 5 shows the precision (P), recall (R) and f-measure (F1) for train and test data for the built models. The precision, recall and f-measure scores obtained are calculated as:
| (13) | ||
| (14) |
F-measure combines both precision and recall as follows:
| (15) |
Table 5 Evaluation of machine learning models on proposed dataset
| Testing Phase | Testing Phase | |||||
| Aspect Category | Aspect Sentiment | |||||
| Model | Precision | Recall | F-Score | Precision | Recall | F-Score |
| Keras-MLP | 0.66 | 0.63 | 0.71 | 0.75 | 0.76 | 0.77 |
| KNN | 0.56 | 0.5 | 0.45 | 0.76 | 0.77 | 0.75 |
| LR | 0.63 | 0.63 | 0.62 | 0.74 | 0.77 | 0.75 |
| NB | 0.56 | 0.57 | 0.56 | 0.75 | 0.79 | 0.77 |
| RF | 0.63 | 0.63 | 0.6 | 0.75 | 0.78 | 0.73 |
| SVM | 0.62 | 0.64 | 0.62 | 0.74 | 0.79 | 0.75 |
As shown in Figures 9 and 10, the deep learning model (MLP model built using Keras API) for classifying review text into fifteen predefined aspect categories produced the most accurate result in the testing phase, with an accuracy of 67.45 percent. K-nearest neighbor performed the worst in this task, achieving only 49.92 percent accuracy. With an accuracy of 79.46 percent, Support Vector Machine was the most accurate for classifying review text into three predefined aspect sentiments. The MLP model had the lowest accuracy with 76.30 percent for aspect sentiment classification.

Figure 9 Performance of models on proposed dataset (aspect category).
This experimental evaluation was conducted through the Keras module for deep learning and the scikit-learn module for machine learning models provided by open-source Python software [32–34]. Standard Windows system with 64 bit Intel Core i3 CPU @2.00 GHz, 2000 MHz, 2 Core(s), 4 logical processors and 4.00 GB RAM was used for training and testing the ABSA system.
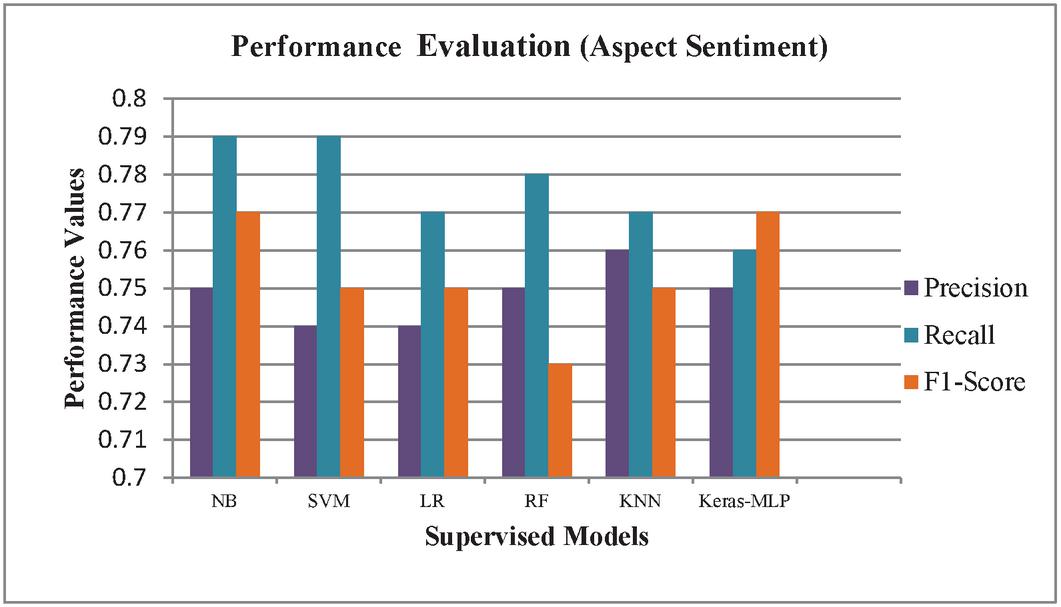
Figure 10 Performance of models on proposed dataset (aspect sentiment).
For each of the above models standard architecture commonly followed was initially used. This architecture was then optimimum performance by tuning (trying out all possible combinations of hyperparameters to achieve the best possible output) the hyperparameters using the GridSearchCV method under the scikit-learn library in Python. The hyperparameters tuned for the stated machine learning models for aspect category and aspect sentiment classification are shown in Tables 6 and 7 below.
Table 6 Hyperparameters tuned for machine learning models for aspect category classification
| NB | SVM | LR | RF | KNN | Keras-MLP | |
| Hyper | alpha =0.01 | alpha=0.001 | C=100000.0 | ccp_alpha=0.0 | algorithm=’auto’ | Batch_size=100 |
| parameters | class_prior=None | average=False | dual=False | bootstrap=False | leaf_size=30 | Epochs=50 |
| for | fit_prior=True | class_weight=None | class_weight=None | class_weight=None | metric=’minkowski’ | |
| Aspect | early_stopping=False | intercept_scaling=1 | criterion=’gini’ | metric_params=None | ||
| Category | epsilon=0.1 | multi_class=’auto’ | max_depth=50 | n_jobs=None | ||
| eta0=0.0 | random_state=None | max_features=’sqrt’ | n_neighbors=11 | |||
| fit_intercept=True | fit_intercept=True | max_leaf_nodes=None | p=2 | |||
| l1_ratio=0.15 | l1_ratio=None | max_samples=None | weights=’uniform’ | |||
| learning_rate=’optimal’ | solver=’saga’ | min_impurity_decrease=0.0 | ||||
| loss=’hinge’ | max_iter=100 | min_impurity_split=None | ||||
| max_iter=1000 | n_jobs=None | min_samples_leaf=2 | ||||
| n_iter_no_change=5 | penalty=’none’ | min_samples_split=10 | ||||
| n_jobs=None | tol=0.0001 | min_weight_fraction_leaf=0.0 | ||||
| penalty=’l2’ | verbose=0 | n_estimators=800 | ||||
| power_t=0.5 | warm_start=False | n_jobs=None | ||||
| random_state=None | oob_score=False | |||||
| shuffle=True | verbose=0 | |||||
| tol=0.001 | warm_start=False | |||||
| validation_fraction=0.1 | ||||||
| verbose=0 | ||||||
| warm_start=False |
Table 7 Hyperparameters tuned for machine learning models for aspect sentiment classification
| NB | SVM | LR | RF | KNN | Keras-MLP | |
| Hyper | alpha=0.01 | alpha=0.001 | C=100000.0 | ccp_alpha=0.0 | algorithm=’auto’ | Batch_size=500 |
| parameters | class_prior=None | average=False | dual=False | bootstrap=False | leaf_size=30 | Epochs=50 |
| for | fit_prior=True | class_weight=None | class_weight=None | class_weight=None | metric=’minkowski’ | |
| Aspect | early_stopping=False | intercept_scaling=1 | criterion=’gini’ | metric_params=None | ||
| Sentiment | epsilon=0.1 | multi_class=’auto’ | max_depth=50 | n_jobs=None | ||
| eta0=0.0 | random_state=None | max_features=’sqrt’ | n_neighbors=11 | |||
| fit_intercept=True | fit_intercept=True | max_leaf_nodes=None | p=2 | |||
| l1_ratio=0.15 | l1_ratio=None | max_samples=None | weights=’uniform’ | |||
| learning_rate=’optimal’ | solver=’saga’ | min_impurity_decrease=0.0 | ||||
| loss=’hinge’ | max_iter=100 | min_impurity_split=None | ||||
| max_iter=1000 | n_jobs=None | min_samples_leaf=2 | ||||
| n_iter_no_change=5 | penalty=’none’ | min_samples_split=10 | ||||
| n_jobs=None | tol=0.0001 | min_weight_fraction_leaf=0.0 | ||||
| penalty=’l2’ | verbose=0 | n_estimators=800 | ||||
| power_t=0.5 | warm_start=False | n_jobs=None | ||||
| random_state=None | oob_score=False | |||||
| shuffle=True | verbose=0 | |||||
| tol=0.001 | warm_start=False | |||||
| validation_fraction=0.1 | ||||||
| verbose=0 | ||||||
| warm_start=False |
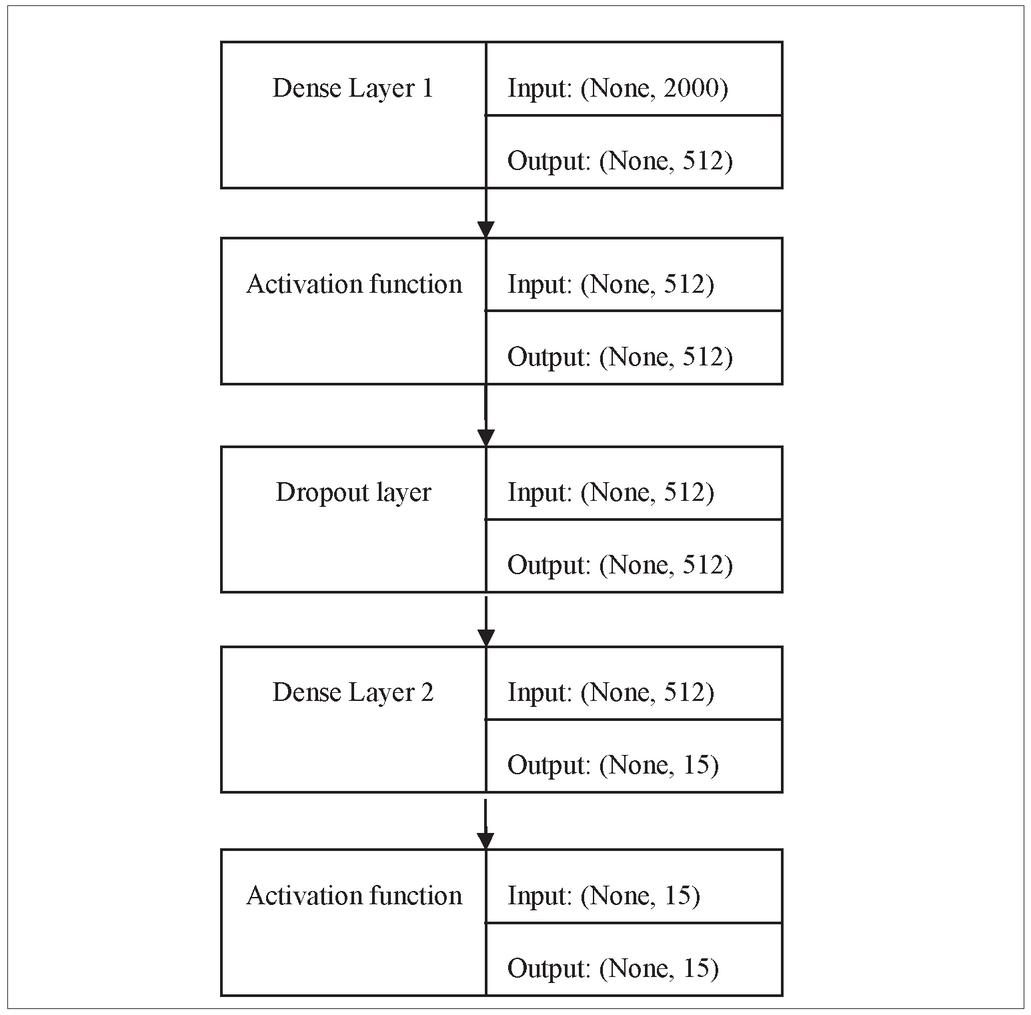
Figure 11 Sequential model architecture.
Table 8 Performance evaluation of deep learning model (aspect category)
| Deep Learning Model (Aspect Category) | |||||||||
| Train @ epochs=50 AND batch_size=100 | Validation@ epochs=50 AND batch_size=100 | ||||||||
| Loss | Accuracy | F1_Score | Precision | Recall | Loss | Accuracy | F1_Score | Precision | Recall |
| 0.2682 | 0.8896 | 0.94574 | 0.8591 | 0.8979 | 1.2982 | 0.6745 | 0.7100 | 0.6272 | 0.6649 |
Table 9 Performance evaluation of deep learning model (aspect sentiment)
| Deep Learning Model (Aspect Sentiment) | |||||||||
| Train @ epochs=50 AND batch_size=500 | Validation@ epochs=50 AND batch_size=500 | ||||||||
| Loss | Accuracy | F1_Score | Precision | Recall | Loss | Accuracy | F1_Score | Precision | Recall |
| 0.0795 | 0.9770 | 0.9776 | 0.9770 | 0.9773 | 0.8269 | 0.7630 | 0.7682 | 0.7472 | 0.7574 |
Tables 8 and 9 are supplementary tables that detail the performance of the Sequential model for aspect category and aspect sentiment classification over 50 epochs and batch size 100, respectively. The input features are limited to a maximum of 2000 words and are fed into the sequential model via the input_dim parameter. The chosen model is made up of two dense layers: the first layer is made up of 512 neurons, and the second layer is made up of 15 neurons, the output of which is mapped to 15 categories in the case of aspect category classification and three neurons in the case of aspect sentiment classification. Figure 11 depicts the architecture of the sequential model.
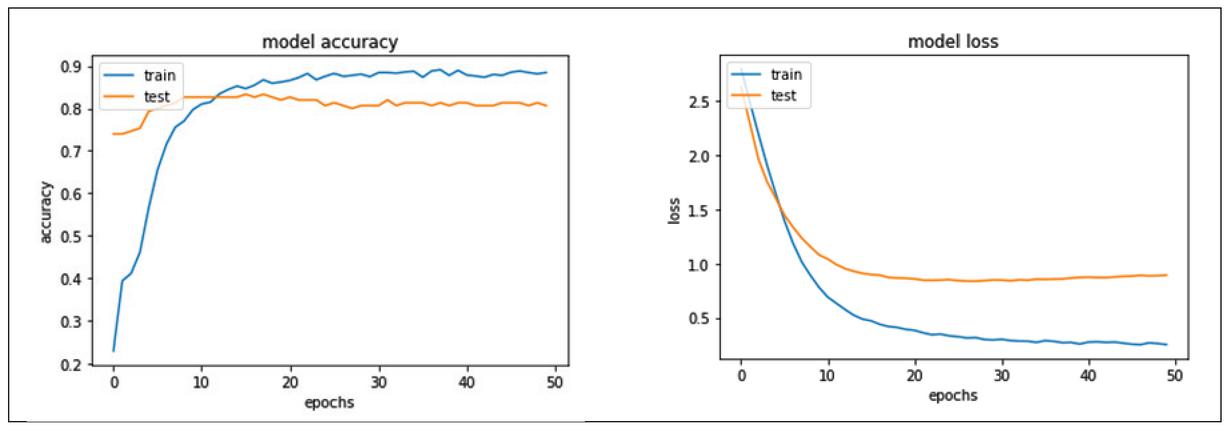
Figure 12 Sequential model accuracy and loss corresponding to aspect category classification.
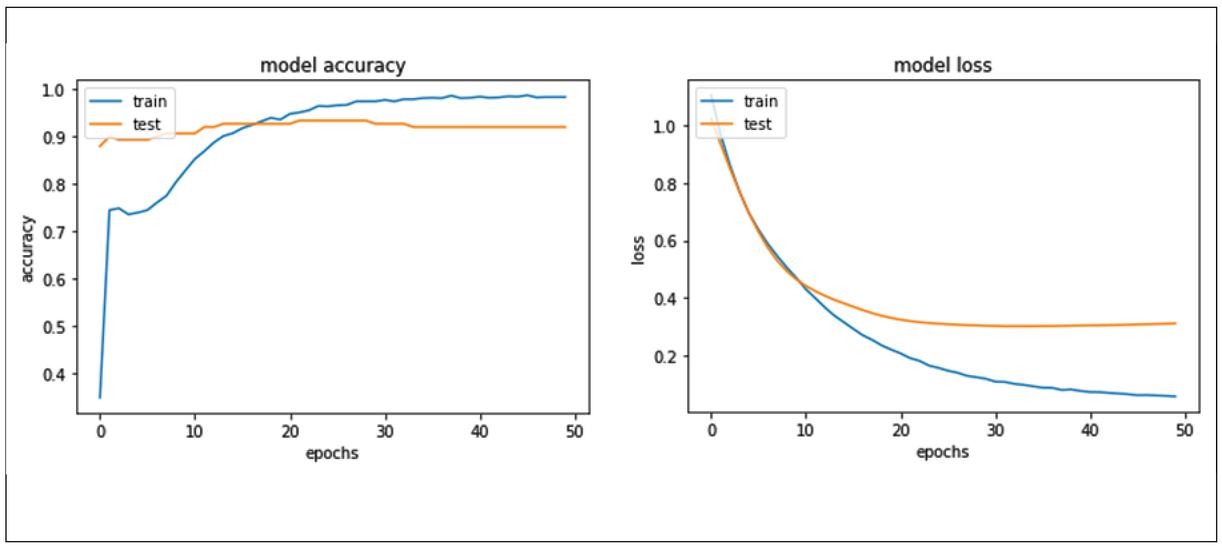
Figure 13 Sequential model accuracy and loss corresponding to aspect sentiment classification.
ReLu activation function is used in the first layer and softmax activation function in the output layer. A dropout of 0.5 is added to set the fraction of inputs to zero to reduce overfitting. The model is compiled using categorical cross-entropy loss and optimized with the stochastic gradient descent method known as the adam optimizer. A validation split of 10% is configured while fitting the model to check the model for training and validation accuracies over all the epochs.
Figures 12 and 13 represent the model accuracy and model loss of the sequential model for aspect category and aspect sentiment classification respectively.
As shown in Figure 12, the sequential model accuracy for testing phase for aspect sentiment classification is almost constant after 30 epochs and is about a point less than the training phase. Also, in Figure 13, the model loss testing phase for aspect sentiment classification is constant after 20 epochs.
5 Limitations and Conclusion
A dataset for ABSA of mobile phone reviews has been provided. The dataset has been designed to automate aspect category extraction and aspect category polarity identification using machine learning and deep learning techniques. Furthermore, the constructed dataset has been evaluated using several state-of-the-art machine learning techniques. Understanding the intent conveyed by emoticons was not taken into account in this study. In addition, the abbreviated words have not been addressed. The dataset collected for a single entity – Apple-iPhone11 mobile Phone – had less than 1000 reviews, resulting in a small corpus of the labeled dataset but significant results. The above-mentioned satisfactory results were generated using actual imbalanced data, which can be improved by balancing the dataset. The MLP sequential model was the most accurate when the number of predefined aspect categories were fifteen and the least accurate when the number of predefined aspect sentiments were three, indicating a need for more data for the training process. Traditional ML model Support Vector Machine performed the best when only three predefined aspect sentiments were to be classified. The majority of the ML models achieved satisfactory accuracies ranging from 49 to 67 percent for aspect category classification and 76 to 79 percent for aspect sentiment classification. As a result, this dataset of mobile phone reviews in English can serve as a benchmark for ABSA. The future scope of this work would be to calculate the importance of mobile phone aspects for customers and products to develop an aspect-based recommender system.
Author Contributions
All authors contributed to this work. Conceptualization and method selection was done by Dimple Chehal, Parul Gupta and Payal Gulati; data collection and analysis was done by Dimple Chehal; writing – original draft preparation was done by Dimple Chehal; and writing – review and editing was done by Parul Gupta and Payal Gulati. All the authors have read, reviewed and approved the final manuscript.
Acknowledgement
Dimple Chehal is thankful to University Grants Commission (UGC), New Delhi, India for providing fellowship under Junior Research Fellowship (JRF) vide letter no. F.15-9(JUNE 2015)/2015(NET) from August 2017 to July 2019 and Senior Research Fellowship (SRF) from August 2019 onwards.
Appendix
Survey Questionnaire—————————————————————
* Required
1. Your Name ___________________________
2. Please select your age group from the below options
Mark only one oval.
| 16–20 | 21–25 | ||
| 26–30 | 31–35 | ||
| 36–40 | 41–45 | ||
| 46–50 | 51–55 | ||
| 56–60 | Above 60 |
3. Your Gender *
Mark only one oval.
| Female | |
| Male | |
| Prefer not to say |
4. Your Profession *
Mark only one oval.
| Student | |
| Business | |
| Retired | |
| Private Sector Employee | |
| Public Sector Employee | |
| Others | ____________ |
5. Your Education *
Mark only one oval.
| Pursuing Graduation | |
| Graduate | |
| Pursuing Post Graduation | |
| Post Graduate | |
| Pursuing PhD | |
| Doctorate |
6. Do you own a phone? *
Mark only one oval.
| Yes | |
| No |
7. Your current phone brand? *
Mark only one oval.
| Apple | Realme | ||
| Motorola | Vivo | ||
| Nokia | Oppo | ||
| Samsung | Honor | ||
| Redmi | OnePlus | ||
| Other | __________________ | ||
8. How long have you been using your current phone? *
Mark only one oval.
| Less than a year | |
| 1–2 years | |
| 2–3 years | |
| 3–4 years | |
| 4 years and above |
9. Your level of satisfaction with your current phone? *
Mark only one oval.
| Very satisfied | |
| Satisfied | |
| Neutral | |
| Dissatisfied | |
| Very dissatisfied |
10. How much time do you spend using your phone in a day? *
Mark only one oval.
| Less than 2 hours | |
| 2–4 hours | |
| 4–6 hours | |
| 6–8 hours | |
| 8–10 hours | |
| More than 10 hours |
11. Which Operating System wins any day? *
Mark only one oval.
| iOS | |
| Android | |
| Don’t know what an Operating System is? | |
| Other: | _______ |
12. How much are you willing to pay for a mobile phone? *
Mark only one oval.
| Less than 10000 | |
| 10000–20000 | |
| 20000–30000 | |
| 30000–40000 | |
| 40000–50000 | |
| Above 50000 |
13. Which of the following payment mode do you prefer? *
Mark only one oval.
| Cash | |
| EMI using debit/credit card | |
| Payments using Wallets (PayTM/Amazon Pay/Bhim UPI etc) |
14. What are the three most important features for you in a mobile phone? *
Check all that apply.
| Accessory | |
| Battery | |
| Camera | |
| Processor | |
| Screen/Display | |
| Hardware | |
| Memory | |
| Mobile Design | |
| Operating System | |
| Price | |
| Software | |
| Warranty | |
| Dust resistance | |
| Water resistance |
15. Which e-commerce platform you feel is good for purchasing a mobile phone? *
Mark only one oval.
| Amazon | |
| Flipkart | |
| Both | |
| Neither | |
| Prefer buying from offline store |
16. Do you consider a product’s review before buying it from any e-commerce platform? *
Mark only one oval.
| Yes | |
| No | |
| I find them fake/promotional in nature | |
| At times |
17. Do you provide a product review after you’ve bought it from any e-commerce platform?
Mark only one oval
| Yes | |
| No | |
| At times |
18. What kind of experience you post in your reviews of a product?
| Only the positive ones | |
| Mostly the negative ones | |
| Critical reviews containing both positive and negative |
19. Which is more dependable when buying a product online? *
Mark only one oval.
| User Ratings | |
| User Reviews | |
| Both | |
| None | |
| I don’t know what they are |
20. Which company you think has the best phone in market right now? *
Mark only one oval.
| Apple | |
| Samsung | |
| Motorola | |
| Xioami | |
| Realme | |
| Vivo | |
| Oppo | |
| Honor | |
| OnePlus | |
| Other | __________________________ |
21. Any suggestions/improvements for this survey?
References
[1] M. Rahman and E. Kumar Dey, “Datasets for Aspect-Based Sentiment Analysis in Bangla and Its Baseline Evaluation,” Data, vol. 3, no. 2, p. 15, May 2018.
[2] A. Sabeeh and R. K. Dewang, “Comparison, classification and survey of aspect based sentiment analysis,” in Communications in Computer and Information Science, 2019, vol. 955, pp. 612–629.
[3] M. Pontiki, D. Galanis, J. Pavlopoulos, H. Papageorgiou, I. Androutsopoulos, and S. Manandhar, “SemEval-2014 Task 4: Aspect Based Sentiment Analysis,” in Proceedings of the 8th International Workshop on Semantic Evaluation (SemEval 2014), 2015, pp. 27–35.
[4] H. U. Khan, “MIXED-SENTIMENT CLASSIFICATION OF WEB FORUM POSTS USING LEXICAL AND NON-LEXICAL FEATURES,” Journal of Web Engineering, vol. 16, no. 1, pp. 161–176, 2017.
[5] M. S. Akhtar, A. Ekbal, and P. Bhattacharyya, “Aspect based sentiment analysis: category detection and sentiment classification for hindi,” Lecture Notes in Computer Science (including subseries Lecture Notes in Artificial Intelligence and Lecture Notes in Bioinformatics), vol. 9624 LNCS, pp. 246–257, 2018.
[6] Y. Noh, S. Park, and S. B. Park, “Aspect-based sentiment analysis using aspect map,” Applied Sciences (Switzerland), vol. 9, no. 16, pp. 1–16, 2019.
[7] S. Kiritchenko, X. Zhu, C. Cherry, and S. Mohammad, “NRC-Canada-2014: Detecting Aspects and Sentiment in Customer Reviews,” no. SemEval, pp. 437–442, 2015.
[8] M. Apidianaki, X. Tannier, and C. Richart, “Datasets for aspect-based sentiment analysis in French,” Proceedings of the 10th International Conference on Language Resources and Evaluation, LREC 2016, pp. 1122–1126, 2016.
[9] G. Kou, P. Yang, Y. Peng, F. Xiao, Y. Chen, and F. E. Alsaadi, “Evaluation of feature selection methods for text classification with small datasets using multiple criteria decision-making methods,” Applied Soft Computing Journal, vol. 86, p. 105836, 2020.
[10] D. Chehal, P. Gupta, and P. Gulati, “Implementation and comparison of topic modeling techniques based on user reviews in e-commerce recommendations,” Journal of Ambient Intelligence and Humanized Computing, no. 0123456789, Apr. 2020.
[11] A. I. Kadhim, “Survey on supervised machine learning techniques for automatic text classification,” Artificial Intelligence Review, vol. 52, no. 1, pp. 273–292, 2019.
[12] J. Hartmann, J. Huppertz, C. Schamp, and M. Heitmann, “Comparing automated text classification methods,” International Journal of Research in Marketing, vol. 36, no. 1, pp. 20–38, 2019.
[13] M. Pontiki, D. Galanis, H. Papageorgiou, S. Manandhar, and I. Androutsopoulos, “SemEval-2015 Task 12: Aspect Based Sentiment Analysis,” pp. 486–495, 2015.
[14] T. Hercigt, T. Brychcín, L. Svobodat, and M. Konkolt, “SemEval-2016 task 5: Aspect based sentiment analysis,” SemEval 2016 – 10th International Workshop on Semantic Evaluation, Proceedings, pp. 342–349, 2016.
[15] M. Al-Smadi, O. Qawasmeh, B. Talafha, and M. Quwaider, “Human Annotated Arabic Dataset of Book Reviews for Aspect Based Sentiment Analysis,” Proceedings – 2015 International Conference on Future Internet of Things and Cloud, FiCloud 2015 and 2015 International Conference on Open and Big Data, OBD 2015, pp. 726–730, 2015.
[16] A. Tamchyna, O. Fiala, and K. Veselovská, “Czech aspect-based sentiment analysis: A new dataset and preliminary results,” CEUR Workshop Proceedings, vol. 1422, pp. 95–99, 2015.
[17] M. Shaheen, “Sentiment Analysis on Mobile Phone Reviews Using Supervised Learning Techniques,” International Journal of Modern Education and Computer Science, vol. 11, no. 7, pp. 32–43, 2019.
[18] M. Al-Smadi, O. Qawasmeh, M. Al-Ayyoub, Y. Jararweh, and B. Gupta, “Deep Recurrent neural network vs. support vector machine for aspect-based sentiment analysis of Arabic hotels’ reviews,” Journal of Computational Science, vol. 27, pp. 386–393, 2018.
[19] I. Portugal, P. Alencar, and D. Cowan, “The use of machine learning algorithms in recommender systems: A systematic review,” Expert Systems with Applications, vol. 97, pp. 205–227, 2018.
[20] M. Dragoni, M. Federici, and A. Rexha, “An unsupervised aspect extraction strategy for monitoring real-time reviews stream,” Information Processing and Management, vol. 56, no. 3, pp. 1103–1118, 2019.
[21] W. M. Wang, J. W. Wang, Z. Li, Z. G. Tian, and E. Tsui, “Multiple affective attribute classification of online customer product reviews: A heuristic deep learning method for supporting Kansei engineering,” Engineering Applications of Artificial Intelligence, vol. 85, no. June, pp. 33–45, 2019.
[22] Y. Yang and X. Liu, “A re-examination of text categorization methods,” Proceedings of the 22nd Annual International ACM SIGIR Conference on Research and Development in Information Retrieval, SIGIR 1999, pp. 42–49, 1999.
[23] M. Raza, F. K. Hussain, O. K. Hussain, M. Zhao, and Z. ur Rehman, “A comparative analysis of machine learning models for quality pillar assessment of SaaS services by multi-class text classification of users’ reviews,” Future Generation Computer Systems, vol. 101, pp. 341–371, 2019.
[24] D. Vandic, F. Frasincar, and U. Kaymak, “A framework for product description classification in e-commerce,” Journal of Web Engineering, vol. 17, no. 1–2, pp. 1–27, 2018.
[25] B. Ay Karakuş, M. Talo, İ. R. Hallaç, and G. Aydin, “Evaluating deep learning models for sentiment classification,” Concurrency Computation, vol. 30, no. 21, pp. 1–14, 2018.
[26] A. P. Rodrigues, N. N. Chiplunkar, and R. Fernandes, “Aspect-based classification of product reviews using Hadoop framework,” Cogent Engineering, vol. 7, no. 1, 2020.
[27] S. A. Aljuhani and N. S. Alghamdi, “A comparison of sentiment analysis methods on Amazon reviews of Mobile Phones,” International Journal of Advanced Computer Science and Applications, vol. 10, no. 6, pp. 608–617, 2019.
[28] M. N. Imtiaz and M. K. Ben Islam, “Identifying Significance of Product Features on Customer Satisfaction Recognizing Public Sentiment Polarity: Analysis of Smart Phone Industry Using Machine-Learning Approaches,” Applied Artificial Intelligence, vol. 00, no. 00, pp. 1–17, 2020.
[29] L. Breiman, “Random Forests,” Machine Learning, vol. 45, pp. 5–32, 2001.
[30] F. Chollet, “The Sequential model.” [Online]. Available: https://keras.io/guides/sequential\_model/. [Accessed: 10-Sep-2020].
[31] A. Varghese, G. Agyeman-Badu, and M. Cawley, “Deep learning in automated text classification: a case study using toxicological abstracts,” Environment Systems and Decisions, no. 0123456789, 2020.
[32] F. Chollet, “GitHub - keras-team/keras: Deep Learning for humans.” 2015.
[33] F. Pedregosa et al., “Scikit-learn,” Journal of Machine Learning Research, vol. 12, pp. 2825–2830, 2011.
[34] A. Mueller, “scikit-learn. PyPI.” [Online]. Available: https://pypi.org/project/scikit-learn/. [Accessed: 10-Sep-2020].
Biography

Dimple Chehal is a Ph.D. student at J.C. Bose University of Science & Technology, YMCA, Faridabad, India since August 2017. She is Senior Research Fellow (SRF) under University Grants Commission’s (UGC), Ph.D. fellowship scheme. Dimple held the position of Systems Engineer at Tata Consultancy Services Private Ltd, India. Her Ph.D. work centers on review based recommender system in the e-commerce domain and current research interests include Data Mining, Natural Language Processing and Machine Learning.

Parul Gupta is an Associate Professor at Department of Computer Engineering, J.C. Bose University of Science & Technology, YMCA, Faridabad, India. She has teaching experience of over 17 years. In 2013, she received her Ph.D. from MDU Rohtak. She has published more than 25 research papers in reputed international journals and conferences. Her research interests include Data Mining, Information Retrieval, Databases and Sustainable Smart Cities.

Payal Gulati is an Assistant Professor at Department of Computer Engineering, J.C. Bose University of Science & Technology, YMCA, Faridabad, India. She received her Ph.D. in 2013 from Maharishi Dayanand University, Rohtak, India and has over 14 years of experience. She has contributed more than 30 papers in reputed journals and conferences. She is also a reviewer in Springer and Oxford journals. Her subject of interests includes Data Mining, Information Retrieval, Predictive Analysis, Energy Research and Sustainable Smart Cities.
Journal of Web Engineering, Vol. 21_2, 145–178.
doi: 10.13052/jwe1540-9589.2122
© 2021 River Publishers