Auto-Extraction and Integration of Metrics for Web User Interfaces
Maxim Bakaev1, Sebastian Heil2, Vladimir Khvorostov1 and Martin Gaedke2
1 Novosibirsk State Technical University, Novosibirsk, Russia
2 Technische Universität Chemnitz, Chemnitz, Germany
E-mail: bakaev@corp.nstu.ru; xvorostov@corp.nstu.ru; sebastian.heil@informatik.tu-chemnitz.de; martin.gaedke@informatik.tu-chemnitz.de
Received October 2018;
Accepted February 2019
Abstract
Metric-based assessment of web user interface (WUI) quality attributes is shifting from code (HTML/CSS) analysis to mining webpages’visual representations based on image recognition techniques. In our paper, we describe a visual analysis tool which takes a WUI screenshot and produces structured and machine-readable representation (JSON) of the interface elements’ spatial allocation. The implementation is based on OpenCV (image recognition functions), dlib (trained detector for the elements’ classification), and Tesseract (label and content text recognition). The JSON representation is used to automatically calculate several metrics related to visual complexity, which is known to have major effect on user experience with UIs. We further describe a WUI measurement platform that allows integration of the currently dispersed sets of metrics from different providers and demonstrate the platform’s use with several remote services. We perform statistical analysis of the collected metrics in relation to complexity-related subjective evaluations obtained from 63 human subjects of various nationalities. Finally, we build predictive models for visual complexity and show that their accuracy can be improved by integrating the metrics from different sets. Regressions with the single index of visual complexity metric that we proposed had R2=0.460, while the best joint model with 4 metrics had R2=0.647.
Keywords: Automated metrics, HCI Vision, web design mining, visual complexity.
1 Introduction
Web Engineering sees a growing need for automatically assessing quality attributes of web user interfaces (WUIs), such as usability [1], accessibility1, HTML and CSS correctness2, aesthetic attractiveness for target users [2, 3], clutter perception [4], trustworthiness, etc. The long-established reliance on real users, experts or specialists is not always the most effective way, especially if the assessments are needed quickly and in great numbers. Particularly, this is the case for optimization-based UI engineering that is currently gaining momentum [5] and which is founded upon user behavior models. With them, repeated assessment of the candidate UI designs would be unfeasible via interactive means only (i.e., made by humans), so predictions of their quality can be made based on measurable characteristics designating the considered UI, popularly called the metrics [6]. For conventional “hand-made” web design, automated WUI assessment promises lower costs, reduction of human expertise needed, better consistency and coverage, capability to promptly evaluate different design versions, etc. [7].
Code analysis techniques are established in WUI assessment and certain user- and task-independent quality attributes are now addressed by them reasonably well. However, a code that is accessibility-compliant and free of “bad smells” does not necessarily result in high quality-in-use for the WUI. The “static analysis” approach does not work well for quality dimensions that relate to actual user experience (UX): new visitors grasping the website design, users moving between UI elements to perform their tasks, etc. To investigate e.g. web page layout, spatial allocation of UI elements, or appropriateness of graphical content, an exclusively code-based analysis tool would have to incorporate a web browser’s rendering engine. So, UI analysis and mining see increasing application of computer vision techniques that guarantee that the analyzer deals with the same interface that the user experiences, whereas HTML/CSS code can be rendered differently in different browsers and environments.
1.1 The HCI Vision Approach
A basic computer vision task is image recognition, which is identification of visual objects and their classification into known subsets (object types). The identification is carried out through image segmentation or discovery of shapes, based on detection of edges, surfaces or textures, etc. Visual analysis of UIs based on computer vision techniques, which we call human-computer interaction (HCI) vision, has certain particular features compared to other application domains. Those that make the analysis easier include:
- absence of noise, glare, or difference in lighting;
- perfect angle of view;
- no need to consider movement;
- mostly complete, not partially covered objects.
Arguably, the main challenge is visual variability within WUI elements types due to different design styles, e.g., even whitespace is rarely white in webpages.
For UI visual analysis, template-matching based recognition, e.g., with the popular and free OpenCV library, is probably the most straightforward approach, but it’s relatively slow. An influential novation in the field was the VIPS (VIsion-based Page Segmentation) algorithm for detection of webpage layout structure based on its visual representation [8]. It inspired the potent Bento/Bricolage solution for semantic page segmentation and design mapping, in which image analysis is primary and supplemented by DOM [9]. Indeed, most recent techniques combine the two approaches: visual analysis and code mining [10]. This combination both allows to better cover the diverse quality attributes and to increase performance (e.g. extracting textual content without the “costly” recognition stage [11]). The analysis results are generally reverse-engineered interface semantics represented as DOM-like tree or spatial graph [12] or popular interface metrics: related to content, colors or visual complexity [13], the latter being one of the most investigated metrics in UI analysis.
1.2 Measuring Visual Complexity
It has already been established in HCI that perceived UI visual complexity significantly affects not just cognitive load, but also user preferences, aesthetic and other affective impressions (see [13–16]). At the same time, it has been shown that visual complexity is not universal – i.e. the factors that affect it depend of the particular object [17]. In [18], the GUI visual complexity determinants were specified as information amount, information organization and information discriminability, resulting in metrics of visual clutter, symmetry, contour density, figure-ground contrast and color variability. In one of our previous works, we similarly justified the factors as: the number of objects (UI elements), their diversity, and the regularity of their spatial allocation [19]. It should be noted that automatical assessment of the later is most challenging – Algorithmic Information Theory relates it to Kolmogorov’s complexity, so compression algorithms (e.g. JPEG) are popularly used for approximation.
Nowadays, the greatest part of complexity related research works arguably focus on images, introducing computerized measures for predicting their complexity [14], using it to classify the images by types [20] as well as for other purposes. However, the findings in this domain are not directly applicable to user interfaces, and currently a universally accepted technique for measuring UI visual complexity is lacking [21], although their development is largely seen as desirable [22]. In [23] and [24] the authors proposed formulas as well as developed software tools for calculating the UI complexity values. In [18] they devised automatic metrics based on visual complexity determinants known from psychology, which were largely included in the extended set operationalized in Aalto Interface Metrics (AIM) [21] that particularly include the Perceptual Fluency category as corresponding to visual complexity. All in all, the intensifying research that is “fragmented across disciplines, UI types, data formats, and research groups” [21], has delivered quite a large number of metrics with varying relevance and predictive power. They are currently scattered across different sets and algorithms, some of which also involve metrics for adjacent quality attributes, especially aesthetics.
1.3 Research Problem
In our paper (that extends previous work [25]) we describe both implementation of our own web UI visual analyzer tool (VA) and the platform we developed for integrating the metrics from different providers. We also demonstrate how the WUI metrics extracted with the novel HCI Vision approach can be useful in predicting users’perception of visual complexity. To that end, we performed experimental survey sessions with 63 participants of different nationalities who supplied their subjective evaluations. In Section 2 we provide conceptual and technical details on our VA tool, describe the architecture of the proposed WUI measurement platform, and introduce some external services it integrates to obtain more metrics. We also outline the details of the survey in which the participants evaluated 21 university websites. In Section 3 we explore and validate the metrics collected with the platform and use them to construct linear regression models with subjective complexity evaluations as dependent variable. In the final section we discuss the results of the statistical analysis and provide conclusions on the considered tools and metrics, as well as list contributions and limitations of our current research work.
2 Methods and Tools
In this chapter we first describe the Visual Analyzer tool that we developed for extracting WUI metrics through the HCI Vision approach [25] and applied for analysis of visual complexity. However, a single solution can hardly cover the numerous WUI metrics which keep emerging and being validated by researchers and designers. Thus, further we describe the WUI measurement platform capable of integrating metrics from different providers, and specify the additional metrics that we obtained from them.
2.1 The Visual Analyzer
As shown in Figure 1, our UI analysis architecture consists of two parts: the Analyzer Frontend and the Visual Analysis backend. The Analyzer Frontend is a Web Application (http://va.wuikb.online) that communicates with the Visual Analysis Backend, implemented as Web Service, via an HTTP Interface.
Our visual page analysis algorithm is founded on [12]: it takes a screenshot of a user interface as input and tries to identify the UI elements of which the interface is formed. Based on the “atomic” UI elements, higher-level structures can be identified through analysis of the visual hierarchy of the interface, using closeness, alignment, containment etc. The core part of the analysis process is the visual analysis of a screenshot of the user interface. If the user interface is a web user interface, additional DOM analysis based on the HTML/CSS source code can be made (cf. [9]). The visual analysis, however, is independent of the source code. It uses visual input only, i.e. a screenshot of the user interface. In the following, we outline the visual analysis steps and the artifacts which are produced throughout the process.

Figure 1 Overview of the analysis process.
2.1.1 Preprocessing
To improve the edge detection results, preprocessing of inputs into black-and-white inputs is required. Those images are represented as binary matrices. To achieve this input, the screenshot is converted to grayscale. The binary image is then produced using a threshold function. Due to the relatively low amount of color in user interfaces compared to general images, separate binary images from different color channels are not providing significant improvements to subsequent processing. Upscaling before conversion to black-and-white has shown to improve detection rate significantly. We are using the respective OpenCV3 functions to perform this step (a more detailed description of the preprocessing can be found in [26]).
2.1.2 Detection of rectangular areas
In order to identify UI elements like frames, buttons or textboxes, this step detects rectangular areas of interest. This is done using OpenCV’s edge detection for horizontal and vertical lines on the binary matrix. The resulting list of vectors is then checked for rectangles by looking for convex shapes with 4 corners above a minimum size. The result is a list of 4-tuples r = (x, y, width, height).
2.1.3 Optical character recognition (OCR)
To identify text in the UI, we use a combination of OpenCV’s close-edge detection and Tesseract4. First, areas with close edges are identified as candidates. These areas are then upscaled and converted to black edges on white background. If Tesseract yields a result on the snippets, they are considered as text. The bounding rectangles are annotated with the textual content and added to the previous list of rectangles.
2.1.4 Detection of special UI element types
This step uses specialized detectors for different types of UI elements (e.g. radiobuttons, checkboxes, dropdown menus). The detectors are trained on one particular type using supervised learning with the Felzenszwalb HOG feature extractor implemented in dlib5. Radiobuttons and checkboxes in checked and unchecked state have to be separately trained. Training datasets have to represent different styles of UI elements, e.g. Windows and MacOS styles. For native operating system style UI elements, the datasets can be very small whereas for WUIs with various CSS styles, larger datasets are required. The detected UI elements are added to the previous list as bounding rectangles with annotated type (Figure 2 shows visualized results of this step for a simple desktop UI).
2.1.5 Analysis of composite structures
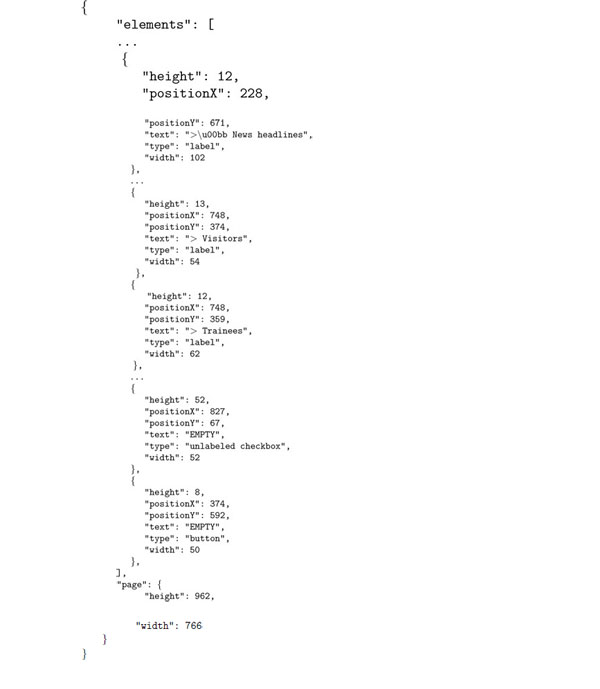
In this step, composite structures are identified based on the untyped rectangles and text fragments detected in previous steps using decision tree rules. Text fragments are classified as label according to proximity to other objects, word if isolated, line if min. five horizontally neighboring words with equal vertical alignment exist, and text of min. 2 lines in vertical proximity. Labeled/unlabeled buttons, dropdowns and textfields are identified combining the text and object locations. Areas are detected as rectangles containing other UI elements (Figure 3 shows visualized results of this step for a real web interface). The identified UI elements and structures are represented as JSON in the HTTP API.
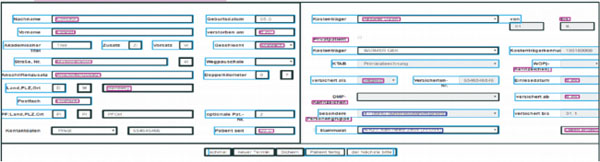
Figure 2 Outline of a desktop user interface with detected UI elements of different types.
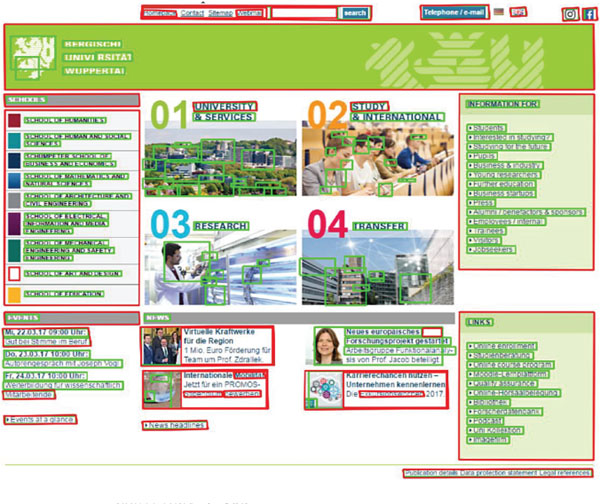
Figure 3 A web interface screenshot with UI elements recognition results highlighted (in the visual analyzer).
Below we present an extract from the JSON output for the WUI shown in Figure 3:
2.1.6 Results aggregation and the metrics representation
The VA frontend aggregates the visual analysis results with the results from DOM analysis and calculates several metrics for the UI. The first group includes the 4 metrics related to visual complexity:
- The number of all identified UI elements (relates to structural complexity of the UI): VA_Elements. In contrast to elements in DOM analysis, it is agnostic to programming styles and invisible HTML elements, representing only elements that are visible to users.
- The number of different elements types identified by the analyzer (indicator of the UI’s diversity): VA_Vocab.
- Compression rate VA_Compress reflects UI’s spatial regularity and is calculated as the area S0 (in pixels) of the webpage divided by the file size F (in bytes) of the screenshot compressed using the popularly employed JPEG-1006 algorithm:
- The “index of visual complexity” VA_IVC is a derived metric based on our earlier works (e.g. [19]). It incorporates both information content (VA_Elements and VA_Vocab) and spatial regularity component (VA_Compress):
The other 3 “areal” visual analyzer’s metrics characterize relative (i.e. divided by S0 ) shares of the areas in the UI covered by the different types of UI elements:
- Textual content, i.e. area under all elements recognized as textline: VA_Text.
- Graphic and mixed content, i.e. area under all elements of the other types: VA_Other.
- Whitespace, i.e. all remaining pixels: VA_White.
2.2 The WUI Measurement Platform
To allow extending the set of web UI metrics supplied by different providers, we designed and implemented an integration platform capable of working with various remote services. WUI screenshot or website URI is sent to a remote service using its supported method (protocol), the metrics and other output (e.g. the JSON representation in case of our visual analyzer) are received and saved in the platform’s database. The platform can be accessed through a repository of web projects in our dedicated “WUI knowledge portal” (http://wuikb.online). The scheme for the platform is shown in Figure 4 (the visual analyzer’s backend is provided by TU Chemnitz), while some highlights from the platform’s database structure are presented in Figure 5.
Particularly, the Metric group entity allows organizing the metrics by specifying categories like complexity-related, color-related, accessibility-related, etc. In the Remote service entity, ClassName is used to reference the class implementing the interface for working with a specific service (e.g. class AIMService implements RemoteService). The other entities are rather self-explanatory. We would like to specially note that the platform’s architecture allows integration of services supplying WUI metrics based on code analysis as well.
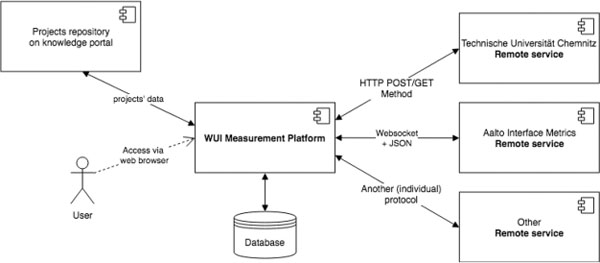
Figure 4 The scheme for the WUI measurement platform.
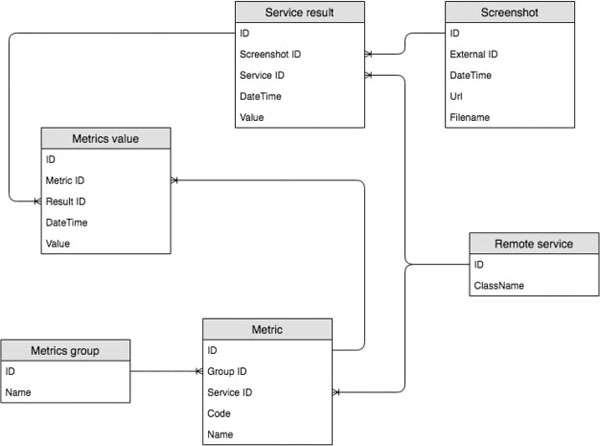
Figure 5 The scheme for the WUI measurement platform.
2.3 Remote Services for WUI Metrics
As the major remote service providing additional metrics, we used the Aalto Interface Metrics (AIM), which has been launched recently (http://userinterfaces.aalto.fi/). Their source code is open and free for use (as per MIT License), so we were able to run the service on our mirror server and use it for processing our WUI screenshots. In Figure 6 we show the visualized results of the recognition (cf. Figure 3).
Below we list the metrics of the complexity-related Perceptual Fluency category in AIM. We supply the descriptions provided by the service or in [21] and denote the names for the independent variables corresponding to the metrics.

Figure 6 A web interface screenshot with UI elements recognition results highlighted (in AIM service).
- Edge Density: “It is computed as the ratio of pixels that align with an edge as compared to the total number of pixels in the image.” AIM_EDens
- Edge Congestion: “Number of congested pixels divided by number of all edge pixels.” AIM_ECong
- JPEG File Size (in bytes): The original image is resized to 1280 pixels width at 72 dpi. No JPEG compression parameters are disclosed by the service. AIM_JPEG
- Figure-Ground Contrast: “Weighted sum of edge pixels divided by sum of edge pixels.” AIM_FGCon
- Pixel/Normalized Symmetry: “Ratio of edges that are mirrored either horizontal, vertical, or diagonal.” AIM_PixSym
- Quadtree decomposition that “recursively breaks down the image into regions based on entropy in color and luminance channels” is performed for several metrics (exact formulas for them are not specified):
- “distribution of optical weight in a picture.” AIM_Balance
- “axial duplication”, vertical or radial. AIM_Symm
- “stabilization, midway centre of suspension.” AIM_Equil
- “the total amount of leaves at the end of recursion.” AIM_Leaves
- Whitespace: “Proportion of whitespace.” AIM_White
- Number of Alignment Lines: “Grid quality indicates the internal alignment of the various components or identifiable regions of the UI with respect to each other.” AIM_Lines
As an additional remote service, we employed MATLAB, which can evaluate functions on remote servers using RESTfulAPI and JSON representation of MATLAB data types7. Particularly, we used entropy(I) function that returns a scalar value reflecting the frequency-based entropy of grayscale image I: M_Entropy.
2.4 Subjective Evaluations
As described in [25], we undertook an experimental survey to collect subjective evaluations for homepages of several operational websites, per dimensions related to visual complexity. Since providing the evaluations in absolute numbers would be unattainable for the participants who were not web design professionals, we chose to rely on ordinal values. For each of the following statements, 7-point Likert scale was used (1 being “completely disagree”, 7 – “completely agree”), resulting in the respective ordinal variables:
- “This webpage has many elements.” SElements
- “The elements in the webpage are very diverse.” SVocab
- “The elements in the webpage are well-ordered.” SOrder
- “The webpage has a lot of text.” SText
- “The webpage has a lot of graphics.” SImg
- “The webpage has a lot of whitespace.” SWhite
- “The webpage appears very complex.” SComplex
The material for the evaluation was 21 operating websites of 11 German universities and 10 Russian ones (in all cases, English versions were used). The websites for the experiment were manually selected, with the requirements that 1) the universities are not too well-known, so that their reputations do not bias the evaluations; 2) the designs are sufficiently diverse in terms of layout, colors, images, etc. More details on the 21 employed university websites can be found in [27].
In total, 63 participants (30 male, 33 female) provided their evaluations of the websites. The convenience sampling method was applied, with most of the participants being students or universities staff members. The self-denoted age ranged from 19 to 72, mean 27.6, SD=8.07. The self-denoted nationalities were Russian (65.1%), German (17.5%), Argentinian (4.8%), and others (including Bulgarian, Vietnamese, Korean, etc.). Submissions by another 13 participants were discarded as being incomplete (none of them had at least 50% of websites evaluated).
The survey to collect data was implemented using LimeSurvey, and the participants used a web browser to interact with it. Some of them worked in university computer rooms, while the others used their own computer equipment with varying screen resolutions, to better represent the real context of use. Each subject was asked to evaluate the screenshots of the 21 websites’ homepages (presented one by one in random order) per the 7 subjective scales. On average, it took each participant 30.3 minutes to complete the survey, and the data collection session lasted 19 days overall. We used screenshots, not the actual websites, to ensure uniformity of the experimental material between the participants and with the metric-extracting remote services.
3 Analysis and Results
Our subsequent analysis was focused on the following goals:
- general assessment of the metric’s usefulness;
- validation of our visual analyzer’s output and identification of directions for the tool’s improvement;
- finding out if existing sets of metrics are “self-sufficient” in terms of predicting visual complexity or if better results could be achieved through their integration in our WUI measurement platform.
3.1 Descriptive Statistics
In total, 9261 subjective evaluations were collected, of which 95.2% were considered valid; one website (#14) was removed from the analysis due to technical problem with the screenshot. The evaluations were averaged for each website8. Table 1 presents the descriptive statistics for all the variables we used.
Since AIM_Equil was consistently equal to 1 for all the websites, it was excluded from further analysis. The Shapiro-Wilk tests suggested that for SWhite (p=0.01), SElements (p=0.05) and SOrder (p=0.05) the normality hypotheses had to be rejected. Thus, to measure associations between the metrics and the subjective evaluations, we used Kendall’s tau-b, as non-parametric statistic (without assumption of normality) for ordinal scales.
3.2 Analysis of Correlations
For the subjective evaluations, significant correlations with SComplex were found for SElements (τ18=0.582, p<0.001) and SVocab (τ18=0.440, p=0.007), while SOrder (τ18=−0.299, p=0.068) was correlated with SComplex at α=0.07.
Further, we specially analyzed correlations for conceptually related metrics from different providers (since they were of ratio scale, Pearson correlations were used):
- VA_White – AIM_White: the correlation was significant, r18=−0.473, p=0.035;
- VA_Elements – AIM_Leaves: the correlation was not found to be significant, r18=0.315, p=0.176;
Table 1 The descriptive statistics for the variables (metrics and subjective evaluations)
| Variable | Range | Mean (SD) |
| VA_Elements | 19–157 | 68.45 (37.19) |
| VA_Vocab | 3–8 | 5.60 (1.429) |
| VA_Compress | 1.19–3.18 | 2.195 (0.558) |
| VA_IVC | 21.52–259.21 | 89.30 (47.84) |
| VA_Text | 0.01–0.23 | 0.048 (0.052) |
| VA_Other | 0.00–0.08 | 0.040 (0.021) |
| VA_White | 0.77–0.98 | 0.912 (0.048) |
| AIM_EDens | 0.08–0.28 | 0.129 (0.049) |
| AIM_ECong | 0.24–0.44 | 0.343 (0.068) |
| AIM_JPEG | 123513–553785 | 335104 (122378) |
| AIM_FGCon | 0.79–1.25 | 1.044 (0.093) |
| AIM_PixSym | 0.29–0.92 | 0.664 (0.15) |
| AIM_Balance | 0.56–0.95 | 0.796 (0.129) |
| AIM_Symm | 0.49–0.63 | 0.568 (0.044) |
| AIM_Equil | 1.0–1.0 | 1.0 (0.0) |
| AIM_Leaves | 1759–12523 | 7432 (2948) |
| AIM_White | 0.00–0.76 | 0.511 (0.189) |
| AIM_Lines | 20–575 | 223.8 (123.2) |
| M_Entropy | 2.04–6.59 | 4.03 (1.14) |
| SElements | 2.94–5.81 | 4.59 (0.94) |
| SVocab | 2.78–5.21 | 4.18 (0.77) |
| SOrder | 2.84–5.18 | 4.31 (0.50) |
| SText | 2.65–6.21 | 3.92 (0.99) |
| SImg | 2.27–5.81 | 4.00 (1.17) |
| SWhite | 2.46–6.13 | 3.51 (0.88) |
| SComplex | 2.57–5.83 | 3.60 (0.75) |
- VA_Compress – AIM_JPEG – M_Entropy : the only significant correlation was found at α=0.08, between VA_Compress and M_Entropy, r18=−0.409, p=0.073.
In Table 2, we show all correlations with τ18 ≥ 0.3 (α=0.06) between the subjective evaluations and the metrics. This does not imply “hunting for significance” given so many pairs of variables – the goal is to explore and compare the considered WUI metrics. In each group, we highlight the metrics with the strongest correlation with each subjective evaluation (for M_Entropy, we highlight correlation if it is stronger than the respective correlations for the other groups).
Table 2 The correlations between the metrics and the subjective evaluations
| SElements | SVocab | SOrder | SText | SImg | SWhite | SComplex | |
| VA_Elements | τ=0.526 | τ=0.501 | τ=0.347 | τ=0.307 | |||
| p=0.001 | p=0.002 | p=0.032 | p=0.06 | ||||
| VA_Vocab | |||||||
| VA_Compress | τ=0.347 | ||||||
| p=0.032 | |||||||
| VA_IVC | τ=0.621 | τ=0.575 | τ=0.421 | τ=0.423 | |||
| p<0.001 | p<0.001 | p=0.009 | p=0.009 | ||||
| VA_Text | τ=−0.322 | τ=0.495 | τ= | ||||
| p=0.048 | p=0.002 | p=0.003 | |||||
| VA_Other | |||||||
| VA_White | τ=0.421 | τ=0.491 | τ=−0.379 | τ=0.600 | τ=−0.337 | ||
| p=0.009 | p=0.003 | p=0.019 | p<0.001 | p=0.038 | |||
| AIM_EDens | |||||||
| AIM_ECong | τ=0.488 | τ=−0.411 | τ=0.345 | ||||
| p=0.004 | p=0.014 | p=0.039 | |||||
| AIM_JPEG | τ=0.558 | τ=0.565 | τ=0.505 | τ=−0.326 | |||
| p=0.001 | p=0.001 | p=0.002 | p=0.044 | ||||
| AIM_FGCon | τ=0.361 | ||||||
| p=0.029 | |||||||
| AIM_PixSym | |||||||
| AIM_Balance | τ=0.422 | τ=0.354 | τ=−0.394 | τ=0.555 | τ=−0.555 | ||
| p=0.011 | p=0.033 | p=0.017 | p=0.001 | p=0.001 | |||
| AIM_Symm | τ=0.336 | τ=−0.561 | τ=0.550 | τ=−0.440 | |||
| p=0.045 | p=0.001 | p=0.001 | p=0.009 | ||||
| AIM_Leaves | τ=0.358 | τ=0.427 | τ=0.453 | τ=−0.358 | |||
| p=0.027 | p=0.009 | p=0.005 | p=0.027 | ||||
| AIM_White | τ=−0.413 | τ=−0.525 | τ=−0.353 | τ=0.328 | τ=−0.635 | τ=0.593 | |
| p=0.011 | p=0.001 | p=0.032 | p=0.044 | p<0.001 | p<0.001 | ||
| AIM_Lines | |||||||
| M_Entropy | τ=0.364 | τ=0.372 | τ=−0.474 | τ=0.505 | τ=−0.453 | ||
| p=0.025 | p=0.023 | p=0.004 | p=0.002 | p=0.005 |
From the above table, we can note that some of the metrics, such as VA_Vocab, VA_Other, AIM_EDens, AIM_PixSym, and AIM_Lines, do not have significant correlations with any of the subjective evaluations considered in the current work. However, it does not necessarily mean they should be excluded from further analysis, especially since that very few metrics were significantly correlated with SComplex. Instead, appropriate statistical methods are to be used to reduce the number of factors, provided the sample size in our study (N=20) was rather limited.
3.3 Models for Complexity
In our study, comparing models for complexity with different factors was intricate due to relatively small number of evaluated websites. Particularly, Akaike information criterion (AIC) could not be applied, as the number of factors was not considerably lower than the sample size. Hence, in the analysis we relied on the significance of the independent variables and on adjusted R2 for the models.
As baseline, we constructed the linear regression model9 for SComplex with the AIM_JPEG factor, since the corresponding metric is known to predict subjective complexity well for photographic images. The factor was significant at α=0.08 (t18=1.861, p=0.079), but the regression (F1,18=3.462) had relatively low R2=0.161 (adjusted R2=0.115):
The regression analysis for SComplex with the 7 visual analyzer metrics using Backwards selection method (entry 0.05, removal 0.1) yielded the model with the only significant factor, VA_IVC (t18=3.915, F1,18=15.326, p=0.001, R2=0.460, adjusted R2=0.430):
The regression analysis for SComplex with the 10 AIM metrics using Backwards selection method (entry 0.05, removal 0.1) yielded the model with the 3 factors: AIM_Lines (t16=4.353, p<0.001), AIM_White (t16=−3.044, p=0.008), AIM_Balance (t16=-2.046, p=0.058). The model was highly significant (F3,16=7.157, p=0.003) and had improved R2=0.573 (adjusted R2=0.493):
The regression with the M Entropy metric turned out not to be significant (F1,18=0.228, p=0.639, R2=0.013).
To construct the joint model for SComplex, we used the same Backwards selection method (entry 0.05, removal 0.1) for all the 18 metrics, which resulted in 4 remaining factors: AIM_Lines (t15=4.8, p<0.001), AIM_White (t15=−2.777, p=0.014), AIM_Balance (t15=−2.031, p=0.06), A_Compress (t15=−1.768, p=0.097). The model was highly significant (F4,15=6.862, p=0.002) and had even higher R2=0.647 (adjusted R2=0.552):
Hence, the model with the highest adjusted R2=0.552 was the one based on the metrics collected from several providers. For this model, the Durbin-Watson statistics was equal to 1.702, which implies low autocorrelation in the residuals.
4 Discussion and Conclusions
Web pages are increasingly produced by web engineering frameworks and content management systems, so “static” analysis of their HTML/CSS code can discover fewer problems than before. Correspondingly, WUI visual appearance analysis techniques gain popularity, as they allow assessment of quality-in-use that is associated with user experience. The number of relevant services is growing, and we feel there is a need for a meta-tool capable of integrating diverse WUI metrics from different providers. In our current article we described our own visual analysis tool and demonstrated how it can work as one of the remote services within the developed WUI measurement platform. The proposed architecture of the platform supports both code-based and image-based WUI analysis, while the interfaces for the remote services can be supplied by outside contributors. We see the main use cases for the platform as the following:
- making well-justified comparisons between different versions of WUI design in a web engineering project (the platform saves the metrics resulting from each assessment);
- predicting usability/UX quality without actual interactions (within the so-called metric-based approach [28]);
- supplying the metrics for user behavior models, e.g. for calculating fitness functions in optimization-based UI design;
- searching in design/template collections based on specified target values for metrics;
- retrieving design examples from case bases, using similarity measures between different WUI designs, etc.
To study the metrics from the several sets (VA, AIM’s Perceptual Fluency, and MATLAB’s entropy) collected by the platform from the considered services, we matched them with the impressions of 63 human subjects who evaluated 21 university websites. The results of the correlations analysis suggest that our visual analyzer tool can provide good estimation for the number of elements, as it was relatively strongly correlated with the corresponding subjective evaluation (τ =0.526, p=0.001). VA_Elements was also correlated with the overall subjective complexity at α=0.06 (τ =0.307), but the strongest correlation with SComplex was found for the index of visual complexity (τ =0.423, p=0.009) – the derived metric that we proposed based on our previous theoretical results [19]. At the same time, the visual analyzer was so far flawed at determining the types of UI elements (VA_Vocab) and rather poor in the aerial metrics, except for the area under textual content (VA_Text), whose correlation with the corresponding subjective evaluation was significant (τ =0.495, p=0.002).
In the metric sets provided by other services, AIM_White was strongly correlated with SWhite (τ =0.635, p<0.001), and also had significant correlation with nearly all other subjective evaluations. The widely recognized JPEG-based compression measure (AIM_JPEG) had shown the highest correlation both with the WUI information content (VA_Elements, τ =0.558, p=0.001) and its diversity (VA_Vocab, τ =0.565, p=0.001), although not with orderliness. Actually, SOrder turned out to be the most evasive of the considered subjective impressions, and unexpectedly had the highest correlation with the otherwise mediocre M Entropy (τ =0.372, p=0.023). The finding may call for additional study, since this metric calculated from MATLAB’s entropy(I) function does not consider the spatial allocation of the image elements whatsoever. Our cross-analysis of similar metrics provided by different services suggested the lack of strong correlations between them, so even VA_White and AIM_White (r=−0.473, p=0.035) should not be considered mutually exclusive.
So, in the finale of our analysis we demonstrated that better predictive models for visual complexity can be obtained through combining the metrics from different sets. The joint model (2.6) had better adjusted R2=0.552 compared to the baseline JPEG model (2.3) with adj. R2=0.115, the VA model (2.4) with adj. R2=0.430, and the AIM model (2.5) with adj. R2=0.493. We need to note that our main goal was not to build accurate predictive models, but to compare the ones constructed with different sets of metrics. Still, the R2 values are comparable to the ones obtained in some other works for UIs: e.g. in [18] they explained up to 51% of aesthetics ratings and 50% of complexity ratings. In studies of visual complexity for images, though, the predictions are generally more accurate (cf. [14]). Among the single factors, VA_IVC was found to best explain the variance in subjective complexity evaluations (46%). At the same time, AIM_Lines was the most significant one in the joint model, even though we did not find its significant correlations with any of the subjective evaluations. The analysis also suggests that AIM_White metric is preferred over its VA_White counterpart with respect to subjective perception of whitespace or complexity. So, generally use of the former may be recommended, this being a relatively rare occasion of direct comparison between different algorithms implementing a WUI metric.
To sum up, we see the main contributions of our paper as follows:
- We developed a software tool implementing WUI visual analysis and demonstrated that some of the metrics it produces (VA_Elements, VA_Text ) are characteristic of the users’ visual perception, even though there’s much room for improvement compared to some other existing tools (e.g. AIM).
- We proposed an index of visual complexity metric (2.2), which is extracted via visual analysis based on combination of informational (VA_Elements, VA_Vocab) and spatial (represented by VA_Compress) components in human perception. The statistical analysis of the data suggested its advantage over the other considered metrics in predicting visual complexity perception.
- We proposed and developed the WUI measurement platform supporting easily extendable sets of metrics for both code-based and image-based WUI analysis. We further demonstrated that visual complexity prediction accuracy can be improved by incorporating metrics from different remote services.
- We constructed a novel predictive model for WUI visual complexity (2.6), which incorporated 4 factors and explained the high variance of 64.7%.
Limitations of our study include small sample of websites and their uniform domain (university homepages). Still, some studies of subjective user impressions (e.g. aesthetics in [3]) do operate with samples of comparable size. The considered subjective impressions and the related metrics also belonged to a rather narrow group – visual complexity perception, even though this factor is believed to be important for many other dimensions of UX.
Our further work plans include enhancement of our visual analyzer in recognizing the types of UI elements, presumably thorough supplementing it with webpage code analysis (DOM). We also plan to further study information theoretic measures of visual complexity in human perception, including entropy, algorithmic complexity, and compression ratios. Finally, we are going to advance the WUI measurement platform by adding more remote services and equipping it with the survey system, so that most influential metrics across different sets could be picked automatically.
Acknowledgement
The reported study was funded by RFBR according to the research project No. 16-37-60060 mol_a_dk.
References
[1] J. Grigera, et al., ‘Automatic detection of usability smells in web applications’, International Journal of Human-Computer Studies, 97, 2017, pp. 129–148.
[2] A. Miniukovich, A. De Angeli, ‘Computation of interface aesthetics’, In Proc. of the 33rd Annual ACM Conference on Human Factors in Computing Systems, pp. 1163–1172. ACM, 2015.
[3] T. Schmidt, C. Wolff, ‘The Influence of User Interface Attributes on Aesthetics’, i-com 17, no. 1, 2018, pp. 41–55.
[4] R. Rosenholtz, Y. Li, L. Nakano, ‘Measuring visual clutter’, Journal of Vision, 7, 2, 2007, pp. 1–22.
[5] A. Oulasvirta, ‘Can computers design interaction?’, In Proc. of the 8th ACM SIGCHI Symposium on Engineering Interactive Computing Systems, pp. 1–2. ACM, 2016.
[6] M. Zen, J. Vanderdonckt, ‘Towards an evaluation of graphical user interfaces aesthetics based on metrics’, In IEEE Int Conf on Research Challenges in Information Science (RCIS), pp. 1–12, 2014.
[7] A. Dingli, J. Mifsud, ‘Useful: A framework to mainstream web site usability through automated evaluation’, International Journal of Human Computer Interaction (IJHCI), 2(1), 10, 2011.
[8] D. Cai, et al., ‘Extracting content structure for web pages based on visual representation’, In Asia-Pacific Web Conference, pp. 406–417, 2003.
[9] R. Kumar, et al., ‘Bricolage: example-based retargeting for web design’, In Proc. of the ACM SIGCHI Conference on Human Factors in Computing Systems, pp. 2197–2206, 2011.
[10] A. Sanoja, B. Gançarski, ‘Block-o-matic: A web page segmentation framework’, In Proc. IEEE Int. Conf. Multimedia Computing and Systems (ICMCS), pp. 595–600, 2014.
[11] J. Pu, J. Liu, J. Wang, ‘A Vision-Based Approach for Deep Web Form Extraction’, In Advanced Multimedia and Ubiquitous Engineering, pp. 696–702, Springer, 2017.
[12] J. Kong, et al., ‘Web Interface Interpretation Using Graph Grammars’, IEEE Trans. Syst. Man, Cybern. Part C (Applications Rev.), 42 (4), pp. 590–602, 2012.
[13] K. Reinecke, et al., ‘Predicting users’ first impressions of website aesthetics with a quantification of perceived visual complexity and colorfulness’, In Proc. of the ACM SIGCHI Conference on Human Factors in Computing Systems, pp. 2049–2058, 2013.
[14] P. Machado, et al., ‘Computerized measures of visual complexity’, Acta psychologica, 160, pp. 43–57, 2015.
[15] E. Michailidou, S. Harper, S. Bechhofer, ‘Visual complexity and aesthetic perception of web pages’, In Proc. of the 26th annual ACM international conference on Design of communication, pp. 215–224, ACM, 2008.
[16] S.E.S. Taba, et al., ‘An exploratory study on the relation between user interface complexity and the perceived quality’, In International Conference on Web Engineering (ICWE), pp. 370–379, Springer, Cham, 2014.
[17] V. Chikhman, et al., ‘Complexity of images: Experimental and computational estimates compared,’ Perception, 41(6), pp. 631–647, 2012.
[18] A. Miniukovich, A. De Angeli, ‘Quantification of interface visual complexity. In Proc. of the 2014 international working conference on advanced visual interfaces, pp. 153–160, ACM, 2014.
[19] M. Bakaev, O. Razumnikova, ‘Opredeleine slozhnosti zadach dlya zritelno-prostranstvennoi pamyati i propustkoi spospobnosti cheloveka-operatora’, Upravlenie bol’shimi sistemami = Large-Scale Systems Control, 70, pp. 25–57, 2017. – In Russian.
[20] A. Carballal, et al., ‘Distinguishing paintings from photographs by complexity estimates’, Neural Computing and Applications, 30, no. 6, pp. 1957–1969, 2018.
[21] A. Oulasvirta, et al., ‘Aalto Interface Metrics (AIM): A Service and Codebase for Computational GUI Evaluation’, In The 31st Annual ACM Symposium on User Interface Software and Technology Adjunct Proceedings, pp. 16–19. ACM, 2018.
[22] O. Wu, W. Hu, L. Shi, ‘Measuring the visual complexities of web pages’, ACM Transactions on the Web (TWEB), 7(1), p.1, 2013.
[23] K. Alemerien, K. Magel, ‘GUIEvaluator: A Metric-tool for Evaluating the Complexity of Graphical User Interfaces’, In SEKE, pp. 13–18, 2014.
[24] C. Stickel, M. Ebner, A. Holzinger, ‘The XAOS metric– understanding visual complexity as measure of usability’, In Symposium of the Austrian HCI and Usability Engineering Group, pp. 278-290, Springer, Berlin, Heidelberg, 2010.
[25] M. Bakaev, S. Heil, V. Khvorostov, M. Gaedke, ‘HCI Vision for Automated Analysis and Mining of Web User Interfaces’, In International Conference on Web Engineering (ICWE), pp. 136–144. Springer, Cham, 2018.
[26] S.T. Bow, Pattern recognition and image preprocessing. New York: Marcel Dekker, 2002.
[27] M. Bakaev, M. Gaedke, S. Heil, ‘Kansei Engineering Experimental Research with University Websites’, TU Chemnitz Technical Report, CSR-16-01, 2016.
[28] M. Bakaev, T. Mamysheva, M. Gaedke, ‘Current trends in automating usability evaluation of websites: Can you manage what you can’t measure?’ In Proc. IEEE 11th International Forum on Strategic Technology (IFOST), pp. 510–514, 2016.
Biographies

Maxim Bakaev got his PhD degree in 2012 and currently works as Associate Professor at the Automated Control Systems department of Novosibirsk State Technical University (NSTU), Russia. His research interests include Human-Computer Interaction, Web Design, User Behavior Models, and Machine Learning. He has served as reviewer for several international conferences and journals, including Large-Scale Control Systems, Algorithms, Multimodal Technologies and Interaction, etc. Under his supervision, more than 20 Master and Bachelor students graduated.

Sebastian Heil PhD student at the Distributed and Self-organizing Systems Professorship of Chemnitz Technical University, Germany. His research interests include Web Engineering, Software Migration, Crowdsourcing and Collaborative Development, Linked Open Data and Web of Things. He is a member of Institute of Systems and Technologies of Information, Control and Communication and has served as reviewer and PC member for several international journals and conferences including ACM TWEB and MONET.

Vladimir Khvorostov received his B.Sc (in 2002) and M.Sc. (in 2004) degrees in Information Systems from Novosibirsk State Technical University (NSTU), Russia. Vladimir held software developer position in 2004-2009, then Chief Engineer position in 2009-2015, and now he is individual entrepreneur in software development and Assistant Professor at NSTU. He has professional skills and wide experience in Web Programming, Software Development Management, Internet Advertising and E-Commerce.

Martin Gaedke Full Professor, chair of Distributed and Self-organizing Systems group and Vice Dean of the Department of Computer Science, Chemnitz University of Technology. His research focuses on Web Engineering, Service Engineering, and trustworthy Service-based Systems Engineering to address needs of future distributed hyper-connected collaborative work environments. He serves as invited expert for W3C’s WebID and Social Web and served as reviewer for FP7 and ERC and as member of FP7 FAST Advisory Expert Group and NMC’s Horizon.JISC Advisory Board.
Journal of Web Engineering, Vol. 17_6&7, 561–590.
doi: 10.13052/jwe1540-9589.17676
© 2019 River Publishers
1https://www.w3.org/WAI/ER/tools/ lists 122 web accessibility evaluation tools (as of Nov 2018).
2See https://validator.w3.org/ and https://jigsaw.w3.org/css-validator/
3https://opencv.org/
4https://github.com/tesseract-ocr/tesseract
5http://dlib.net/
6cf. ISO/IEC 10918-1:1994
7https://www.mathworks.com/help/mps/restful-api-and-json.html
8We must warn the reader that there is certain controversy about averaging ordinal subjective evaluations in statistics, but we decided to do so, for the sake of the analysis’s robustness.
9In our decision to use the usual linear regression for modelling complexity in our research, we are well aware that dependent variable (SComplex) is of ordinal scale. However, ordinal regression (cf. [25]) would not be robust enough, provided the number of factors and the sample size.