Internet of Things (IoTs) Security: Intrusion Detection using Deep Learning
Ozgur Koray Sahingoz1, Ugur Cekmez2,* and Ali Buldu3
1Department of Computer Engineering, Faculty of Engineering and Natural Sciences, Biruni University, Istanbul, Turkey
2Chooch Intelligence Technologies Co., California, USA
3Department of Computer Engineering, Faculty of Technology, Marmara University, Istanbul, Turkey
E-mail: ugur@chooch.ai
*Corresponding Author
Received 10 February 2021; Accepted 28 June 2021; Publication 21 September 2021
Abstract
With the development of sensor and communication technologies, the use of connected devices in industrial applications has been common for a long time. Reduction of costs during this period and the definition of Internet of Things (IoTs) concept have expanded the application area of small connected devices to the level of end-users. This paved the way for IoT technology to provide a wide variety of application alternative and become a part of daily life. Therefore, a poorly protected IoT network is not sustainable and has a negative effect on not only devices but also the users of the system. In this case, protection mechanisms which use conventional intrusion detection approaches become inadequate. As the intruders’ level of expertise increases, identification and prevention of new kinds of attacks are becoming more challenging. Thus, intelligent algorithms, which are capable of learning from the natural flow of data, are necessary to overcome possible security breaches. Many studies suggesting models on individual attack types have been successful up to a point in recent literature. However, it is seen that most of the studies aiming to detect multiple attack types cannot successfully detect all of these attacks with a single model. In this study, it is aimed to suggest an all-in-one intrusion detection mechanism for detecting multiple intrusive behaviors and given network attacks. For this aim, a custom deep neural network is designed and implemented to classify a number of different types of network attacks in IoT systems with high accuracy and -score. As a test-bed for comparable results, one of the up-to-date dataset (CICIDS2017), which is highly imbalanced, is used and the reached results are compared with the recent literature. While the initial propose was successful for most of the classes in the dataset, it was noted that achievement was low in classes with a small number of samples. To overcome imbalanced data problem, we proposed a number of augmentation techniques and compared all the results. Experimental results showed that the proposed methods yield highest efficiency among observed literature.
Keywords: Convolutional neural networks, deep learning, imbalanced datasets, Internet of Things, IoTs, web security.
1 Introduction
In recent years, there is growing attention to sensor and communication technologies. All these computing devices, independent of their capability and sizes are aimed to be executed in a connected environment with the use of the Internet of Things (IoTs) concept. The use of connected devices in a networked environment has been common for a long time especially in industrial applications. For reducing the cost and increasing the efficiency of this network, applications are expanded to be able to use small connected devices, in an IoT concept, to the level of end-users. Recently, IoT technology has become a part of daily life by providing a wide variety of application alternatives. Considering that many IoT networks are connected to the internet for varying purposes, this means that the devices, in proper circumstances, may be accessible from anywhere, anyone, and at anytime. Hence, the vulnerabilities of these devices have become a major concern in this area since they may affect the daily lives of loads of people in terms of personal information leakage and financial losses.
While traditional cyberattacks previously aimed for one-time purposes such as information leakage, financial profit, or damage to the system, today’s intruders are also able to reach higher profits and even degree-of-confidential documents on the governmental and military level while staying undetected. In 2019, CNBC reported that cyber-attacks cost companies $200,000 on average, and threats tend to go an average of 101 days staying undetected [1]. Considering the fact that WikiLeaks has access to sensitive and protected data of some governments in 2006 and the Stuxnet software disrupts Iran’s nuclear research in 2010 [2], it revealed the importance of cybersecurity and what could be the cause worldwide. This necessitated the formation of certain policies in the field of information security and cyber defense. These policies have also been tightening against increasing attacks [3, 4, 5]. Likewise as in the degree-of-confidential spaces, now IoT devices are becoming the gates between our individual internal network in our places and the outside world. In 2016, the environmental control systems (ECS) of two apartment buildings in Lappeenranta, Finland have attacked with Distributed Denial-of-Service (DDoS) method and literally left in the cold for a weekend in winter. The attack disabled the ECS in the two apartments completely [6]. In 2017, a casino in the North U.S was attacked by intruders to steal some data from a remote server in Finland. The attackers used an internet-connected smart fish tank to connect to the internal network where the tank was equipped with sensors to configure temperatures and cleanliness level of the tank [7]. In 2015 and 2016, one of the well-known car brands Jeep was hacked and its interior parts such as sensors, breaks, and steering wheel were remotely controlled by the hackers sending messages to the vehicle’s internal network known as CAN bus [8]. There are also several connected webcam related incidents reported which were about hackers taking control of the webcam at homes to spy on household [9, 10, 11]. As these are only a few examples that just happened, such incidents necessitated even the stronger and wider application area of security mechanisms. In this environment, anti-viruses, firewalls, intrusion detection, and prevention systems, and many other security mechanisms developed. These systems were used for a long time by the companies and governments to ensure the security of the network infrastructure.

Figure 1 General IoT architecture, layer threats and the risk indicator for layers.
This study primarily focuses on working with event logs of one of the widely used security mechanisms, Intrusion Detection Systems (IDSs). IDSs aim to analyze network traffic of computer devices and report any unnatural behavior within the system after all prevention mechanisms such as firewall and anti-virus software fail to block malicious attacks. These systems are equipped with many features exhibiting high performance against conventional attacks [12]. However, the defense mechanism remains weak and as flexible as the predefined and updated rules in their databases, which causes previously unseen or complex intrusion attempts to be succeeded. Despite the fact that they are being updated by the vendors, attackers can squeeze their behaviors and bypass the rules easily. At this point, some intelligent algorithms which are capable of learning from the natural flow of data, are necessary to overcome possible security breaches. Thus, Deep Learning (DL) models, without any hand-crafted touches, yield inferences from the natural flow of data and provide robust and future-proof solutions [13].
In this study, a self normalizing deep neural network (DNN) [14] including a convolutional feature extractor layer is implemented to classify network attacks with a high accuracy and -score. For reaching comparable results, one of the up-to-date network traffic datasets (CICIDS2017) is preferred and compared with the recent literature. Since this dataset includes a couple of rare samples and forms an imbalanced scenarios, the rare class samples in the dataset have been synthetically augmented by using various up-sampling methods. These methods include a custom random data generation model, SMOTEENN technique and a tabular data specific generative adversarial model (CTGAN) [15] to check whether the model performs better when data augmentation is applied to the low-accuracy classes. As a result, experimental results showed that each proposed method has its own characteristics while yielding the highest efficiency among the compared literature.
The remaining part of the paper is organized as follows. In Section 2.1, the general definition of an IoT system and its security concerns are expressed. In Section 2.2, IDSs are briefly introduced for a better understanding of the problem. In Section 3, the recent related work among the literature is discussed. Section 4 describes the overview of datasets that are used in the literature as well as the preparation for the selected dataset. In Section 5, the proposed Deep Learning model is described before conducting different augmentation techniques for performance evaluations in Section 6. Section 7 and 8 contains the discussions, future work and they also conclude the paper.
2 Background
In this section, the history of the Internet of Things concept and the definition of intrusion detection systems are explained as background information.
2.1 Internet of Things
Although the term “Internet of Things” does not have a standard definition, in general it is referred to a network which is made of uniquely identifiable physical devices called “things” [16]. These things are capable of sensing by capturing data from their environment through attached sensors, controlling and monitoring activities, processing the data to act accordingly and exchanging data with other connected devices and applications. The data processed by these devices are sent to centralized or cloud based destinations to perform some specific tasks [17].
Ranging from personal usage to very large scale industrial automation tasks, IoT applications form a reliable interaction between machines, systems and also people. Applications of IoT include but not limited to wearables, building and home automation, smart cities, smart manufacturing, healthcare, automotive and other small or large scale private and industrial needs [18]. The market where IoT systems are used is also getting larger such as transportation, computing services, retail and wholesale, banking and securities, insurance, etc [18]. According to a recent research by IoT Analytics [19], the top IoT use cases in 2020 include industrial, transportation, energy, retail, cities, healthcare, supply chain, agriculture and building applications. The underlying study explores active 1400 IoT projects from 620 IoT platforms and tells that during the COVID-19 pandemic, the use and value of some application areas such as supply chain have gained more importance.1 As the research indicates, common use cases for each application area can be summarized as follows:
• Industrial applications: Remote PLC control, automated quality control systems, equipment monitoring, production floor monitoring, wearables, etc.
• Transportation applications: vehicle diagnostic / monitoring (such as battery, tire pressure and driver monitoring).
• Energy applications: Grid optimization, remote asset monitoring, predictive maintenance.
• Retail applications: Smart vending machines, customer engagement, product and inventory monitoring, etc.
• Smart city applications: Environmental monitoring, video surveillance, traffic management
• Healthcare applications: Medical device monitoring, assisted living, wearables, etc.
• Supply chain applications: asset tracking, cold chain monitoring, inventory management, etc.
• Agriculture applications: Precision farming, area mapping, livestock monitoring, quality controlling, etc.
• Smart buildings applications: Smart home systems (lighting, alarms, security mechanisms, various sensors), building utilization, consumption monitoring, etc.
Although the technological changes caused by the pandemic process are beyond the scope of this study, IoT applications played an important role in combating the pandemic and gave researchers some impressions about how such significant events affected the use of a technology branch. As some research state, existing IoT applications started to be used for the new normality purposes. IoT smart city applications started to be used for smart scheduling in order to guide vehicle traffic and minimize large crowds. Thermal cameras located to critical points of buildings were used as instant diagnosis tools. Smart phones including specific applications marked infected people and used to track their locations in order to create a map of infection area. These applications also provided rapid identification using QR codes before letting people in the critical buildings [20]. Many hospitals started to use integrated networks inside for various purposes, such as rapid diagnosis tools which provided accurate treatments and small beepers, which were used to inform the concerned medical staff during any emergency [21].
The IoT system infrastructure is generally based on three main layers of stack. The physical perception layer is what a physical device perceives from its environment. The network layer is the combination of supported communication and connection protocols. It also defines how data is forwarded from the source to the destination. The application layer forms context-aware applications and services available to the masses [22]. This basic architecture can also be extended depending on what’s needed from an IoT system. The architecture also defines where the possible threats are located and how they impact the health of the system. Because the most of IoT devices are actually the combination of already existing technologies, the application and network layers include the communication protocols and they are used anyway regardless of the IoTs ecosystem.
There are various types of known attacks against the IoT systems. However, due to heterogeneity in IoT systems, the impact of attacks cannot be measured precisely. Thus, the establishment of security and the standardization become more challenging [23]. A typical IoT architecture including most of the possible threats for given layers and their risk degrees can be seen in Figure 1.
Regardless of small or large scale, IoT systems, which are included in daily life in many areas, have various challenges depending on what they are used for. The key challenges can roughly be described such as architecture, availability, reliability, mobility, performance, management, scalability, interoperability, security, privacy, etc. In this study, we focused on availability, privacy and information security side since these are the utmost concerns in IoTs world [23, 24, 25].
In a recent study, Tawalbeh et al. [24] stated that modern IoT systems are diverse from traditional computers which make the whole system more vulnerable to security breaches. Selamat [25] surveyed some open challenges of IoT security and categorized possible threats concerning the application area. According to research, possible threats in most cases are denial of service attacks, unauthorized access, privacy violation, eavesdropping and malicious attacks including malicious code injection. These threats directly target three key concepts of information security: confidentiality, integrity and availability of the systems. The authors of [24, 26] explain that many IoT systems, which work on a massive scale, are composed of nearly identical computing devices based on similar software and hardware components. Thus any security breach may affect a significant number of devices at the same time. Similarly, due to the irregularity of automatic interconnections between devices, the impact of any cyberattack to an IoT system also becomes unpredictable as the number of connections is unknown. That’s why if any weak link occurs in an IoT system, all the key concepts of information security becomes under the risk. Similarly, Hussain et al. [27] reviewed the security requirements and current solution approaches for IoT systems. Authors stated that many existing solutions remain insufficient to cover the entire security spectrum for these systems; however some novel machine learning approaches can leverage the solutions to some extent. The study classifies and extensively details threats into following seven categories. (1) physical attacks where attackers have access to the physical device using variable methods and is able to change device settings. (2) physical and link layer security issues of the connection protocols the devices have, as depicted on Figure 1. (3) network layer attacks including man in the middle, spoofing, data leakage and unauthorized access. (4) transport and application layer attacks where TCP and UDP protocols involve. In this layer, well-known attacks are malware attacks, DoS, DDoS, phishing, SQL injection, cross-site scripting (XSS) and Botnet. (5) multi-layered attacks including traffic analysis, side-channel, replay, man-in-the-middle and protocol attacks. (6) conventional security issues in cloud that is one of the essential parts of IoTs. (7) security issues across IoT architectures where each existing IoT module may have its own security and privacy breaches. The study then explains existing machine learning applications specifically designed for overcoming some of the previously defined threats [27].
2.2 Intrusion Detection Systems
Intrusion Detection System (IDS) is basically a security mechanism analyzing the flow of internal and external users and application in a system. IDSs aim to detect unauthorized activities and attack situations through various analyzes on the information they gather [28]. Considering the basic pipeline of security gates, the first step can be considered as authentication mechanisms for access control, such as requiring user name, password and/or signatures. The control mechanism beyond this level is particularly concentrated on firewalls where the network traffic passes through. Although the use of firewalls reduces the number of known-type attacks from outside, it is a necessity to use IDS(s) in order to detect intrusions and not to keep open doors against those may compromise the confidentiality, integrity or availability of a resource [29].
IDS can be implemented by using different approaches according to their used environment and types of prevention approaches [30, 31, 29]. The first strategy aims internal monitoring of a computer which targets to detect suspicious behavior of applications installed, which is called as host-based IDS. The second strategy is to look after the network of computers where the IDS constantly checks whether there exists unauthorized patterns of inbound or outgoing packets on LAN. Such systems, called as network-based IDS, may not be effective against a number of attack types such as Denial of Service (DoS). Another kind of IDS, called as signature-based IDS, works perfect with its database including rules and signatures. These kind of IDSs are able to detect the vulnerabilities that are previously known. Because of lacking security over rules and signatures, an anomaly-based IDSs come to the stage to figure out previously unknown attack types by analyzing the usage patterns the underlying system generates. With this way, it starts to be easier to detect new kinds of attacks since it does not heavily depend on any pre-defined rule or signature. Considering that the IDS learns the underlying system, it may have little hard time to learn the system and give high rate false positives during the learning phase.
Because the intruders keep developing comprehensive attacks today, conventional IDSs using pre-defined and flexible rules and signature-based approaches [32] remain inadequate. Intruders do not inherit from known signatures and constantly generate updated or new types of signatures [33, 34] on top of present rules of IDSs. For this reason, IDSs, which have been strengthened by machine learning in recent years, can associate historical data and user and application behaviors with each other. Thus they are able to make deductions from these information combined. Conventional machine learning approaches are especially used in the training phase of what is anomalous behavior and what is not. In this way, IDSs can differentiate how normal data is defined [35]. Along with catching unseen signatures and defining them as an “unknown attack” by studying the previously labeled normal data, machine learning and deep learning techniques are well suited for directly classifying the type of signatures. Even if the traces are different from known types, the models become successful when sufficient data is provided.
In this study, it is aimed to approach on catching and classifying the attacks from IDS data rather than only applying anomaly detection.
3 Related Work
For almost a decade, Deep Learning based approaches have been providing robust and ground-breaking results in many fields as big data and other hardware related technologies are continuously improved. As the IoT network produces big data by nature, it has become one of the popular areas deep learning. However, depending on the case, the data generated here may not be equally disassembled. Such as occurred in CICIDS2017, many real world problems include imbalanced data and it contradicts with the requirements of many DL concepts where the data should be equally distributed. Considering this, many recent research using this dataset focused on only specific types of attacks instead of providing one network for fifteen classes. In this literature review, only the recent research working with CICIDS2017 dataset have been examined. In the literature there a some works on the IDS systems, and only a few of them are directly focused on IoT devices. In this section, it is aimed to give some important works in this area.
Some researchers focused on the detection of a specific attack only. Roopak et al. proposed a deep learning model for detecting DDoS attacks on IoT networks. Their intention was to raise an awareness in IoTs area and touch upon the open research challenges in cyber security field. They applied Multi Layer Perceptron, Convolutional Neural Networks (CNN), Long Short-Term Memory Units (LSTM) and a hybrid CNN+LSTM model to describe DDoS attacks. Findings showed that their hybrid model outperforms the other models as well as conventional machine learning techniques such as Support Vector Machines, Naive Bayes (NB) and Random Forest (RF). They reached the highest accuracy level as 97.15% [36].
Faker and Dogdu proposed DNN and ensemble methods, RF and Gradient Boosting Tree, to classify attacks. They also divided the dataset into fourteen (the number of attacks) subsets by applying feature ranking with K-Means and using homogeneity metric. With this way, all the subsets only include the corresponding attack and benign labels and all the features in each subset are ranked and sorted from highest to lowest homogeneity score. After the scoring phase, the lowest scored features are deleted. The highest accuracy they provided is 99.56% for their selected features and the same accuracy for full dataset [37].
Hossain et al. stated that Brute-Force attacks (BFA) are one of the incurable attack types when an invader has an access to a network. They surveyed recent literature those used various techniques to detect BFA and investigated SSH and FTP Brute-Force attacks of CICIDS2017 as their use case. Since the use case was only for BFA, only Tuesday and Thursday data is used from the dataset. In the study, LSTM and other conventional machine learning techniques such as RF, NB, K-Nearest Neighbor are used and the results are showing that LSTM outperforms the other classifiers with 99.88% accuracy for Tuesday dataset and 99.86% for Thursday dataset. As the study shared their precision and recall values in detail, the -score of the study is 0.99% for FTP-Patator, 0.97% for SSH-Patator, 0.19% for Web Attack Brute-Force, 0% for Web Attack SQL Injection and 0.03% for Web Attack XSS. It seems that the model works well with Tuesday data but does not yield a good performance with Thursday dataset because of having low recall and thus low -score [38].
Pelletier and Abualkibash evaluated the CICIDS2017 and stated that imbalanced classes makes it harder to work with the dataset itself. Yet they pre-processed the dataset using an R-language framework and deleted least important features. Then applied the data to their deep neural network model as well as to an RF to check the robustness of their model. The results show that the neural network achieved 96.53% and RF achieved 96.24% accuracy on average [39].
Zhang et al. touched upon the imbalanced dataset problem when dealing with network intrusion detection, stated that uneven sample distributions adversely affect the result and limit the quality of detection rate for attack types. Therefore, they proposed a technique for combining a deep learning model with built-in up-sampling and under-sampling approaches. For this aim, the study suggested an imbalanced class processing pipeline where the dataset is up-sampled by using Synthetic Minority Over-Sampling Technique (SMOTE) and then under-sampled by using Gaussian Mixture Model (GMM). The study uses a 8-layer CNN based deep learning model which they call it SGM-CNN. The model uses 2 pieces of CNN+CNN+MaxPool and a dense layer followed by a dense layer. As a test-bed, both CICIDS2017 and UNSW-NB15 datasets were used and the success rates compared with each other. As their pre-processing step, one-hot encoding was used to change categorical variables into numerical form, then a denoising autoencoder was used as a feature reduction and selection mechanism. After the pre-processing, they applied their so-called SGM for imbalanced data processing on the training set. The results show that they had 99.86% overall weighted average -score [40].
Abdulhammed et al. studied on dimension reduction approaches for machine learning tasks on CICIDS2017 dataset and used both auto-encoder and Principle Component Analysis (PCA) to create more discriminative and representative features out of underlying dataset. After that, they applied various machine learning tasks such as Random Forest, Bayesian Network, Linear Discriminant Analysis (LDA) and Quadratic Discriminant Analysis (QDA) on resulting low-dimensional features. Their dimension reduction approaches provided the 10 most significant features out of CICIDS2017 dataset while maintaining a high classification accuracy of 99.6% when using Random Forest classification, yet they did not provide any -score for 10-class scenario. Instead they indicated that the model gets 99.7% weighted average of -score when the number features reduced to 30 [41].
Zhang et al. proposed a novel deep learning model that is a parallel cross convolution neural network model (PCCN) where they aim to produce better quality results for imbalanced attacks. In this study, the authors chose to work on the raw dataset (by parsing PCAP files) over published CSV dataset. That’s why they got different number of samples for their training and test sets. They designed and implemented three different models where in the first model two parallel CNN stack each including 4 convolutional layers share their outputs by concatenating at some points in the pipeline. After cross-relating the features with CNN layers, the resulting feature map is then sent to a global convolutional layer followed by an average pooling. The resulting feature map feeds the dense layer to provide the final result of the neural network. The second model uses element sum instead of concatenation and the third model uses parallel but asymmetric convolutional layers where the result is only concatenated at the level of last layers. In the experiments, the proposed PCCN model outperforms the other models including CNN and LSTM equivalents. The study provided 2 result and comparison variations for the test cases where the first one is from the payload of the dataset and the second one is from the header information of the dataset which we chose to work on, too. They got 97.31% weighted average of -score when using only TCP/UDP header information, 98.65% -score when using only payload itself and increased the overall -score performance to 99.68% when using both the payload and header together [42].
Elmasry et al. introduced two studies mainly based on an evolutionary algorithm approach to enhance deep learning techniques by utilizing Particle Swarm Optimization (PSO) for both pre-training the models and then tuning the hyper-parameters of the underlying models. The authors examined four deep learning models in different studies that are (1) Deep Neural Networks, (2) Long Short-Term Memory Recurrent Neural Networks, (3) Gated Recurrent Unit Recurrent Neural Networks and (4) Deep Belief Networks. The studies indicates that using PSO, the detection rate of the attacks are increased and the false alarm rate are decreased a certain amount. The studies include KDD CUP 99, NSL-KDD, CIDDS, CICIDS2017 and NSL-KDD, CICIDS2017 datasets separately for each paper. Unlike some other studies mentioned in this paper, Elmasry et al. used PCAP files of CICIDS2017 to generate their training and test sets. In this way, they were able to fetch 18750 samples from each classes for their first paper [43] and 2142 samples from each classes for their second paper [44], which makes the dataset absolute balanced. With this setup, the first study achieved up to 97.37% -score for multi-class classification case. The second study achieved up to 95.81% -score for multi-class classification and 99.95% -score for binary classification by utilizing PSO and deep belief networks.
There are many other studies investigating issues about intrusion detection from various aspects. Xavier et al. accomplished to group the dominant features of most frequently used datasets by reducing the multi-dimensionality of them. They examined ISCX 2012 [45], CTU-13 [46], MACCDC [47] and UGR’16 [48] datasets and proposed three feature groups: (1) Basic connection characteristics, (2) content characteristics and (3) traffic statistical characteristics. These groups represent various weights for different types of attacks. The study applied feed forward multi-layer and recurrent neural networks to these groups and compared the results with the recent literature at the time being the study made. Although the features were reduced to a certain amount, the examined approaches still resulted the highest accuracy among observed literature [49].
In order to better understand how intrusion detection datasets are combined of different types of attacks and the relation between these attacks, Zong et al. made a very useful work. The study points out the false alarms of the machine learning models and their outcomes from the cyber security perspective. The study then focuses on visualizing the attack types in 3-D space to better understand how machine learning models see the data itself and act accordingly. To visualize the attack types, the authors chose to work on NSL-KDD [50] and UNSW-NB15 [51] datasets and applied a pre-processing on the data. The authors used PCA transformation to reduce the dimension of the features to three in order to visualize the attacks. In the study, the authors showed different angles of the group of attacks. While some of the attack types in the visualization tool form a clear group (such as DoS), some attack types looks only good at a specific perspective. With respect to this visualization technique, authors then applied a number of machine learning models and put their decision boundaries into the same visual. Therefore the study provides a useful insights for understanding how machine learning models decide their outputs especially for intrusion detection attacks [52].
Table 1 Some of the IDS datasets in the literature
| Dataset | Year | List of Attack Families | # of Features |
| DARPA 98 [53, 54] | 1998 | DoS, probing, R2L, U2R | 41 |
| KDD CUP 99 [55, 56] | 1999 | DoS, probing, R2L, U2R | 41 |
| NSL-KDD [50] | 2009 | DoS, probing, R2L, U2R | 41 |
| ISCX 2012 [45] | 2012 | DoS, DDoS, Brute-Force, Infiltration | 20 |
| UNSW-NB15 [51] | 2015 | Fuzzers, Analysis, Backdoors, DoS, Exploits, Generic, | 49 |
| Reconnaissance, Shellcode, Worms | |||
| CICIDS2017 [57] | 2017 | DoS, DDoS, PortScan, Bot, Brute Force, Web Attack, Infiltration, Heartbleed | 80 |
| CICIDS2018 [57] | 2018 | DoS, DDoS, PortScan, Bot, Brute Force, Web Attack, Infiltration, Heartbleed | 80 |
| IoTID20 [58] | 2020 | DoS, Brute Force, Flooding (UDP, ACK and HTTP), ARP Spoofing, PortScan | 80 |
| MQTT-IoT-IDS2020 [59] | 2020 | Scan (Aggressive, UDP) Brute Force (SSH, MQTT) | 44 |
4 Network Traffic Datasets
In order to suggest an approach for intrusion detection problem, it is essential to study on a comprehensive data which includes up-to-date examples of normal and abnormal logs. Likewise, the selected dataset should be examined by other studies to be able to measure the robustness of the proposed model against recent literature. For this aim, a number of public datasets are available to provide comparable experiment results. DARPA 98 [55] created by MIT Lincoln laboratory where the local computer network of United States Air Forces is simulated. The dataset includes commonly used protocols and a number of attacks including DoS, U2R, R2L and Probe. It is composed of 7 weeks data for the training and 2 weeks for the testing. However it does not reflect real-world scenarios. One of the commonly agreed datasets is KDD CUP 99 [53]. It was used as a basement for many studies where the test set of data represent known and unknown attacks. This dataset seems more suitable for machine learning tasks. However, it is observed that there are too many repetitive lines affecting the performance of algorithms. That’s why the dataset named NSL-KDD [50] was constructed by Canadian Institute for Cybersecurity where the shortcomings of KDD CUP 99 is purified and the dataset became the de facto test-bed for machine learning studies. NSL-KDD is still being used by many studies. A couple years later, ISCX 2012 [45] was created to provide more up-to-date, labeled and wide-range attack real network traffic data. Except, it does not include Secure Socket Layer / Transport Layer Security traffic although most of today’s internet traffic uses them. However all these datasets do not include current scenarios and have already been solved almost 100% by the current literature. In 2015, another approach for creating a comprehensive dataset took place where researchers proposed UNSW-NB15 having 10 classes of both normal and modern synthesized attacks (including exploits, worms, backdoor, DoS, etc.) in the network traffic [51].
Due to the changing needs, Canadian Institute for Cybersecurity prepared a new intrusion detection evaluation dataset, called The Intrusion Detection Evaluation Dataset (CICIDS2017) [57]. The dataset consists of a 5-day real-world scenario including more than 2 millions of event logs where the first day of dataset includes only benign traffic and the remaining days have most up-to-date common attacks as well as benign logs. This dataset also differs from UNSW-NB15 by having higher number of samples as well as having more imbalanced data which more reflects the real world scenarios. All attacks included in the dataset is shown in Table 2. In this dataset, the recordings were obtained from a real computer network where Mac OS, Windows and Linux machines were used between attackers and victims in different cases. The simulation test-bed consists of two networks: (1) The attack-network is used to simulate how intruders and attackers route their traffic to their targets and (2) the victim network which represents benign behavior until an attack takes place. The corresponding representation of the test-bed architecture for the CICIDS2017 dataset is depicted in Figure 2. The dataset provides raw data (PCAP files) as well as feature-extracted comma separated files (CSV) for each day where the CSVs include 80 features composed of numerical and categorical variables. At a granular level, CICIDS2017 has the highest class imbalance among all datasets in the observed literature. In 2018, The Communications Security Establishment joined the project and a new variation of CICIDS2017 was released. This dataset is called CSE-CIC-IDS2018 [57]. It is structurally similar to CICIDS2017, but it has more than 16 millions of event logs where logs were gathered from 10 days of network traffic. This dataset has also high class imbalance ratio but it is lower compared to its predecessor, CICIDS2017.
Table 2 CICIDS2017 scenario
| Recording Day | Duration | Attack |
| Monday | All day | No attack |
| Tuesday | All day | FTP-Patator, SSH-Patator |
| Wednesday | All day | DoS (Hulk, GoldenEye, Slowloris, Slowhttptest) |
| Heartbleed | ||
| Thursday | Morning | Brute Force, XSS, SQL Injection |
| Afternoon | Infiltration | |
| Friday | Morning | Bot |
| Afternoon | DDoS, PortScan |
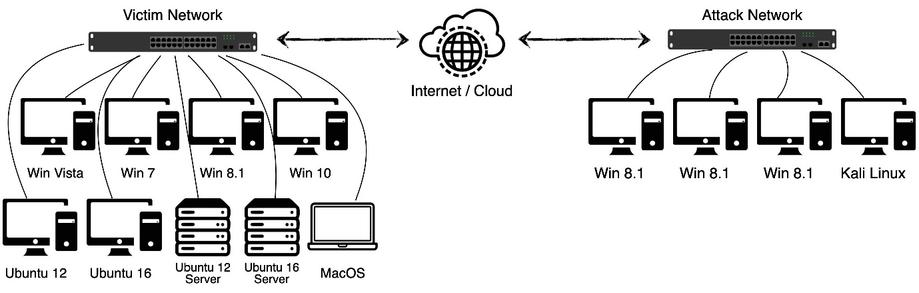
Figure 2 Representation of the test-bed architecture of CICIDS2017 dataset [57].
Table 3 Number of samples after pre-processing and class description of CICIDS2017
| Label | Dist. (%) | Description |
| Benign | 80.3189 | Normal traffic samples. |
| DoS Hulk | 8.1376 | Uses the Hulk tool to for a denial of service attack by generating traffic. |
| PortScan | 5.6156 | Scans and sends packets to varying destination ports to yield information from the server. |
| DDoS | 4.5272 | Uses multiple machines together for a denial of service attack. |
| DoS GoldenEye | 0.3639 | Uses the GoldenEye tool to perform a denial of service attack. |
| FTP-Patator | 0.2805 | Uses FTP-Patator to perform a brute force attack to break the login password. |
| SSH-Patator | 0.2085 | Uses SSH-Patator to perform a brute force attack to break the login password. |
| DoS slowloris | 0.2049 | Uses the Slow Loris tool to perform a denial of service attack. |
| DoS Slowhttptest | 0.1944 | Exploits web requests to exceed the number of HTTP connections allowed on a server and slows it down. |
| Bot | 0.0691 | Uses Trojans to breach the security of a server and operates the whole network by spreading to other machines. |
| WA Brute Force | 0.0532 | Uses trial and error approach to break login password. |
| WA XSS | 0.0230 | Injects malicious script to an input form of a web application. |
| Infiltration | 0.0012 | Uses infiltration tools to infiltrate and gain full access to a server. |
| WA SQL Inj. | 0.0007 | Injects and operates SQL code to break applications. |
| Heartbleed | 0.0003 | Uses OpenSSL crack to access valuable information through web applications. |
Due to the rapid expansion of the IoTs world in a short time and the diversity of the studies in this field, there are also different dataset studies only in the IoT specific. For this aim, researchers conducted a dataset study in 2019 by using a connected night candle and a Wi-Fi camera [60]. This dataset contains various types of network attacks including DoS, Scan (Port and OS), Flooding (UDP, ACK and HTTP) and Telnet Brute Force. Dataset is composed of 42 raw network packet files (PCAP) with different client devices connected to the network including laptops and smart phones. After a short time, another study developed its derivative by extracting number of features from PCAP files into more readable CSV files, called IoTID20 [58]. This study aimed to provide comparable test-bed for intrusion detection research in IoT networks. Since it is a relatively new dataset, there are not many studies in the literature using this dataset.
Since IoT networks frequently use lightweight and specific structures to be compatible with a wide range of devices, they also contain security vulnerabilities specific to these structures. One of these structures is the Message Queuing Telemetry Transport (MQTT) protocol which IoT devices use it (with other similar protocols) for communication purposes. A recent study indicated the lack of such a MQTT-based IDS dataset. For this aim, researchers developed a novel dataset called MQTT-IoT-IDS2020 [61, 59]. This dataset contains 4 IoT attacks including Scan (Aggressive, UDP) and Brute Force (SSH, MQTT). The dataset contains 44 main features and it is provided with PCAP files as well as processed CSV file. Since it is specifically headed for MQTT-based attacks and it does not include many other attack types this dataset is not in the scope of our study. It is also relatively new and there is no study in the literature using this dataset, as our best knowledge.
In order to provide better compatibility and diversity of real-world IoT threat scenarios previously mentioned in Section 2.1, CICIDS2017 dataset has been selected for this study as a test-bed. It also better serves the aim of this study with its higher class imbalance and need for lower computing and processing time compared to its successor, CSE-CIC-IDS2018.
To experiment the proposed approaches, the selected CICIDS2017 dataset has been processed with the following basic steps:
• All the separated 5-day data where benign and attacking scenarios happened has been combined to form one raw data by dropping duplicate rows beforehand.
• Some of the columns were no interest in finding any patterns since they include only zero values regardless their determined classes. These columns having only zero values2 together with flow ID and timestamp which neither can be used as it is nor converted into ordinal or similar numeric values have been deleted. Some rows including NaN, inf, inf have also been deleted to preserve from failures.
• Categorical representations such as source port/IP, destination port/IP have been converted into a numeric format using binary encoding technique.
• Resulting dataset has been re-scaled between 0 and 1 with a scalar function (using sklearn library of Python) and then normalized by removing the mean and scaling it to unit variance.
• The resulting dataset now has 130 normalized features and 2,827,876 samples in total. The detailed number of samples of classes in the dataset can be seen in Table 3 whereas the distribution of the number of samples is visualized in Figure 3
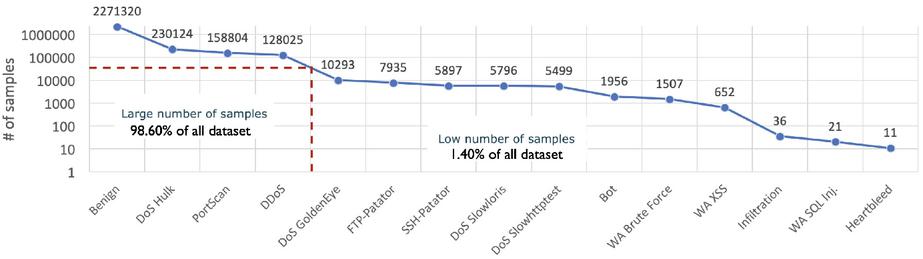
Figure 3 Imbalanced class distribution of CICIDS2017.
5 Proposed Model
In this study, it is aimed to classify network attack types in an IoT network. For this aim, CICIDS2017 dataset has been used to check whether given network packet information includes a type of attack. The proposed model consists of 2-layer CNN stack for automated feature extraction and a 4-layer self normalizing neural network for the classification task. The CNN stack is composed of 2 separable convolution layers [62] each having 3x1 kernel size, Rectified Linear Unit (ReLU) activation and followed by a MaxPooling layer. Separable convolution provides depth-wise convolution for each feature of the input and achieved a good impression with its original model, Xception [62].
The first layer of CNN stack has 128 and the second layer has 256 filters. This part of the network forms a feature map out of the input samples. Thus, yielding better understanding of the feature correlations. The second part of the model is the self normalizing neural classifier which has 128, 64, 32 and 15 neurons respectively. All the layers except the final layer has Scaled Exponential Linear Unit (SELU) activation and uses batch normalization [63] with 10% alpha dropout. In this part of the network, SELU automatically converges the neuron activation towards zero mean and unit variance. Thus, forming a self-normalizing property. Alpha dropout sets the activation to the negative saturation value to ensure the self-normalizing property while providing generalization. Before the last layer, the output of the previous layer and the input data are concatenated to inherit the original features of the data itself which potentially has a positive effect on being stuck in plateau as some research states [64]. The last layer has 15 neuron with the softmax activation which provides a probability distribution for 15 outputs of the dataset. As Adam optimizer is one of the well-known and mostly used optimization functions in Deep Learning world, in this study the novel modified version of Adam, called AdamW has been used. AdamW, fixes some of the bottlenecks of Adam by setting weight decay property according to some pre-known parameters such as the batch size, desired epoch number and the size of the train dataset. With its weight decay formula, AdamW yields better convergence in early epochs [65]. The details for the proposed architecture is depicted in Figure 4 and hyper-parameters including the number of neurons are detailed in Table 4.
In order to keep from absolute randomness and start with reasonable initialization strategy, a custom bias initialize value has been attached to the last layer of the network where the value is dynamically calculated according to the log of least instance class in the training divided by the total number of samples in the training set. The custom bias initialize value is simply calculated as shown in Equation 1.3
| (1) |
After initializing with a custom bias, class weights have been calculated as the weighting coefficients which were inversely proportional to the incidence of classes in the dataset. This process was done automatically by the underlying framework. With this property enabled, the model had more robustness with imbalanced classes since the rare samples had more influence on the back-propagation phase.
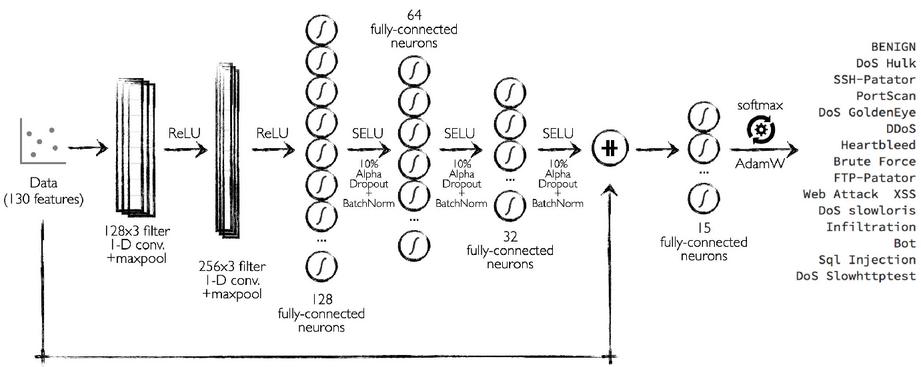
Figure 4 Proposed model. It uses 1-D Separable Conv. layers with MaxPooling. Fully connected layers include Lecun Normal kernel initializer except the output layer and the output layer uses a custom bias initializer.
Table 4 Parameters for the proposed model
| Parameters | Values |
| # of features/inputs | 130 |
| # of convolutional filters | 128x3 - 256x3 |
| activation for convolutional layers | ReLU |
| # of fully connected neurons | 128 - 64 - 32 - 15 |
| activation for fully connected layers | SELU |
| dropout method | alpha dropout |
| dropout rate | 10% |
| normalization method | Batch normalization |
| # of outputs | 15 |
| activation for output layer | softmax |
| optimizer | AdamW |
6 Experiments
This section demonstrates the classification experiments conducted on the pre-processed CICIDS2017 dataset and presents the results of these experiments for the proposed approach. Experiments included 2 main scenarios where the first one was to feed the model directly with data and the latter one was using various up-sampling methods to check whether they were able to overcome imbalanced data problem by generating augmented samples from existing class samples. Each scenario had their own characteristics and yielded reasonable performance on the problem. On the second scenario, we conducted 3 up-sampling techniques where each technique also had 2 sub-scenarios described below.
The experiments run on an Ubuntu 18.04 OS where the proposed approach’s source code was written by using TensorFlow 2.2 framework in Python language. The training and the test phase were run on NVIDIA GPUs where each scenario used one of the GPUs in parallel. Table 5 shows the brief specifications for underlying hardware.
Table 5 Underlying hardware for the experiments
| Category | CPU | GPU (x4) |
| Manufacturer | Intel | NVIDIA |
| Model | Xeon(R) Gold 6138 | Tesla V100 |
| Clock Frequency | 2000 MHz | 1246 MHz |
| Cores | 80 | 5120 |
| DRAM Memory | 100 GB DDR4 | 16 GB DDR5 |
In order to get better insights from the proposed model and scenarios as well as examine the robustness of the approach, all the experiments have been run with k-fold cross validation technique where k is 5. This means that at each fold, 80% training data and 20% test data were randomly created so that training and test sets are separated equally from each class. The main motivation behind the reason that k is 5 is that we tried to choose the maximum number such that the rarest class has at least 2 test samples. In this case, Heartbleed which has the lowest number of samples had 9 samples in training and 2 samples in test sets. Now we have 5 different train and test distribution to apply to the model. In the experiments, each distribution run 100 epochs with batch size set to 10240. The results of the tests then merged with the arithmetic mean. Thus, note that all the outputs described below are the overall average of the k-fold results, instead of cherry-picking the best train-test distribution [67].
In order to make clear insights on a dataset, numerous evaluation metrics were defined so far. Depending on the problem, sometimes even accuracy metric works. However, especially in the imbalanced problem space, working with more equipped metrics is important for evaluation health. Precision and recall are two of the important metrics in imbalanced problems. Precision quantifies the positive observations that actually belong to the positive class (defined in Equation 2). Recall, also called as sensitivity, quantifies the positive observations made out of all positive samples in the dataset (defined in Equation 3). So, maximizing these two metrics yields higher efficiency in finding the best solution for a problem. For this aim, another metric called -score (also called F-measure) is also defined where -score is the harmonic mean of precision and recall (defined in Equation 4). In this study, relying on -score satisfies the search of efficiency in this imbalanced distribution. For this aim, all the results have been calculated with the -score as well as their respective precision and recall values.
| (2) | |
| (3) | |
| (4) |
In the first scenario, we applied the 130-feature data directly to the proposed model depicted in Figure 4. After 100 epochs for each fold, we recorded the results. The averaged result seemed very promising. Eleven classes out of fifteen have -score over 98.4% where the remaining range between 22.1% and 93.5%. Web Attack classes had the least success recall and -scores. WA XSS had 22.15% -score with 16.84% recall rate. WA SQL Injection had 41.33% -score with 32.99% recall rate. This is mostly because that the dataset includes only TCP/UDP header information and corresponding web attacks do not have very obvious fingerprints in header, instead most of the information lays in the payload itself. There are also less number of samples compared to the other classes. Therefore it could not adequately identify fingerprints that were already scarce. Likewise, WA Brute Force was the third least-success class. As Brute Force nature, it would yield higher success if a time-dependent recurrent model had involved in the approach, such as Long Short-Term Memory Units. Yet, CNN was able to catch the required features to a certain level with its convolutions. As the number of samples can bee seen in Table 3 and Figure 3, the shortcomings of being highly imbalanced also affected the results which necessitated more samples to be more precise for the classification of corresponding classes. Despite having the least number of samples, Heartbleed class was 100% determined compared to other classes having larger number of samples. The main reason behind is that Heartbleed has very obvious fingerprints in headers and its features do not overlap with the other classes in the problem space.
Table 6 Detailed classification results for scenario of proposed model
| Label | Precision | Recall | -score |
| Benign | 0.9899 | 0.9889 | 0.9894 |
| DoS Hulk | 0.9993 | 0.9998 | 0.9995 |
| PortScan | 0.9998 | 0.9994 | 0.9996 |
| DDoS | 0.9998 | 0.9998 | 0.9998 |
| DoS GoldenEye | 0.9930 | 0.9928 | 0.9929 |
| FTP-Patator | 0.9986 | 0.9998 | 0.9992 |
| SSH-Patator | 0.9991 | 0.9986 | 0.9988 |
| DoS slowloris | 0.9852 | 0.9917 | 0.9884 |
| DoS Slowhttptest | 0.9899 | 0.9889 | 0.9894 |
| Bot | 0.9237 | 0.9488 | 0.9356 |
| WA Brute Force | 0.7074 | 0.8951 | 0.7887 |
| WA XSS | 0.4160 | 0.1684 | 0.2215 |
| Infiltration | 1.0000 | 0.9714 | 0.9846 |
| WA SQL Inj. | 0.5800 | 0.3299 | 0.4133 |
| Heartbleed | 1.0000 | 1.0000 | 1.000 |
| Accuracy | 0.9995 | ||
| Macro Avg | 0.9061 | 0.8856 | 0.8874 |
| Weighted Avg | 0.9994 | 0.9995 | 0.9994 |
| time (mins.) | 53.9100 |
In this very first experiment, the total weighted average of -score was 0.999 and macro average4 was 0.887 with recall 0.885. The detailed results of each class including precision, recall and -score were recorded as scenario and showed in Table 6. The training phase of 100 epochs were also captured and depicted in Figure 5. On average, each train converged to it’s optimal result in terms of -score after 27th or 28th epochs5 and then slight improvements occurred on the results until the model insisted on memorizing the train set around 60th epochs. For better comparability, we decided to keep the 100 epoch limit constant in each scenario we tested.
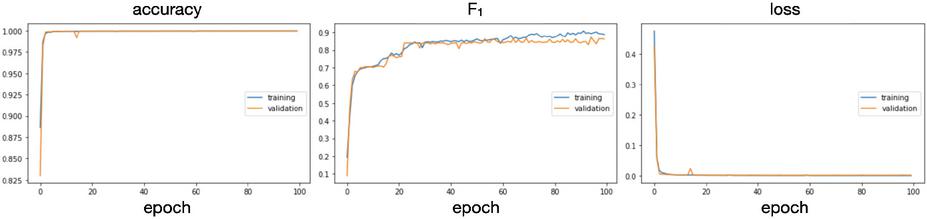
Figure 5 Training the model with 100 epochs. The charts show accuracy, -score and the loss value of the model respectively.
After getting the results, we compared this approach with the recent literature, as depicted in Table 7. Some of the studies [38, 36] included specific target classes in their models and experiments, therefore we compared only the corresponding sub-results of the underlying classes. Some of them provided a complete model for all of the classes in the problem set as ours. In all cases, the model provided in this study outperforms the examined literature whether they targeted specific or all classes.
Table 7 Comparison of models for CICIDS2017 with recent studies and our approach
| Our | |||
| Reference | Measure | Reference | Results |
| Model | Type | (%) | (%) |
| CNN+LSTM, | Accuracy | 97.15 | 99.98 |
| DDoS attacks [36] | |||
| DNN, all classes [37] | Accuracy | 99.50 | 99.95 |
| LSTM, SSH-Patator [38] | -score | 97.00 | 99.88 |
| LSTM, FTP-Patator [38] | -score | 99.00 | 99.92 |
| LSTM, WA BF [38] | -score | 19.00 | 78.87 |
| LSTM, WA XSS [38] | -score | 3.00 | 22.15 |
| LSTM, WA SQL Inj. [38] | -score | 0.00 | 41.33 |
| PCCN, all classes [42] | -score | 97.31 | 99.94 |
| PCA+RF, all classes [41] | -score | 99.70 | 99.94 |
| SGM-CNN, all classes [40] | -score | 99.86 | 99.94 |
Even if the proposed model provides outstanding performance for most of the classes in the data set, there is still a problem for a few classes such as WA XSS, WA SQL Inj. and WA Brute Force having 0.22, 0.41 and 0.78 -scores respectively. These classes are among the 5 classes having the least number of samples (with Infiltration and Heartbleed). That’s why we wanted to check whether any performance increase occurs if we apply data augmentation to the least number of classes. For this aim, the following experiments took place with alternative variations.
For this aim, 3 more experiments were conducted with 2 variations for each. These experiments included different kinds of up-sampling techniques each having 2 different threshold formulation to determine which classes to be augmented and the number of samples generated through the up-sampling. The followings experiments are (1) random sample generation, (2) SMOTEENN and (3) CTGAN techniques.
For the following scenarios, we wanted to add new samples to the classes having low -score by generating new samples out of the existing ones. In this case, it was not clear which classes to select and how much we would increase the number of samples of the selected classes. Benign class in the training set represents overwhelming majority and it would make the bias so high to augment rare classes to that number of samples. Likewise, the second majority class DoS Hulk still had huge difference on the number of samples compared to Heartbleed, Infiltration and Web Attacks. Therefore, it was best to make it adaptive according to the distribution of classes of the given problem itself. For this aim, two different thresholds were calculated and used for the up-sampling techniques.
In the first threshold technique, the classes are sorted in descending order depending on their number of samples in the training set and the threshold is determined as the number of samples of the middle class, which is 4637. The second threshold calculation technique was similar to the first one; but it depends on the number of samples for each class excluding the number of samples for the Benign class (in order to find a more saturated threshold over minority classes). For this aim, the number of samples of the classes are added up together and divided by 14 (the number of minority classes), which is 31803. Determining thresholds also resulted in having the classes to be augmented and the number of samples to be constructed. These classes and the corresponding numbers are shown in Table 8.
Table 8 Chosen classes and the number of samples to be augmented for the up-sampling methods for each threshold. Note that these numbers represent the samples in the training set for each fold
| Augmented Classes | # of Existing Samples | (4637) | (31803) |
| FTP-Patator | 6348 | – | 25455 |
| DoS GoldenEye | 8234 | – | 23569 |
| SSH-Patator | 4717 | – | 27086 |
| DoS slowloris | 4637 | – | 27166 |
| DoS Slowhttptest | 4400 | 237 | 27403 |
| Bot | 1565 | 3072 | 30238 |
| WA Brute Force | 1205 | 3432 | 30598 |
| WA XSS | 522 | 4115 | 31281 |
| Infiltration | 29 | 4608 | 31774 |
| WA SQL Inj. | 16 | 4621 | 31787 |
| Heartbleed | 9 | 4628 | 31794 |
After determining the thresholds, we conducted the next 3 up-sampling techniques for each threshold.
6.1 Up-sampling with Random Noise Generation
In the first up-sampling technique, we designed and implemented simple function that adds random noise to the existing samples of the classes to form new samples. The generator basically adds noise to the selected sample by generating normal distribution noise multiplied by . The noise factor then divided by 2 at each generative iteration to reduce irregular distribution of classes and make the new samples to get closer to each other. The random sample generator is shown in Algorithm 1.
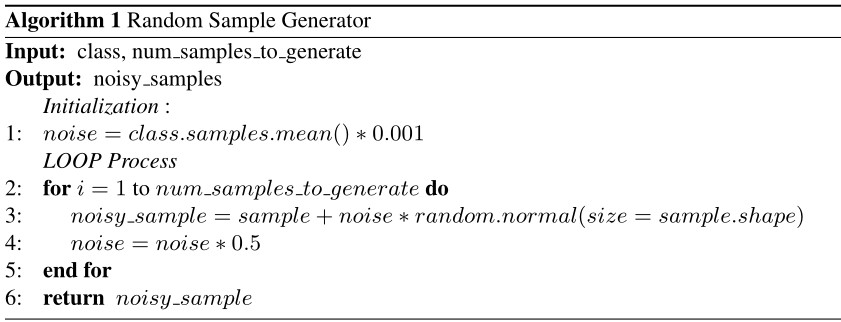
For the variation, the threshold was 4637 which is equal to the number of samples of DoS Slowloris. The classes having lower number of samples in each fold of training have been processed and augmented so that the number of samples for these classes become equal to the number of samples of DoS Slowloris. This scenario resulted with 0.9156 macro average -score. The random sample generator in this scenario increased the success of the model by approx. 3.15% overall where -score of WA XSS increased by 92.3%, WA SQL Inj. increased by 80.1% and WA Brute Force decreased by 11.1%. Adding random noise with this threshold also has little effect on the success of determining other augmented classes either positive or negative, such as Infiltration -score decreased by 1.52. This is mostly because of the bias the noise adds to the data. The detailed results of each class were recorded as scenario in Tables 9 and 10.
Table 9 Recall value comparison of both and up-sampling scenarios for proposed model. Bold values represent the best shot for each class
| Label | |||||||
| Benign | 0.9999 | 0.9998 | 0.9998 | 0.9998 | 0.9998 | 0.9998 | 0.9998 |
| DoS Hulk | 0.9998 | 0.9997 | 0.9992 | 0.9993 | 0.9995 | 0.9997 | 0.9993 |
| PortScan | 0.9994 | 0.9994 | 0.9992 | 0.9993 | 0.9992 | 0.9991 | 0.9994 |
| DDoS | 0.9998 | 0.9998 | 0.9996 | 0.9998 | 0.9995 | 0.9997 | 0.9998 |
| DoS GoldenEye | 0.9928 | 0.9916 | 0.9948 | 0.9880 | 0.9926 | 0.9940 | 0.9938 |
| FTP-Patator | 0.9998 | 0.9998 | 0.9997 | 0.9996 | 0.9996 | 0.9998 | 0.9998 |
| SSH-Patator | 0.9986 | 0.9991 | 0.9993 | 0.9998 | 0.9984 | 0.9996 | 0.9996 |
| DoS slowloris | 0.9917 | 0.9860 | 0.9875 | 0.9898 | 0.9887 | 0.9775 | 0.9889 |
| DoS Slowhttptest | 0.9889 | 0.9894 | 0.9896 | 0.9830 | 0.9856 | 0.9901 | 0.9849 |
| Bot | 0.9488 | 0.9657 | 0.9683 | 0.9673 | 0.9690 | 0.9693 | 0.9555 |
| WA Brute Force | 0.8951 | 0.6708 | 0.6987 | 0.7311 | 0.6947 | 0.8348 | 0.8560 |
| WA XSS | 0.1684 | 0.4843 | 0.4111 | 0.4246 | 0.4125 | 0.2484 | 0.2134 |
| Infiltration | 0.9714 | 0.9428 | 0.9428 | 0.9714 | 1.0000 | 1.0000 | 1.0000 |
| WA SQL Inj. | 0.3299 | 0.8099 | 0.6599 | 0.7600 | 0.7600 | 0.9099 | 0.7700 |
| Heartbleed | 1.0000 | 1.0000 | 1.0000 | 1.0000 | 1.0000 | 1.0000 | 1.0000 |
| Accuracy | 0.9995 | 0.9994 | 0.9993 | 0.9993 | 0.9993 | 0.9994 | 0.9994 |
| Macro Avg | 0.8856 | 0.9225 | 0.9100 | 0.9208 | 0.9199 | 0.9281 | 0.9173 |
| Weighted Avg | 0.9995 | 0.9994 | 0.9993 | 0.9993 | 0.9993 | 0.9994 | 0.9994 |
| time (mins.) | 53.91 | 58.24 | 66.28 | 65.01 | 754.57 | 549.19 | 2156.99 |
After running , the variation has been experimented where the threshold calculated as 31803. The classes having lower number of samples in each fold of training have been processed and augmented so that the number of samples for these classes become equal to . We compared the results with the previous version of this up-sampling technique.
This technique resulted with the -score of WA Brute Force increased by 1.57% but WA XSS decreased by 8.47% as well as WA SQL Inj. decreased by 10.61%. Total macro average -score was 0.906. It was better than the scenario with no augmentation but it had low success compared to the variation. This is mostly because the number classes augmented are higher than the previous experiment and the threshold is also way larger compared to it. Thus generating more spread samples over the problem space. Therefore the bias gets expanded and some of the samples were overlapped with the samples of other classes in the problem space. The detailed results of each class were recorded as scenario in Tables 9 and 10.
After experimenting that increasing the number of samples up to some point yielded better results, we continued to test two other up-sampling techniques: SMOTEENN and CTGAN.
6.2 Up-sampling with SMOTEENN
SMOTEENN is a combined data augmentation technique where Synthetic Minority Over-sampling Technique (SMOTe) is applied to the minority classes to balance class distribution by augmenting the minority samples replicating them with linear interpolation and Edited Nearest Neighbors (ENN) is then applied to the augmented data to clean possible outliers [68] by removing majority class samples close to the decision boundary (N=3 is the pre-defined default value for sklearn library). After running 5 folds for the variation, the overall macro average -score was 0.914. The result was better than the scenario, but a little bit lower compared to . By looking into the individual classes it can be seen that WA Brute Force and Infiltration had better -score compared to ; but WA XSS and WA SQL Inj. had lower -score. There are also varying little changes on the other classes. The detailed results of each class were recorded as scenario in Tables 9 and 10.
Table 10 -score comparison of both and up-sampling scenarios for proposed model. Bold values represent the best shot for each class
| Label | |||||||
| Benign | 0.9999 | 0.9999 | 0.9999 | 0.9999 | 0.9999 | 0.9999 | 0.9999 |
| DoS Hulk | 0.9995 | 0.9995 | 0.9993 | 0.9994 | 0.9994 | 0.9995 | 0.9993 |
| PortScan | 0.9996 | 0.9996 | 0.9994 | 0.9996 | 0.9994 | 0.9995 | 0.9996 |
| DDoS | 0.9998 | 0.9998 | 0.9997 | 0.9995 | 0.9996 | 0.9998 | 0.9995 |
| DoS GoldenEye | 0.9929 | 0.9918 | 0.9900 | 0.9893 | 0.9901 | 0.9932 | 0.9924 |
| FTP-Patator | 0.9992 | 0.9994 | 0.9995 | 0.9994 | 0.9988 | 0.9993 | 0.9994 |
| SSH-Patator | 0.9988 | 0.9989 | 0.9985 | 0.9975 | 0.9968 | 0.9945 | 0.9989 |
| DoS slowloris | 0.9884 | 0.9883 | 0.9866 | 0.9877 | 0.9857 | 0.9861 | 0.9884 |
| DoS Slowhttptest | 0.9894 | 0.9883 | 0.9868 | 0.9859 | 0.9865 | 0.9853 | 0.9883 |
| Bot | 0.9356 | 0.9293 | 0.9201 | 0.9196 | 0.9164 | 0.9233 | 0.9232 |
| WA Brute Force | 0.7887 | 0.7003 | 0.7115 | 0.7319 | 0.7071 | 0.7631 | 0.7713 |
| WA XSS | 0.2215 | 0.4257 | 0.3896 | 0.3971 | 0.3830 | 0.2881 | 0.2342 |
| Infiltration | 0.9846 | 0.9692 | 0.9560 | 0.9846 | 0.9632 | 1.0000 | 1.0000 |
| WA SQL Inj. | 0.4133 | 0.7444 | 0.6657 | 0.7326 | 0.6960 | 0.6306 | 0.6777 |
| Heartbleed | 1.0000 | 1.0000 | 1.0000 | 1.0000 | 1.0000 | 1.0000 | 1.0000 |
| Accuracy | 0.9995 | 0.9994 | 0.9993 | 0.9993 | 0.9993 | 0.9994 | 0.9994 |
| Macro Avg | 0.8874 | 0.9156 | 0.9068 | 0.9149 | 0.9081 | 0.9041 | 0.9048 |
| Weighted Avg | 0.9994 | 0.9994 | 0.9993 | 0.9994 | 0.9993 | 0.9994 | 0.9994 |
| time (mins.) | 53.91 | 58.24 | 66.28 | 65.01 | 754.57 | 549.19 | 2156.99 |
The variation of SMOTEENN up-sampling had 0.908 macro average -score. This variation was better compared to the scenario; but it was lower compared to the . However, it had better results over , such as 0.22% higher macro -score together with WA SQL Inj. and Infiltration -score increase. By looking at the overall results, this variation is not very separable from the scenario other than noisy changes. The detailed results of each class were recorded as scenario in Tables 9 and 10.
6.3 Up-sampling with CTGAN
As the last sub-scenario, we generated augmented samples over two thresholds by using CTGAN. For this case, the CTGAN algorithm run 100 epochs with batch size equal to 10 for each fold of the training phase. For the , the macro average of -score was 0.9041 where it’s still better from the scenario, but has lower score compared to the previous up-sampling variations. For the , the macro average of -score is 0.9048.6 Although, the macro average -score is lower compared to the other two up-sampling techniques, CTGAN-powered up-sampling in both thresholds resulted with 100% -score for Infiltration class for all folds of training and testing phases.
One of the main reasons CTGAN technique could not outperform the other techniques for some of the classes, as the setup suggests, could be the distribution quality of samples in each class. As the GAN (Generative Adversarial Network) itself is a generative model getting its roots from the quality of the samples it is trained, we can make an inference that CTGAN could not detect enough quality patterns from the samples except that training samples from Infiltration class were most likely to be a good fit for CTGAN where it successfully generated close augmented samples for CNN classifier. The other reason can be the number of samples and the number of iterations as well as the batch size. However, we find it very useful to use CTGAN to generate structured realistic samples from tabular data and compare them with the other techniques instead of just relying on conventional or random approaches. Yet, optimizing the hyper-parameters of CTGAN is not in the scope of this paper. Under proper circumstances and right parameter optimizations, it may higher the quality of the results. The detailed results of and for this up-sampling scenario were recorded as and respectively.
The overall detailed results of all scenarios can be seen in Tables 9 and 10 for recall and -score respectively.
7 Discussion
We conducted the augmentation experiments to check whether generating synthetic addition for the classes which have lower number of samples yields an improvement in both for these classes and the overall score as well. During the experiments of different threshold variation, many classes in the problem set seemed that they tend to be better when augmented with more samples, thus it eliminates the imbalanced dataset problem to a certain level. However, choosing which classes to be augmented is one of the hyper-parameters of this kind of problem when there are many classes to be considered. For this reason, we experimented two different thresholds for determining the classes as well as the number of samples to be generated. affected 7 classes and the affected 11 classes. In most cases outperformed the other one. This is because makes more distribution for the affected classes, thus it creates more overlapped samples with each other as well as with the remaining classes. Augmentation scenarios provided lower scores for the WA Brute Force attack compared to the scenario where no augmentation applied, but the other Web Attack classes such as WA XSS and WA SQL Inj. increased up to 80.11% and 92.1% respectively. The overall best performance still was the scenario with 99.94% -score and 99.95% recall score, but the best macro averages took place with scenario where it yielded 91.56% -score and 92.25% recall score.
Another issue that draws our attention in the experiments is that the random sampler function has got better results compared to SMOTEENN in most classes. Our random sampler basically calculates random noise based on the values of each sample in the training set, regardless of their distance to each other. On the contrary of SMOTEENN using linear interpolation, random sampler does not necessarily create the new sample in the middle of two other samples. Instead, it chooses the values randomly. At each iteration, random sampler uses the previously generated synthetic samples to create new samples. Since creating new samples from the ones that were already synthetic will increase the bias substantially, the function halves its noise factor to control it. Thus, it converges inside a virtual boundary. Considering these two techniques, our random sampler gives us more space and more variety of synthetic samples. We resulted that this feature yielded more accuracy in our conducted experiments. Especially random sampler works better in the rarest class distribution because it creates more colorful samples compared to SMOTEENN which has a low decision boundary for few samples.
Along with the success scores of the up-sampling techniques, the time taken by the proposed technique to be trained should also be considered as a feasibility factor. As shown in Table 10, the time it takes to train model is minutes, where it adds minutes to run , minutes to run and minutes to run . With these times, it can be said that scenario takes way more than to train compared to the other experiments, yet it does not outperform , and . Still it happened a good exercise to test whether generating samples based on a generative adversarial network is comparable to noise-based and linear interpolation-based techniques.
8 Conclusion
IoT technologies are one of the attractive research areas in the cybersecurity concept of the world. Although these technologies simplify lots of real-world affairs, they also bring many security deficiencies for us. Machine learning approaches have great efficiency in the detection of intrusions in IoT networks. Therefore, deep learning algorithms, as examples of machine learning approaches, are preferred in recent years. However, for training the system, the used datasets are also so important, up-to-date, and new datasets are preferred especially for increasing the accuracy of the real-world applications. However, these data sets are generally unbalanced, and this should be taken into consideration for implementing an online/active system.
In this study, we proposed a CNN-powered self-normalizing neural network classifier and conducted experiments on determining attack types in a simulated IoT network by using an imbalance reference dataset. We compared the performance with other recent studies, which also used deep learning to solve classification tasks on the same dataset. Results of our study outperformed them for all cases with 0.9994 overall weighted average -score. However, the model served lower -score for a few classes having a low number of samples. To check whether adding synthetic data to those classes increases the robustness of the model for this imbalanced data problem, we tried to run 3 up-sampling techniques and compared them with each other. Yet determining which classes to be augmented as well as the number of samples to be generated here remained like a hyper-parameter. For that reason, 2 simple-minded thresholds were calculated, and the result qualities were compared. Experiments showed that data augmentation techniques provide better convergence for most of the targeted classes as well as that they also extend the sample distribution of the problem space, which in turn generated some overlapping samples with wrong classes. However, as a result, it can be said that synthetic data production in a highly imbalanced dataset increases performance in targeted classes to some extent, depending on the hyper-parameter values. This approach should still be validated using other datasets having a high imbalance such as CSE-CIC-IDS2018 or new ones to be produced in the future.
This study mainly focused on improving the results with a data-centric approach by applying a number of augmentation techniques to the dataset. However, a model-centric approach, such as hyper-parameter optimization techniques, could also be used for improving the model with the stock dataset. AutoML packages of the underlying Deep Learning frameworks and evolutionary algorithms (such as Genetic Algorithm, Ant Colony Optimization, Particle Swarm Optimization, etc.) can be used to fine-tune the number of CNN layers, the number of neurons in each layer, learning rate of optimizer function and the rate of dropout (if used). However, it was out of our scope. Yet it can be seen as an open challenge for future researchers willing to work on developing a model-centric approach to this problem.
In addition to all these, in the post-pandemic new normality, usage habits in both the health field and other improvements offered by IoTs may also vary. New various contactless emerging technologies may be used in health, social distancing, monitoring, and other related problems with the help of IoTs, 5G, Blockchain and robotic infrastructures [69]. This may, in turn, result in more complex types of networks and thus new complex safety and security problems.
Notes
1The pandemic actually started to make us think about the importance and potential of all IoT applications in order to meet the consumption needs of people with the new normality concept.
2bwd psh flags, bwd urg flags, fwd avg bytes/bulk, fwd avg packets/bulk, fwd avg bulk rate, bwd avg bytes/bulk, bwd avg packets/bulk, bwd avg bulk rate
3Custom initial bias approach was inspired from TensorFlow Documentation [66] which was also inherited from experiences of Deep Learning community.
4Macro average is the arithmetic mean of all the scores regardless of the number of samples.
5Convergence epoch numbers varied between each fold.
6all related source code and documentation can be found here: https://github.com/ucekmez/phd
References
[1] S. Steinberg, “Cyberattacks now cost companies $200,000 on average, putting many out of business,” https://www.cnbc.com/2019/10/13/cyberattacks-cost-small-companies-200k-putting-many-out-of-business.html, 2019, accessed: 2021-05-31.
[2] S. Jenkins, “Learning to love siem,” Network Security, vol. 2011, no. 4, pp. 18–19, 2011.
[3] J. P. Farwell and R. Rohozinski, “Stuxnet and the future of cyber war,” Survival, vol. 53, no. 1, pp. 23–40, 2011.
[4] C. Bronk and E. Tikk-Ringas, “The cyber attack on saudi aramco,” Survival, vol. 55, no. 2, pp. 81–96, 2013.
[5] R. Walters, “Cyber attacks on us companies in 2014,” The Heritage Foundation, vol. 4289, pp. 1–5, 2014.
[6] L. M. at Forbes, “Hackers use ddos attack to cut heat to apartments,” https://www.forbes.com/sites/leemathews/2016/11/07/ddos-attack-leaves-finnish-apartments-without-heat, 2016, accessed: 2021-05-31.
[7] L. Mathews, “Criminals hacked a fish tank to steal data from a casino,” https://www.forbes.com/sites/leemathews/2017/07/27/criminals-hacked-a-fish-tank-to-steal-data-from-a-casino, 2017, accessed: 2021-05-31.
[8] A. Greenberg, “The jeep hackers are back to prove car hacking can get much worse,” https://www.wired.com/2016/08/jeep-hackers-return-high-speed-steering-acceleration-hacks/, 2016, accessed: 2021-05-31.
[9] A. Chiu, “She installed a ring camera in her children’s room for ‘peace of mind.’ a hacker accessed it and harassed her 8-year-old daughter,” https://www.washingtonpost.com/nation/2019/12/12/she-installed-ring-camera-her-childrens-room-peace-mind-hacker-accessed-it-harassed-her-year-old-daughter/, 2019, accessed: 2021-05-31.
[10] S. Jain, “Woman says hacker spied on her through webcam,” https://www.ndtv.com/offbeat/woman-says-hacker-spied-on-her-through-webcam-video-will-give-you-chills-1761567, 2017, accessed: 2021-05-31.
[11] C. Matyszczyk, “Hacker shouts at baby through baby monitor,” https://www.cnet.com/news/hacker-shouts-at-baby-through-baby-monitor/, 2014, accessed: 2021-05-31.
[12] E. Hodo, X. Bellekens, A. Hamilton, C. Tachtatzis, and R. Atkinson, “Shallow and deep networks intrusion detection system: A taxonomy and survey,” arXiv preprint arXiv:1701.02145, 2017.
[13] U. Cekmez, Z. Erdem, A. G. Yavuz, O. K. Sahingoz, and A. Buldu, “Network anomaly detection with deep learning,” in 2018 26th Signal Processing and Communications Applications Conference (SIU). IEEE, 2018, pp. 1–4.
[14] G. Klambauer, T. Unterthiner, A. Mayr, and S. Hochreiter, “Self-normalizing neural networks,” in Advances in Neural Information Processing Systems, 2017, pp. 971–980.
[15] L. Xu, M. Skoularidou, A. Cuesta-Infante, and K. Veeramachaneni, “Modeling tabular data using conditional gan,” in Advances in Neural Information Processing Systems, 2019, pp. 7335–7345.
[16] J. H. Nord, A. Koohang, and J. Paliszkiewicz, “The internet of things: Review and theoretical framework,” Expert Systems with Applications, vol. 133, pp. 97–108, 2019.
[17] P. P. Ray, “A survey on internet of things architectures,” Journal of King Saud University-Computer and Information Sciences, vol. 30, no. 3, pp. 291–319, 2018.
[18] S. H. Shah and I. Yaqoob, “A survey: Internet of things (iot) technologies, applications and challenges,” in 2016 IEEE Smart Energy Grid Engineering (SEGE). IEEE, 2016, pp. 381–385.
[19] P. Scully, “Top 10 iot applications in 2020,” https://iot-analytics.com/top-10-iot-applications-in-2020/, 2019, accessed: 2021-05-31.
[20] M. Ndiaye, S. S. Oyewobi, A. M. Abu-Mahfouz, G. P. Hancke, A. M. Kurien, and K. Djouani, “Iot in the wake of covid-19: A survey on contributions, challenges and evolution,” IEEE Access, vol. 8, pp. 186 821–186 839, 2020.
[21] R. P. Singh, M. Javaid, A. Haleem, and R. Suman, “Internet of things (iot) applications to fight against covid-19 pandemic,” Diabetes & Metabolic Syndrome: Clinical Research & Reviews, 2020.
[22] Z. Yan, P. Zhang, and A. V. Vasilakos, “A survey on trust management for internet of things,” Journal of network and computer applications, vol. 42, pp. 120–134, 2014.
[23] I. Cvitić, M. Vujić et al., “Classification of security risks in the iot environment.” Annals of DAAAM & Proceedings, vol. 26, no. 1, 2015.
[24] L. Tawalbeh, F. Muheidat, M. Tawalbeh, M. Quwaider et al., “Iot privacy and security: Challenges and solutions,” Applied Sciences, vol. 10, no. 12, p. 4102, 2020.
[25] A. Selamat and Z. Iqal, “Open challenges in internet of things security,” in Journal of Physics: Conference Series, vol. 1447, no. 1. IOP Publishing, 2020, p. 012054.
[26] F. A. Alaba, M. Othman, I. A. T. Hashem, and F. Alotaibi, “Internet of things security: A survey,” Journal of Network and Computer Applications, vol. 88, pp. 10–28, 2017.
[27] F. Hussain, R. Hussain, S. A. Hassan, and E. Hossain, “Machine learning in iot security: current solutions and future challenges,” IEEE Communications Surveys & Tutorials, 2020.
[28] H.-S. Chae and S. Choi, “Feature selection for efficient intrusion detection using attribute ratio,” International Journal of Computers and Communications, vol. 8, 2014.
[29] L. H. Yeo, X. Che, and S. Lakkaraju, “Modern intrusion detection systems,” CoRR, vol. abs/1708.07174, 2017. [Online]. Available: http://arxiv.org/abs/1708.07174
[30] A. A. Aburomman and M. B. I. Reaz, “A survey of intrusion detection systems based on ensemble and hybrid classifiers,” Computers & Security, vol. 65, pp. 135 – 152, 2017.
[31] A. Patel, Q. Qassim, and C. Wills, “A survey of intrusion detection and prevention systems,” Information Management & Computer Security, vol. 18/4, pp. 277–290, 2010.
[32] O. K. Sahingoz and N. Erdogan, “Rubdes: A rule based distributed event system,” in Computer and Information Sciences - ISCIS 2003. Berlin, Heidelberg: Springer Berlin Heidelberg, 2003, pp. 284–291.
[33] W. Hu and Y. Tan, “Generating adversarial malware examples for black-box attacks based on gan,” arXiv preprint arXiv:1702.05983, 2017.
[34] J. Kos, I. Fischer, and D. Song, “Adversarial examples for generative models,” in 2018 IEEE Security and Privacy Workshops (SPW). IEEE, 2018, pp. 36–42.
[35] G. Karatas and O. K. Sahingoz, “Neural network based intrusion detection systems with different training functions,” in Proceedings of the 6th International Symposium on Digital Forensic and Security (ISDFS), Antalya, Turkey, 2018.
[36] M. Roopak, G. Y. Tian, and J. Chambers, “Deep learning models for cyber security in iot networks,” in 2019 IEEE 9th Annual Computing and Communication Workshop and Conference (CCWC). IEEE, 2019, pp. 0452–0457.
[37] O. Faker and E. Dogdu, “Intrusion detection using big data and deep learning techniques,” in Proceedings of the 2019 ACM Southeast Conference, 2019, pp. 86–93.
[38] M. D. Hossain, H. Ochiai, F. Doudou, and Y. Kadobayashi, “Ssh and ftp brute-force attacks detection in computer networks: Lstm and machine learning approaches,” in 2020 5th International Conference on Computer and Communication Systems (ICCCS). IEEE, 2020, pp. 491–497.
[39] Z. Pelletier and M. Abualkibash, “Evaluating the cic ids-2017 dataset using machine learning methods and creating multiple predictive models in the statistical computing language r,” Science, vol. 5, no. 2, pp. 187–191, 2020.
[40] H. Zhang, L. Huang, C. Q. Wu, and Z. Li, “An effective convolutional neural network based on smote and gaussian mixture model for intrusion detection in imbalanced dataset,” Computer Networks, p. 107315, 2020.
[41] R. Abdulhammed, H. Musafer, A. Alessa, M. Faezipour, and A. Abuzneid, “Features dimensionality reduction approaches for machine learning based network intrusion detection,” Electronics, vol. 8, no. 3, p. 322, 2019.
[42] Y. Zhang, X. Chen, D. Guo, M. Song, Y. Teng, and X. Wang, “Pccn: Parallel cross convolutional neural network for abnormal network traffic flows detection in multi-class imbalanced network traffic flows,” IEEE Access, vol. 7, pp. 119 904–119 916, 2019.
[43] W. Elmasry, A. Akbulut, and A. H. Zaim, “Empirical study on multiclass classification-based network intrusion detection,” Computational Intelligence, vol. 35, no. 4, pp. 919–954, 2019.
[44] ——, “Evolving deep learning architectures for network intrusion detection using a double pso metaheuristic,” Computer Networks, vol. 168, p. 107042, 2020.
[45] A. Shiravi, H. Shiravi, M. Tavallaee, and A. A. Ghorbani, “Toward developing a systematic approach to generate benchmark datasets for intrusion detection,” computers & security, vol. 31, no. 3, pp. 357–374, 2012.
[46] D. S. Terzi, R. Terzi, and S. Sagiroglu, “Big data analytics for network anomaly detection from netflow data,” in 2017 International Conference on Computer Science and Engineering (UBMK). IEEE, 2017, pp. 592–597.
[47] D. Krovich, A. Cottrill, and D. J. Mancini, “A cloud based entitlement granting engine,” in National Cyber Summit. Springer, 2019, pp. 220–231.
[48] G. Maciá-Fernández, J. Camacho, R. Magán-Carrión, P. García-Teodoro, and R. Therón, “Ugr’16: A new dataset for the evaluation of cyclostationarity-based network idss,” Computers & Security, vol. 73, pp. 411–424, 2018.
[49] X. A. Larriva-Novo, M. Vega-Barbas, V. A. Villagrá, and M. S. Rodrigo, “Evaluation of cybersecurity data set characteristics for their applicability to neural networks algorithms detecting cybersecurity anomalies,” IEEE Access, vol. 8, pp. 9005–9014, 2020.
[50] L. Dhanabal and S. Shantharajah, “A study on nsl-kdd dataset for intrusion detection system based on classification algorithms,” International Journal of Advanced Research in Computer and Communication Engineering, vol. 4, no. 6, pp. 446–452, 2015.
[51] N. Moustafa and J. Slay, “Unsw-nb15: a comprehensive data set for network intrusion detection systems (unsw-nb15 network data set),” in 2015 military communications and information systems conference (MilCIS). IEEE, 2015, pp. 1–6.
[52] W. Zong, Y.-W. Chow, and W. Susilo, “Interactive three-dimensional visualization of network intrusion detection data for machine learning,” Future Generation Computer Systems, vol. 102, pp. 292–306, 2020.
[53] M. Tavallaee, E. Bagheri, W. Lu, and A. A. Ghorbani, “A detailed analysis of the kdd cup 99 data set,” in Computational Intelligence for Security and Defense Applications, 2009. CISDA 2009. IEEE Symposium on. IEEE, 2009, pp. 1–6.
[54] “Darpa 98 data set,” https://www.ll.mit.edu/r-d/datasets/1998-darpa-intrusion-detection-evaluation-dataset, 1998, accessed: 2021-05-31.
[55] J. McHugh, “Testing intrusion detection systems: a critique of the 1998 and 1999 darpa intrusion detection system evaluations as performed by lincoln laboratory,” ACM Transactions on Information and System Security (TISSEC), vol. 3, no. 4, pp. 262–294, 2000.
[56] “Kdd cup 99,” http://kdd.ics.uci.edu/databases/kddcup99/kddcup99.html, 1999, accessed: 2021-05-31.
[57] I. Sharafaldin, A. H. Lashkari, and A. A. Ghorbani, “Toward generating a new intrusion detection dataset and intrusion traffic characterization.” in ICISSP, 2018, pp. 108–116.
[58] I. Ullah and Q. H. Mahmoud, “A scheme for generating a dataset for anomalous activity detection in iot networks,” in Canadian Conference on Artificial Intelligence. Springer, 2020, pp. 508–520.
[59] H. Hindy, C. Tachtatzis, R. Atkinson, E. Bayne, and X. Bellekens, “Mqtt-iot-ids2020: Mqtt internet of things intrusion detection dataset,” 2020. [Online]. Available: https://dx.doi.org/10.21227/bhxy-ep04
[60] H. Kang, D. H. Ahn, G. M. Lee, J. D. Yoo, K. H. Park, and H. K. Kim, “Iot network intrusion dataset,” 2019. [Online]. Available: https://dx.doi.org/10.21227/q70p-q449
[61] H. Hindy, E. Bayne, M. Bures, R. Atkinson, C. Tachtatzis, and X. Bellekens, “Machine learning based iot intrusion detection system: An mqtt case study (mqtt-iot-ids2020 dataset),” 2020.
[62] F. Chollet, “Xception: Deep learning with depthwise separable convolutions,” in Proceedings of the IEEE conference on computer vision and pattern recognition, 2017, pp. 1251–1258.
[63] S. Ioffe and C. Szegedy, “Batch normalization: Accelerating deep network training by reducing internal covariate shift,” CoRR, vol. abs/1502.03167, 2015. [Online]. Available: http://arxiv.org/abs/1502.03167
[64] B.-C. Kim, Y. S. Sung, and H.-I. Suk, “Deep feature learning for pulmonary nodule classification in a lung ct,” in 2016 4th International Winter Conference on Brain-Computer Interface (BCI). IEEE, 2016, pp. 1–3.
[65] I. Loshchilov and F. Hutter, “Fixing weight decay regularization in adam,” arXiv preprint arXiv:1711.05101, 2017.
[66] “Tensorflow documentation for imbalanced data,” tensorflow.org/tutorials/structured_data/imbalanced_data, 2020, accessed: 2021-05-31.
[67] O. Gencoglu, M. van Gils, E. Guldogan, C. Morikawa, M. Süzen, M. Gruber, J. Leinonen, and H. Huttunen, “Hark side of deep learning–from grad student descent to automated machine learning,” arXiv preprint arXiv:1904.07633, 2019.
[68] M. A. Hossen, F. Siddika, T. K. Chanda, and T. Bhuiyan, “A comparison of some soft computing methods on imbalanced data,” in International Conference on Cyber Security and Computer Science, 2018.
[69] V. Chamola, V. Hassija, V. Gupta, and M. Guizani, “A comprehensive review of the covid-19 pandemic and the role of iot, drones, ai, blockchain, and 5g in managing its impact,” IEEE Access, vol. 8, pp. 90 225–90 265, 2020.
Biographies

Ozgur Koray Sahingoz received the B.Sc. degree from the Computer Engineering Department, Bogazici University, in 1993, and the M.S. and Ph.D. degrees from the Computer Engineering Department, Istanbul Technical University, in 1998 and 2006, respectively. He is currently working as Professor with the Computer Engineering Department, Biruni University/Istanbul. He is the author of more than 100 articles. He has been working in two research projects. He graduated more than 13 M.Sc. students and supervised around six Ph.D. students. He has reviewed more than 80 national projects especially related to TUBITAK, KOSGEB-Ministry of Industry and Technology, Turkey. He is also a regular Reviewer for more than 40 Science Citation Index (/Expanded) international journals. His research interests include artificial intelligence, machine/deep learning, data science, software engineering, and UAV networking. Dr. Sahingoz has also been very active in scientific conferences, organized and/or works as program committee members more than 100 conferences/workshops on different research areas, especially on artificial intelligence and information sciences. He has developed and taught around 20 different academic courses.

Ugur Cekmez was born in Istanbul, Turkey, in 1989. He received the B.Sc. degree from the Computer Science Department, Istanbul Bilgi University, in 2012, and the M.S. degree from the Computer Engineering Department, Turkish Air Force Academy, in 2014. He is currently pursuing the Ph.D. degree with the Computer Engineering Department, Marmara University. He is an experienced Research Scientist with a demonstrated history of working in the information technology industry. Skilled in AI, Data Intelligence, Container Technology, Python and node.js. His research interests include AI and Data Science, Evolutionary Algorithms, Cloud Technologies, E-commerce and Finance Technologies. He has been co-founding projects and start-ups in digital concepts. He previously worked as a Research Assistant at Yildiz Technical University, as a Senior Researcher at TUBITAK, as an R&D engineer at SIEMENS, Turkey and as a Senior Research Engineer at Turkish Television and Radio Corporation (TRT). He is currently working as a Senior Researcher at Chooch Intelligence Technologies Co, the USA.

Ali Buldu was born in 1971 in Kayseri, Turkey. He received the B.Sc. degree from Marmara University Technical Education Faculty Electronic and Computer Department. He received M.Sc. and Ph.D. degrees from Marmara University Institute for Graduate Studies in Pure and Applied Sciences in 1996 and 2003, respectively. Dr. Buldu has been Professor with the Computer Engineering Department since October 2019. His research interests focus on Computer Hardware, Circuit Design with Embedded Systems Computer Aided Education, Information Technologies and Computer Programming Languages.
Journal of Web Engineering, Vol. 20_6, 1721–1760.
doi: 10.13052/jwe1540-9589.2062
© 2021 River Publishers