Comparing Voice Assistant Risks and Potential with Technology-Based Users: A Study from Germany and Spain
Andreas M. Klein1,*, Maria Rauschenberger2, Jörg Thomaschewski2 and Maria José Escalona1
1Department of Computer Languages and Systems, University of Seville, Spain
2Faculty of Technology, University of Applied Sciences Emden/Leer, Germany
E-mail: andreas.klein@ux-researchgroup.com;
maria.rauschenberger@hs-emden-leer.de; joerg.thomaschewski@hs-emden-leer.de; mjescalona@us.es
*Corresponding Author
Received 31 March 2021; Accepted 22 July 2021; Publication 22 October 2021
Abstract
Currently, voice assistants (VAs) are trendy and highly available. The VA adoption rate of internet users differs among European countries and also in the global view. Due to speech intelligibility and privacy concerns, using VAs is challenging. Additionally, user experience (UX) assessment methods and VA improvement possibilities are still missing, but are urgently needed to overcome users’ concerns and increase the adoption rate. Therefore, we conducted an intercultural study of technology-based users from Germany and Spain, expecting that higher improvement potential would outweigh concerns about VAs. We investigated VA use in terms of availability versus actual use, usage patterns, concerns, and improvement proposals. Comparing Germany and Spain, our findings show that nearly the same amount of intensive VA use is found in both technology-based user groups. Despite cultural differences, further results show very similar tendencies, e.g., frequency of use, privacy concerns, and demand for VA improvements.
Keywords: Voice user interface, VUI, voice assistant, user experience, UX, context of use, frequency of use, questionnaire.
1 Introduction
Analysts predict growth in the use of digital voice assistants and devices with voice control in the next few years [29]. Notable examples are Alexa (Amazon), Bixby (Samsung), Cortana (Microsoft), Google Assistant (Google) and Siri (Apple). We refer to systems and devices with integrated voice user interfaces (VUIs) [4] as voice assistants (VAs) [11] in the following. A concise and often-quoted definition is: “A voice user interface (or VUI) is what a person interacts with when communicating with a spoken language application.” [4]. When interacting with information technology systems, VUIs enable the user to work without classic input/output devices such as the keyboard and the mouse combined with screens, i.e., graphical user interfaces (GUIs).
On the one hand, VAs are widely available in the consumer sector, as they have been increasingly integrated into smart devices (e.g., Internet of Things), tablets, and personal computers. On the other hand, especially in Germany [28], people have a high degree of skepticism about their use.
The quality of a product or application, including VUIs, can be determined by measuring usability and user experience (UX), which are designed with the well-known Human-Centered Design framework (HCD) [12]. HCD is a standard to develop and evaluate, for example, products with graphical user interfaces (GUI), but there is currently no equal focus on frameworks to develop devices with VUIs. UX of GUI is distinguished from that of VUI, as vocal and hearing abilities are different from the visual ability. To meet the users’ requirements for VA applications in the future, the amount of personal data required could increase, leading to deeper concerns regarding data protection and privacy. Germany is far behind countries such as Italy, Spain, and the United Kingdom in terms of the adoption rate and, globally, Europe is behind countries such as the USA, India, and China [28].
The German BVDW study [6] from 2017 shows that VA user experience correlates with age, as three out of four users (16–24 years old) had already had experiences with VAs. This age group also had the most diverse usage patterns and, at the same time, the most profound concerns about the use of VAs [6]. Therefore, we aim to explore VA use by technology-based target groups, which refers to students of technical courses in Germany and Spain. We expect to find a high potential for improvement and the essential concerns in these target groups to be overcome, eliminating barriers that could keep potential users from using VAs.
This article is based on the pilot study from 2019 that surveyed a concrete target group in Germany [15]. At the end of 2020, we investigated a similar technology-based user group in Spain. This work compares the German and Spanish target groups regarding VA usage behavior, VA context of use, concerns when using VAs, and VA improvement proposals. We aim to partially fulfill the need for VA assessment methods in general, but we also consider the context of use based on concrete target groups with intensive usage patterns. This study shows similar trends when comparing the German and Spanish target groups. For frequency of use, about 61% of each group reported intensive VA use. The groups are also similar in terms of the context of use, as both groups chose selection of media at home as the most frequent use case. Regarding usage concerns and proposals for improvements, we also found an extreme similarity between the German and Spanish user groups. For example, more than every third user in each target group fears being monitored. Therefore, besides enhancing speech intelligibility, improving privacy is the top priority for these user groups.
Our paper is structured as follows: Section 2 presents current aspects of the contemporary use of VAs. Section 3 describes the research method and the structure of the questionnaire used. We report our results in Section 4 and discuss them in Section 5. We finish with our conclusions in Section 6 and proposals for future work in Section 7.
2 Background and Related Work
In this section, we briefly introduce VA requirements regarding usability and UX. Furthermore, we present several studies that explore VA user behavior. The following VA characteristics regarding our technology-based target groups is of particular interest to explore the controversy of high VA availability vs. VA use: frequency of use, context of use, and concerns of users.
UX is a holistic concept, including all types of reactions before, during, and after the use of a product [12]. Measuring UX quality of products that involve GUIs is possible using tools such as the User Experience Questionnaire (UEQ) [19], the meCUE questionnaire [20], or the UEQ+ questionnaire [25], but these are not specific to products with VUI. UX of devices with VUI is not sufficiently considered, as these evaluation tools do not yet measure the user’s expectations of VAs, e.g., comprehensibility, response behavior, or response quality. VAs should capture the context without a particular formulation to fulfill the user’s intentions. UX for voice interaction can be derived from the user, the system, and the context [17].
Existing questionnaires should be extended or a new questionnaire should be created to evaluate VAs, which should lead to improvements in VAs. For example, a new and flexible method is the modular framework UEQ+ based on various scales to construct a product-specific questionnaire for which three VUI scales have been developed but not yet validated [16]. Others, however, focus on exploring current users, use cases, and systems to understand VA interaction, as well as finding design patterns [6, 2, 28]. For example, usability and UX of VUIs were described as usable by a social media-based interest group, but challenges were also identified. Users had difficulties giving long commands, commands had to be given multiple times to accomplish the task, or there were problems with the integration with other systems [22].
A population-representative online survey titled Voice Assistant Consumer Adoption Report (VACAR) [13] conducted with 1,040 US citizens (aged 18 years) shows usage behavior concerning different device groups (smartphone, smart speaker, car) and results on the quality and wishes of VA consumers [13]. It does not explore privacy concerns. A long-term exploration of smart speaker assistants (SSAs) in the US over 110 days focused on how SSAs fit into the household’s daily life and the long-term interaction [1]. They found that users explore commands but not new use cases over time.
An online consumer survey WIK441 [28] conducted in November 2018 in Germany investigated the development of the use of popular VAs. VA usage behavior is representative of the population, based on the quota sample of 18–54 years of age. Among other things, aspects such as the intensity of use, usage patterns, and consumer protection are taken into account. The results confirm the enormous potential of this technology, as 85% of German consumers already had a VA. However, only 26% of Germans use at least one device, probably due to a lack of knowledge about voice commands, privacy concerns, or monitoring. The study revealed that VAs pass on information derived from the continuously buffered data [28].
The SPLENDID RESEARCH (SR) population-representative online survey [27] of 1,006 Germans between 18–69 years old was conducted in January 2019 and investigated, among other things, the extent of VA use and different user groups, but did not focus on technology-based users. The survey shows that 60% of Germans have used at least one known VA. Of these, 30% used them intensively, 32% occasionally, and 38% infrequently. However, 61% of the respondents did not see any sensible use, and 35% mentioned data protection concerns [27].
The October 2017 online BVDW survey [6] of 1,038 participants, representing the German population (aged 16 years), studied usage trends, concerns, and application areas of VAs. For the group of the surveyed German internet users, 56% had already used a VA and 80% found at least one area of application; however, 80% expressed a usage concern. In various survey categories, a subgroup comparison is used to identify certain characteristics in a specific user group. For example, women (52%) use VAs less often than men (62%). Particularly seasoned are those aged 16–24 years, among whom 75% have already had VA user experience. In spite of this, 90% of this group expresses significant concerns [6].
A Spanish online consumer survey Prodigioso Volça [21] of 751 participants was conducted in October 2020 among internet users residing in Spain (aged 18 years). It revealed that nearly 90% know what a VA is and about 60% use one. The number of VA users and the frequency of use continue to rise. Advantages of using VAs that were mentioned by the participants include time saving (39.7%), ability to multitask (29.5%), and convenience. Disadvantages mentioned were that the VA does not always understand (27.0%), the lack of security (9.5%), and incorrect searches or search results (7.3%) [21].
Since technology-based users expressed a more diverse usage pattern and the most notable privacy concerns, we decided to explore this target group by focusing on the challenging aspects of VA applications. Additionally, we want to know if challenges, such as the comprehension of commands, have changed since the latest evaluation of UX in 2019. Therefore, we explore the opinions of both users and non-users about VAs in connection with the current context of use and use frequency. We also intend to discover the risks and opportunities for such systems in the future.
3 Research Methodology
We aim to discover how the target groups currently use VAs by surveying technical-degree students to explore the possibilities and current pitfalls that could deter potential users from using VAs. The research questions (RQ) are:
• RQ1: How frequently are VAs used in our target groups?
• RQ2: In which contexts do the target groups use VAs?
• RQ3: What are the target groups’ VA concerns regarding data protection and privacy?
• RQ4: What VA improvements do the target groups propose?
The RQ1 objective is to determine how intensively the German and Spanish target groups currently use VAs in order to establish VA evaluation methods. RQ2 is to gain insights into capturing the VA context of use to develop context-dependent VA assessment methods in the future. With RQ3, we intend to investigate the target groups’ significant VA skepticism regarding privacy, which contrasts with the intensive VA use of this age group [6, 21]. The purpose of RQ4 is to obtain findings about the target group’s user needs so that flexible VA assessment methods can be developed. To answer our research questions, we decided to develop our own questionnaire, since existing ones are tailored to specific products or other research questions. We conducted a German study in 2019 (n 115) with the German paper-pencil version and a Spanish study in 2020 (n 82) with the English online version. Participants’ average age was 23 years.
3.1 Questionnaire Structure
There are various types of questionnaires: e.g., the Subjective Assessment of Speech System Interfaces (SASSI) [10] mainly used to measure VUI parameters, or the User Experience Questionnaire (UEQ) [19] used to measure usability and UX for GUIs. The UEQ has already been produced in over 30 languages, e.g., Spanish [23]. The modular UEQ+ [25] offers the advantages of focusing on a specific research question, but it currently lacks scales for VUIs. Either the questionnaires do not include VUI parameters, or they are mainly developed for one purpose (without focusing on UX) and cannot be easily adapted to new research purposes. Adaptations such as new VUI parameters being turned into, e.g., the UEQ or UEQ+, are costly in terms of time and personnel. Hence, we designed a questionnaire [15, 18] for our research questions, which contains both qualitative and quantitative elements to explore VUIs and their parameters as well as usability and UX. Its essential aspects are questions about availability and usage, frequency of use, context of use, and potential for improvement.
Table 1 The general structure of the questionnaire with questions 1–6
| No | Question | Type | Answering options |
| 1 | How old are you? | (free text field) | |
| 2 | Gender | Single choice | Male / Female / No information |
| 3 | Which VAs do you have? | Multiple choice | Siri / Alexa / Cortana / Google Assistant / Others (please name): (free text field) / None |
| 4 | Which VAs do you use? | Multiple choice | Siri / Alexa / Cortana / Google Assistant / Others (please name): (free text field) / None |
| 5 | Are there reasons why you have certain VAs, but do not use them? | (free text field) | |
| 6 | How often do you use VAs in total? | Single choice | Several times a day / approximately once a day / several times a week / approximately once a week / several times a month / approximately once a month or less / never (continue with question 9) |
| It depends. Sometimes more, sometimes less, depending on (free text field) | |||
The general questionnaire structure is as follows (See Table 1 for questions 1–6 and Table 2 for questions 7–11): The first page contains the introduction to the study topic regarding an anonymous survey. The socio-demographic data (age, gender) is followed by two questions about availability and which VAs are used (see Table 1). Here, several popular VAs are listed as options and there is a free text field to write in other devices. Question 6 (see Table 1) is about the frequency of use; choosing never allows one to jump directly to question 9 (see Table 2). Question 8 provides two context areas (at home and on the road) containing the same answer choices, and, finally, two environment-independent options. Question 9 offers various response options, e.g., in understanding and responding to requests, data security, and classic input device preferences. Question 10 asks for improvement suggestions regarding aspects such as comprehensibility, VA answering quality, and privacy. Finally, Question 11 includes the general feeling of discomfort when talking to machines.
3.1.1 German questionnaire
The paper–pencil form was chosen to get a direct return from the German participants. The questionnaire was evaluated in two pre-tests with five participants each. After the first pre-test, small changes in the wording and the procedure also allowed the non-user to answer questions about improvements in VAs in order to derive possible reasons for non-use. The second run confirmed the final version of the four-page questionnaire with eleven question areas and the corresponding answer options. The questionnaire starts on the first side with an introduction to the topic and purpose, followed by information about the approximate time required (about 5–10 minutes), and concludes with a note that participation is anonymous and voluntary. The paper–pencil questionnaire is available in German and English [18].
3.1.2 Spanish questionnaire
The online questionnaire realized with Google Forms was chosen because of the COVID-19 pandemic. Spanish students had online courses at the time of the survey. After the pre-test with 15 participants, no changes were necessary. The questionnaire starts on the first side with an introduction to the topic and purpose, followed by information about the approximate time required (about 5–10 minutes), continues with a note that participation is anonymous and voluntary, and concludes by stating that data storage and processing will be confidential. The online questionnaire is available in English [18].
Table 2 The general structure of the questionnaire with questions 7 to 11
| No | Question | Type | Answering options |
| 7 | Why do you use VAs? | Likert-type scale: 1 (highly relevant) to 7 (completely irrelevant) /No statement possible | To save time in everyday life / For more convenience in everyday life / For more security in everyday life (e.g., in a car) / For more fun in everyday life / Because I want to control my smart devices / Because I want to do several things at once / Because I like trying out new technologies / Because I want to talk to ‘someone’ / |
| Free text | Further uses: (free text field) | ||
| 8 | In what environment do you use VAs? | Likert-type scale: 1 (often) to 7 (never) /No statement possible | At home: Smart home / Selection of media (music, TV etc.) / Communication (make phone calls) / Search for files, materials or web searches / On the road: Smart home / Selection of media (music, TV etc.) / Communication (make phone calls) / Search for files, materials or web searches / Do you use dictation functions? (e.g., for emails) /Do you use voice transmission? (e.g., WhatsApp) |
| Free text | Further uses: (free text field) | ||
| 9 | In your opinion, what are the reasons for not using VAs? | Likert-type scale: 1 (highly relevant) to 7 (completely irrelevant) / No statement possible | Because the assistant does not understand me / Because the assistant reacts differently than expected / Because talking to the assistant is unfamiliar / Because my data could be used improperly / Because the devices can monitor me / Because the devices are too expensive / Because the devices are still not fully developed / Because I prefer classic input devices |
| Free text | Further uses: (free text field) | ||
| 10 | What should be improved about VAs? | Likert-type scale: 1 (highly relevant) to 7 (completely irrelevant) / No statement possible | Speech recognition in general / Recognize fast speech / Recognize unclear speech / Ability to answer quicker / Sound more natural / Ability to distinguish between users / Ability to recognize feelings and take them into account / Increase learning ability / Additional interaction e.g. touchscreen for corrections / Better integration with other speech-controlled devices / Better protection of privacy |
| Free text | Further improvement suggestions: (free text field) | ||
| 11 | General feelings | Likert-type scale: 1 (highly relevant) to 7 (completely irrelevant) / No statement possible | It is somehow unnatural to talk to machines. / I feel uneasy when machines speak like humans. / I feel uneasy when machines speak ‘artificially’. |
| Free text | Further feelings: (free text field) |
3.2 Procedure
We conducted the German survey at the University of Applied Sciences Emden/Leer, Germany, in 2019, and the Spanish survey at the University of Seville, Spain, at the end of 2020. Details about the German and Spanish study procedures and the surveyed participants are provided in the following.
We collected our data from different seminars of three technical courses of study (electrical engineering, computer science, media technology) with the paper–pencil questionnaire between March and April 2019 at the University of Applied Sciences Emden/Leer, Germany. The participants were informed by one of the authors about the purpose of the voluntary study. Following a brief introduction, the questionnaire was distributed among the students and collected after approximately 12 minutes of processing time.
In December 2020, we invited by email students from technical courses of informatics engineering – software engineering in the branch of engineering and architecture at the University of Seville in Spain to participate in the online survey. In the first section of the questionnaire, we provided the students with information about the purpose, the processing time (5–10 minutes), voluntary participation, and confidentiality (data storage and processing) of the anonymous survey.
3.3 Participants
Filling out Likert-type scales carries the risk that the participants may overlook the scales, leading to missing data. We did not require a response in each row of our Likert-type scales (Google forms settings) by the Spanish participants; in the same way, we could not expect the German participants to fill out the paper-pencil questionnaire without missing any responses. That led, in some cases, to the exclusion of participants regarding fill-out errors, which is described in detail in the following.
Table 3 Overview of the German and Spanish participants
| German participants | Spanish participants | |||
| Group | Number | % | Number | % |
| Total | 115 | 100.0 | 82 | 100.0 |
| No VA availability | 14 | 12.2 | 8 | 9.8 |
| VA availability | 101 | 87.8 | 74 | 90.2 |
| Users VA | 52 | 51.5 | 56 | 75.7 |
| Non-users VA | 49 | 48.5 | 18 | 24.3 |
| Non-users VA, no VA availability | 63 | 54.8 | 26 | 31.7 |
We analyzed our German participants (n 115) and Spanish participants (n 82) by their responses (see Table 3): No VA availability/ VA availability; we split participants with a VA available into Users and Non-users VA. Multiple answers are possible for which systems are available and used (see Figure 1). We evaluate the results of 115 German participants, 91 of which were male (79%), 22 female (19%), and two with no gender specified. The average age of the participants was 23 years (SD 3 years). Twelve participants are excluded from the survey due to more than two missing responses.
We evaluate 82 Spanish participants, 72 of which were male (87.8%), 9 female (10.8%), and one with no gender specified. The average age of the participants was 23 years (SD 8 years). The high standard deviation (SD 8) is due to the inclusion of older students who had previously stopped their studies and resumed at a later stage in life (age 40, n 5). One participant is excluded from the survey due to incomplete responses (questions 5 and 6).
First, participants indicated their availability of VAs (German n 115; Spanish n 82) and the types of VAs used. As a result of our German survey, Table 3 and Figure 1 show that 87.8% (n 101) had access to at least one VA, among which 51.5% (n 52) used one or more devices and 48.5% (n 49) did not use any. Google Assistant was used most often by the German participants, with 28.7% (n 29), followed by Amazon’s Alexa with 15.8% (n 16) and Apple’s Siri with 12.9% (n 13). The findings from our Spanish survey reveal that 90.2% (n 74) had access to at least one VA, among which 75.7% (n 56) used one or more devices and 24.3% (n 18) did not use any. Google Assistant is the most highly-rated VA by the Spanish participants, with 41.9% (n 31), followed by Amazon’s Alexa with 24.3% (n 18) and Apple’s Siri with 20.3% (n 15). Except for question 5, the free-text fields were mainly not filled out and did not provide any relevant insights [18]. In the following, we provide the results for our four research questions.
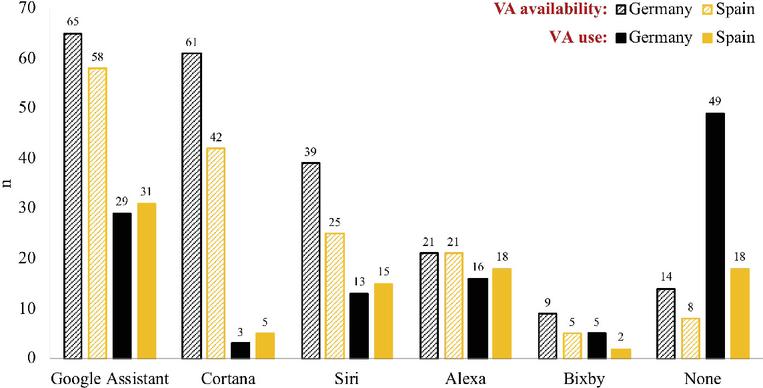
Figure 1 VA availability and VA use of German and Spanish participants.
4 Results
The statistical analysis was carried out using Microsoft Excel for Mac Version 16.36. The collected answers are overall opinion-independent from the brand. All figures display the German results in black and the Spanish ones in orange. In the following sections, we compare the means of the seven-point Likert-type scale results in the numeric range between 3 and 3, with the zero-point at Likert-type scale value 4. Visualizing the confidence intervals is good practice, although due to our small sample sizes and the widespread answers, we cannot yet draw reliable conclusions from the confidence intervals.

Figure 2 Frequency of use of German users (n 49) compared to Spanish users (n 56).
4.1 RQ1: How Frequently are VAs Used in Our Target Groups?
We derive two user groups for the frequency of use shown in Figure 2. The intensive German (61.2%, n 30) and Spanish users (60.7%, n 34) report a usage time of several times a day to several times a week, while the occasional German (38.8%, n 19) and Spanish users (39.3%, n 22) report usage as approximately once a week to approximately once a month or less. Figure 2 is based on the German participants (n 49) because two participants answered question 6 (see Table 1) in free text “sometimes” and “while driving”, and one respondent did not provide any pertinent usage time information. Every fourth German and every fourth Spanish participant in this study report using VAs several times a day. More than 1 in 5 of our German users use VAs approximately once a day. More than 1 in 5 of our Spanish users use VAs several times a week. Overall, we get 61% VA intensive users and 39% VA occasional users in the German and Spanish target groups combined.
4.2 RQ2: In Which Contexts Do the Target Groups Use VAs?
The participants evaluated four typical VA use cases combined with the frequency of use and whether they are at home or on the road when using. Furthermore, they evaluate the use of dictation function and voice transmission independent of the environment. Figure 3 shows the Likert-type scale results in the numeric range between 3 (never) and 3 (often). The error indicators visualize the confidence intervals. Details (mean, standard deviation, and confidence) are available in the protocol [18].
Comparing both studies, our outcomes display the highest value for selection of media at home (German mean 0.6, Spanish mean 0.9), as shown in Figure 3. We find the lowest values for smart home on the road (2.4) and web searches on the road (1.8) for the German users, but dictation function (1.7) and smart home on the road (1.4) for the Spanish users.
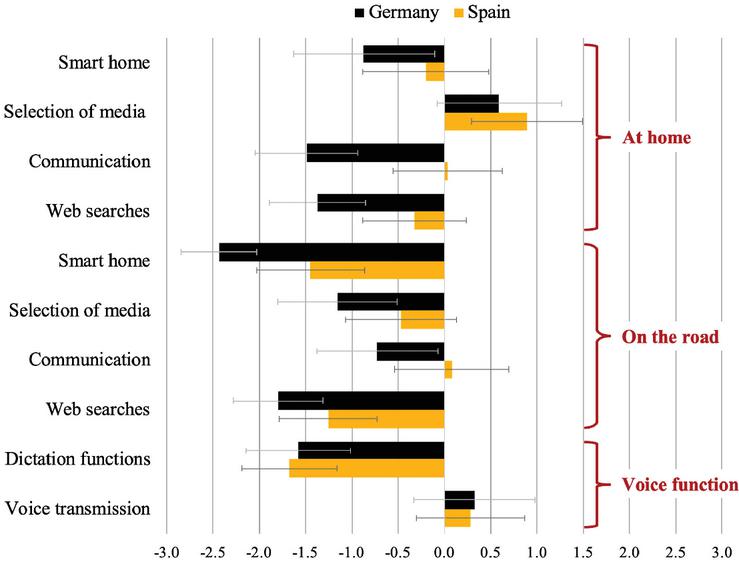
Figure 3 VA Context of use of German users (n 52) compared to Spanish users (n 56).
4.3 RQ3: What Are the Target Groups’ VA Concerns Regarding Data Protection and Privacy?
When asking about VA non-use, we consider our findings focused on privacy issues to answer RQ3. Comparing Germany and Spain, Figure 4 displays on the left side the results for users, on the right side those for non-users, and in the middle all possible answer options. The Likert-type scale results are in the numeric range between 3 (completely irrelevant) and 3 (highly relevant). The error indicators visualize the confidence intervals. Details (mean, standard deviation, and confidence) are available in the protocol [18].
The mean ratings for the privacy issues were between 0.6 and 1.3 for German users and non-users combined. Spanish users scored them as neutral on average, while Spanish non-users showed a trend similar to that of German non-users.
Table 4 Relevance assessment of German users (n 52) and Spanish users (n 56) compared to German non-users (n 49) and Spanish non-users (n 17) on privacy issues
| Users | Non-users | |||||||||||||||
|
|
|
|
|||||||||||||
| Germany | Spain | Germany | Spain | Germany | Spain | Germany | Spain | |||||||||
| relevant | 36.5% | 33.9% | 40.4% | 35.7% | 57.1% | 42.2% | 57.1% | 53.9% | ||||||||
| irrelevant | 17.3% | 28.6% | 13.5% | 33.9% | 8.2% | 22.4% | 10.2% | 23.5% | ||||||||
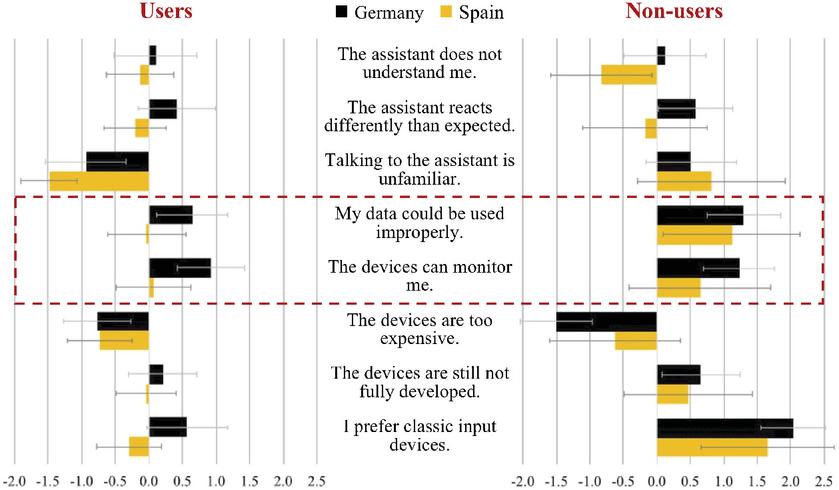
Figure 4 Reasons for VA non-use of German users (n 52) and Spanish users (n 56) on the left compared to German non-users (n 49) and Spanish non-users (n 17) on the right.
Based on these results, we made a further evaluation of the Likert-type scale and grouped the two highest ratings as relevant and the two lowest as irrelevant. Specifically, e.g., we summed the numbers of the two highest German user scores and divided that by the total number of German users to get the percentage. We present relevant/irrelevant shares regarding privacy issues in Table 4. More than every third German user (36.5%), Spanish user (33.9%) and Spanish non-user (42.3%), and even more than every second German non-user (57.1%) classified the device can monitor me as relevant. Similar results are shown for my data could be used improperly for German users (40.4%) and Spanish users (35.7%), as well as with German non-users (57.1%) and Spanish non-users (53.5%).
4.4 RQ4: What VA Improvements Do the Target Groups Propose?
Comparing our German and Spanish participants in terms of their proposals for VA improvements, Figure 5 displays on the left side the results for users, on the right side those for non-users, and in the middle all possible answer options. The Likert-type scale results are in the numeric range between 3 (completely irrelevant) and 3 (highly relevant). The error indicators visualize the confidence intervals. Details (mean, standard deviation, and confidence) are available in the protocol [18].
For the German users (Figure 5 left side), better protection of privacy (2.0) shows the highest scoring for improvements, followed by increase learning ability (1.7) and speech recognition in general (1.6). We also find high values for ability to distinguish between users, recognize unclear speech and recognize fast speech. The Spanish users (see Figure 5 left side), also scored highest better protection of privacy (1.8) and increase learning ability (1.8), followed by recognize fast speech (1.5). They also gave high scores for recognize unclear speech and speech recognition in general.
The German non-users rating VA enhancement (see Figure 5 right side) gave the highest value to better protection of privacy (2.6), followed by recognize unclear speech (1.9), speech recognition in general (1.8) and recognize fast speech (1.8). The Spanish non-users (see Figure 5 right side) also rated highly better protection of privacy (1.9) as a proposal to improve VAs. In addition, they gave high scores to recognize fast speech, increase learning ability, speech recognition in general and recognize unclear speech.
The tendency of the first three response options (speech recognition in general, recognize fast speech, recognize unclear speech) to be rated highly by the target groups led to the investigation of statistical similarity. We combined the results of the correlation analysis in one table for both the German and the Spanish participants (see Table 5). Above the diagonal line, which indicates () in each case, are the German participants’ correlation values. Below are those for the Spanish ratings. This reveals a high correlation () between the three answer options within a target group, except for the moderate correlation () between speech recognition in general and recognize unclear speech for the German target group [3]. In summary, we have high scores for the privacy issues and speech answer options in both target groups for users and non-users.
Table 5 Correlation of speech answer options compared between the German (above the diagonal line with ) and Spanish participants (below the diagonal line with )
| Recognize fast | Recognize unclear | ||
| Speech recognition | speech | speech | |
| Speech recognition | 1 | 0.6 | 0.4 |
| Recognize fast speech | 0.7 | 1 | 0.7 |
| Recognize unclear speech | 0.8 | 0.8 | 1 |

Figure 5 VA improvement proposals of German users (n 52) and Spanish users (n 56) on the left compared to German non-users (n 49) and Spanish non-users (n 17) on the right.
5 Discussion
We aim to explore how VAs are used by comparing concrete technology-based target groups from Germany and Spain. We expect the Spanish study results to confirm the findings on VA use from our German study [15], provide new insights into the use of VAs by the Spanish target group, and reveal culture-dependent differences.
We accept the imbalanced distribution of gender in our data (German participants with 79% male and 19% female; Spanish study with 88% male and 11% female) since women are underrepresented in technical courses in Germany and Spain. In the academic year of 2019/2020, 66% of first-year students in STEM courses (science, technology, engineering, and mathematics, former technology) at German universities were male [8]. The distribution of students enrolled at Spanish universities (academic year 2018/2019) is similar, with 75% male in the fields of engineering and architecture [7]. Other comparative studies show similar gender distributions, with 77% or 72% male participants [22, 26].
Due to COVID-19 restrictions, students had online courses in Spain; hence, we used different questionnaires (German language paper-pencil questionnaire for the German participants; English language online questionnaire for the Spanish participants). We did not find any influence on the surveys when using different questionnaires or languages. In the following section, we discuss availability and use, frequency of use, context of use, and improvement proposals for using VAs.
5.1 VA Availability and VA Use
Comparing VA availability to VA use (see Figure 1) for our target groups reveals similar tendencies, e.g., Google Assistant is the most available (Germany 56,5%; Spain 70.7%) and most used VA (Germany 28.7%; Spain 41.9%), followed by Siri and Alexa. We expected a high availability of Google Assistant and Siri because these assistants are preinstalled on widely used operating systems.
A population-representative German study confirms our findings, e.g., 56% of the German online users chose the Google Assistant in 29% of cases and Siri in 22% of cases, followed by Alexa and Cortana [6]. In Spain, Google Assistant leads with 59.4% (advantage in the mobile market of Android with 90.7%), followed by Siri with 28.2% (due to the popularity of Apple devices) and Alexa with 13.8%, according to a population-representative survey [21].
The VA adoption rate among internet users is well above the European average in Spain and well below it in Germany [28]. Therefore, we expected a lower proportion of our Spanish target group to be VA non-users. The results (see Table 3 and Figure 1) confirm this assumption because 48.5% of the German and 24.3% of the Spanish technology-based users have no interest in VA use. The high number of Spanish VA users (75.7%) in our investigation can be explained by this target group’s technical affinity.
The use frequencies given by our German and Spanish participants (see Figure 2) show very similar results for intensive (%) and occasional (%) use, revealing that technology-based users are intensive users. The SR [27] study applied the same subdivisions to define meaningful user groups. Population-representative German surveys result in 30% intensive users (daily and several times a week), 32% occasional users (weekly, several times a month, and monthly), and 38% rare users [27]. In Spain, the number of VA users increases, but so does the use frequency (27.4% daily and 20.7% at least once a week) [21]. In summary, we see the choice of concrete technology-based target groups in our study as confirmed. Overall, our limited data results are in line with current studies, as we demonstrated above.
5.2 VA Context of Use
Comparing our German and Spanish participants displays a related trend regarding VA context of use (see Figure 3). The most often use case is selection of media at home; however, most of the application fields were evaluated negatively in both target groups. We expected selection of media and web searches to have higher rankings because of other surveys’ results. An American long-term study illustrated, e.g., that in daily VA use, 40% of the requests are for music procurement and 17% for information [1]. Another Spanish study demonstrated that, e.g., searching on the web (71.8%) results in the highest ranking for mobile phone and tablet users [21].
Our German and Spanish participants rated the use case communication at home with means of 1.5 and 0.0 respectively. We assume that this might be culture-dependent, e.g., according to differences between spoken German and Spanish. Interestingly, a conflict exists between the negative values for communication and the positive values for voice transmission, which is probably due to the different contexts of use. Communication is a command structure (i.e., the instruction to make a phone call), while voice transmission is purely a voice message. This example demonstrates the importance of precisely defining the context of use when evaluating VAs. In summary, except for selection of media at home and voice transmission, the target groups accept that the usage environments and use cases have not been studied enough (see Figure 3).
5.3 Participant Concerns
Our findings present a strong similarity between the German and Spanish participants in terms of concerns about how the VA could monitor them. We consider additionally the comparison between our users and non-users, which also results in similarity. The same trend shows that data misuse is of great concern, as more than every third user also rated it as relevant (see Table 4).
As we expected, our target groups’ main concerns are data misuse and monitoring, as this was expressed by both users and non-users. Other population-representative surveys indicated, e.g., that every third German user fears data misuse and monitoring or interception by others, and every fourth Spanish smart speaker user is concerned about a lack of privacy [6, 21]. In line with this, our target groups, despite more intensive use, expressed significant concerns about monitoring and data misuse. The quality of the accurate command execution of VAs currently depends on the ability to understand the context. For example, User: “Siri, how many inhabitants does Hamburg have?” Siri: “In 2019, the population of Hamburg was 1,899,160.” User: “And in Seville?” Siri: “I found this online about ‘And in Seville’.” [15]. The more information available to the VA system, the more accurately it can react. At the same time, this means that more data is collected and transmitted, which increases the user’s concerns about data protection and privacy [28]. Additionally, American participants express preferences for the input of data using VA from non-private information over private information. As private information is unwillingly submitted to VAs in public places in the presence of other people, it is perceived as unacceptable [5].
5.4 Possible VA Improvements
As a result, comparing our German and Spanish participants by surveying VA improvement proposals illustrates a high similarity regarding the first three response options (see Figure 5). The high correlation of these options, displayed in Table 5, enables them to be summarized in the category speech intelligibility. Another category could be response quality, which combines other answer options such as ability to answer quicker, sound more natural, ability to distinguish between users, and ability to recognize feelings. These categories merge appropriate response options as, e.g., the voice quality scales of the UEQ+ framework, which contain four bipolar item-pairs with 7-point Likert-type scales [25, 16]. These scales contain very similar product characteristics as those that are assigned to UX aspects. A factorial analysis should be carried out for a more detailed examination of these categories.
We expected high quotas for better protection of privacy because, e.g., VAs’ function is based on a switched-on microphone in stand-by modus. We also assumed there would be improvement requirements regarding speech intelligibility because of, e.g., understanding the context in which the VA is used. To improve VAs and meet users’ needs, the context of use has to be captured comprehensively [14].
Our results are in line with the existing literature in that the technology-based German target group expresses negative thoughts towards data protection and speech intelligibility. A German study identified three clusters for positive and negative features regarding the most frequently used general-purpose VAs. The positive features are specific function, interaction and positive emotions, while negative features include speech recognition and dialogue, trust and security, and system and functionality [2]. That technology-based users display deep concerns about privacy issues could be explained by the regularly appearing security news of, e.g., DDoS-Attacks with the Internet of Things [24]. Already in 2014, Americans expressed privacy concerns about using Voice-Activated Personal Assistants (VAPA) in public [5]. A Spanish study revealed the main disadvantages of using VAs: lack of speech intelligibility (27%) and security/privacy (9.5%) [21].
To sum up our study: data protection seems to be a particular challenge when dealing with VAs, as users and non-users of our target groups mostly requested better privacy protection. Our findings suggest that some non-users would probably become users if privacy and speech intelligibility were enhanced.
5.5 Limitations
This study is limited to concrete technology-based target groups from Germany and Spain. Therefore, no conclusions can be drawn for this target group within the EU as a whole. Future studies should consider additional EU countries and be extended to include other target groups. The German study occurred before the COVID-19 pandemic, while the Spanish study took place during it. According to a representative Spanish survey, 19% of participants reported using VAs more during the pandemic [21]. Therefore, a bias in the Spanish results can be expected when comparing the two studies. This bias should be investigated in a further study. When asked about the availability and use of VAs (questions 3 and 4), participants could select multiple answers. Unfortunately, parallel use of different VAs cannot be recorded, nor can the use of different hardware, as the question was not explicitly asked for each device. These aspects should be taken into account in the future.
6 Conclusion
We surveyed how general-purpose VAs are currently used in concrete technology-based target groups in Germany and Spain. The target groups’ comparison confirms our assumption and previous results that technology-based users are intensive users. Despite cultural-dependent differences between Germany and Spain, we explored in our study similar privacy concerns, lack of command execution accuracy, and VA improvement requirements. More than every third user classifies monitoring and even more than every second non-user data misuse as relevant in our German and Spanish target groups. We found that selection of media and voice transmission are primary use cases in both our technology-based user groups. Our results regarding the VA usage environment and use cases have not been explored enough. The context influences UX in HCI significantly [9], therefore more data is needed to capture the context of use; however, this is contrary to our users’ demand for better protection of privacy.
Our findings can stimulate the discussion about overcoming privacy issues, understanding the VA context of use comprehensively, and improving speech intelligibility. All of these are barriers to increasing VA usage and convincing skeptics to use VAs. If researchers and engineers take the users’ needs and reservations into account by applying, e.g., flexible VA assessment methods while considering the VA context of use, then VA technology can probably revolutionize HCI in the long term.
7 Future Work
Our findings present concerns and expectations from concrete technology-based users and our study could be replicated every year in this and other user groups to better understand users’ needs and evolution. Understanding the context of use in which the user applies VAs should be a focus of further research. Therefore, we plan observations and structured interviews with VA intensive users to almost entirely survey the VA usage environment. Intensive VA users can encompass a wide range of user groups, such as persons with disabilities. Therefore, we intend to ask them about how they use VAs in order to identify research gaps regarding assessment methods and the VA context of use [14]. Our study results can help extend measurement methods, e.g., scale construction for the UEQ+ framework regarding VUI assessment [16]. Hence, we must define relevant UX criteria depending on the VA use case and apply the factorial analysis to identify single factors [17]. Furthermore, an extension of the UEQ+ framework is in progress to capture the context of use generally, especially for VUI devices. The UEQ+ framework is an essential part of a planned UX measurement toolbox for VUIs, allowing one to select a suitable assessment method to evaluate a VUI test object [14].
Acknowledgements
This work was supported by the NICO project (PID2019-105455GB-C31) from the Ministerio de Ciencia, Innovación y Universidades (Spanish Government).
References
[1] Frank Bentley, Chris Luvogt, Max Silverman, Rushani Wirasinghe, Brooke White, and Danielle Lottridge. Understanding the Long-Term Use of Smart Speaker Assistants. Proc. ACM Interact. Mob. Wearable Ubiquitous Technol., 2(3), sep 2018.
[2] Maresa Biermann, Evelyn Schweiger, and Martin Jentsch. Talking to Stupid?!? Improving Voice User Interfaces. In Holger Fischer and Steffen Hess, editors, Mensch und Computer 2019 - Usability Professionals, Bonn, 2019. Gesellschaft für Informatik e.V. Und German UPA e.V.
[3] Jacob Cohen. Statistical power analysis for the behavioral sciences. Academic press, 2013.
[4] Michael H. Cohen, James P. Giangola, and Jennifer Balogh. Voice User Interface Design. Addison-Wesley, 2004.
[5] Aarthi Easwara Moorthy and Kim-Phuong L Vu. Voice Activated Personal Assistant: Acceptability of Use in the Public Space. In Sakae Yamamoto, editor, Human Interface and the Management of Information. Information and Knowledge in Applications and Services, pages 324–334, Cham, 2014. Springer International Publishing.
[6] BVDW e.V. Digital Trends Umfrage zu digitalen Sprachassistenten. Technical report, Bundesverband Digitale Wirtschaft (BVDW) e.V. Bundesverband Digitale, 2017.
[7] Fernando Forte. Distribution of university students enrolled at Spanish universities in 2018/2019, by field of study and gender, 2020.
[8] Statista GmbH. STEM first-year students at German universities by 2019/2020, 2020.
[9] Marc Hassenzahl and Noam Tractinsky. User experience - a research agenda. Behaviour & Information Technology, 25(2):91–97, 2006.
[10] Kate Hone. Usability measurement for speech systems : SASSI revisited. In Proceedings of CHI, 2014.
[11] Matthew B Hoy. Alexa, Siri, Cortana, and More: An Introduction to Voice Assistants. Medical Reference Services Quarterly, 37(1):81–88, 2018.
[12] ISO 9241-210:2019. Ergonomics of human-system interaction — Part 210: Human-centred design for interactive systems. Technical report, https://www.iso.org/committee/53372.html, 2019.
[13] Bret Kinsella and Ava Mutchler. Voice Assistant Consumer Adoption Report. Technical report, voicebot.ai PullString.com RAIN.agency, 2018.
[14] Andreas M. Klein. Toward a User Experience Tool Selector for Voice User Interfaces. In Proceedings of the 18th International Web for All Conference, W4A ’21, New York, NY, USA, 2021. Association for Computing Machinery.
[15] Andreas M. Klein, Andreas Hinderks, Maria Rauschenberger, and Jörg Thomaschewski. Exploring Voice Assistant Risks and Potential with Technology-based Users. In Proceedings of the 16th International Conference on Web Information Systems and Technologies - Volume 1: WEBIST,, pages 147–154. INSTICC, SciTePress, 2020.
[16] Andreas M. Klein, Andreas Hinderks, Martin Schrepp, and Jörg Thomaschewski. Construction of UEQ+ Scales for Voice Quality. In Proceedings of the Conference on Mensch Und Computer, MuC ’20, pages 1–5, New York, NY, USA, 2020. Association for Computing Machinery.
[17] Andreas M. Klein, Andreas Hinderks, Martin Schrepp, and Jörg Thomaschewski. Measuring User Experience Quality of Voice Assistants. In 2020 15th Iberian Conference on Information Systems and Technologies (CISTI), pages 1–4, jun 2020.
[18] Andreas M. Klein, Maria Rauschenberger, Jörg Thomaschweski, and Maria José Escalona. Protocol for Comparing Voice Assistant Risks and Potential with Technology-Based Users: A Study from Germany and Spain. Technical report, https://www.researchgate.net/, 2021.
[19] Bettina Laugwitz, Theo Held, and Martin Schrepp. Construction and Evaluation of a User Experience Questionnaire. In Andreas Holzinger, editor, HCI and Usability for Education and Work, pages 63–76, Berlin, Heidelberg, 2008. Springer Berlin Heidelberg.
[20] Michael Minge and Laura Riedel. meCUE – Ein modularer Fragebogen zur Erfassung des Nutzungserlebens. In In: S. Boll, S. Maaß & R. Malaka (Hrsg.): Mensch und Computer 2013: Interaktive Vielfalt (S. 89-98)., 2013.
[21] Prodigioso Volcán. With P from pandemic podcast II Voice and audio study in Spain, 2020.
[22] Aung Pyae and Tapani N Joelsson. Investigating the Usability and User Experiences of Voice User Interface: A Case of Google Home Smart Speaker. In Proceedings of the 20th International Conference on Human-Computer Interaction with Mobile Devices and Services Adjunct, MobileHCI ’18, pages 127–131, New York, NY, USA, 2018. Association for Computing Machinery.
[23] Maria Rauschenberger, Martin Schrepp, Manuel Cota, Siegfried Olschner, and Jörg Thomaschewski. Efficient Measurement of the User Experience of Interactive Products. How to use the User Experience Questionnaire (UEQ). Example: Spanish Language Version. International Journal of Interactive Multimedia and Artificial Intelligence, 2:39–45, 2013.
[24] Dennis Schirrmacher. Source Code von mächtigem DDoS-Tool Mirai veröffentlicht, 2016.
[25] Martin Schrepp and Jörg Thomaschewski. Design and Validation of a Framework for the Creation of User Experience Questionnaires. International Journal of Interactive Multimedia and Artificial Intelligence, pages S. 88–95, 2019.
[26] Alex Sciuto, Arnita Saini, Jodi Forlizzi, and Jason I Hong. ”Hey Alexa, What’s Up?”: A Mixed-Methods Studies of In-Home Conversational Agent Usage. In Proceedings of the 2018 Designing Interactive Systems Conference, DIS ’18, pages 857–868, New York, NY, USA, 2018. Association for Computing Machinery.
[27] SPLENDID RESEARCH GmbH. Digitale Sprachassistenten, 2019.
[28] Serpil Tas, Christian Hildebrandt, and René Arnold. Voice Assistants in Germany. WIK Wissenschaftliches Institut für Infrastruktur und Kommunikationsdienste GmbH, 2019. Nr.441.
[29] Sven Tuzovic and Stefanie Paluch. Conversational Commerce – A New Era for Service Business Development?, pages 81–100. Springer Fachmedien Wiesbaden, Wiesbaden, 2018.
Biographies

Andreas M. Klein is a lecturer and research assistant in the Faculty of Technology at the University of Applied Sciences Emden/Leer, Germany. He teaches in the online courses of Media and Business Informatics and in the Media Technology presence course. Since September 1, 2020, Andreas has been a Ph.D. candidate in the Department of Computer Languages and Systems at the University of Seville, Spain. The research focus of his dissertation is the investigation of voice assistant systems. Andreas holds a diploma in Electrical Engineering and a Master of Engineering in Technical Management.

Maria Rauschenberger is a full professor for Digital Media at the University of Applied Sciences in Emden/Leer. Before that, she was a postdoc at the Max-Planck Institute for Software Systems in Saarbrücken, a research associate at the OFFIS – Institute for Information Technology in Oldenburg, and a Product Owner at MSP Medien Systempartner in Bremen/Oldenburg. Maria did her Ph.D. at the Universitat Pompeu Fabra in the Department of Information and Communication Technologies, where she graduated in 2019 with the highest outcome: Excellent Cum Laude and International Mentioned. Her thesis focused on the design of a language-independent content game for early detection of dyslexia in children. Maria has been designing user-centric digital applications/media for years and has focused on human-computer interaction, machine learning, accessibility, and gamification. Her research interest is about how to solve social issues with computer science techniques. Her work has been awarded three years in a row in Germany with a special scholarship (fem:talent, 2016 – 2018) as well as with the prestigious German Reading 2017 award and the second place of the Helene-Lange-Preis in 2020.

Jörg Thomaschewski received a Ph.D. in physics from the University of Bremen (Germany) in 1996. He became a full professor at the University of Applied Sciences Emden/Leer (Germany) in September 2000. His teaching and research focus is on Human-Computer Interaction, UX-Management, Agile Software Development, and Requirements Engineering. In 2012 he founded the research group “Agile Software Development and User Experience”. Dr. Thomaschewski published more than 100 articles in his fields of research and has extensive experience in user experience training, development of UX questionnaires, agile methods, IT analysis, and consulting.

Maria José Escalona received her Ph.D. in Computer Science from the University of Seville, Spain in 2004. Currently, she is a full professor in the Department of Computer Languages and Systems at the University of Seville. She manages the web engineering and early testing research group. Her current research interests include the areas of requirement engineering, web system development, model-driven engineering, early testing and quality assurance. She also collaborates with public companies like the Andalusian Regional Ministry of Culture and Andalusian Health Service in quality assurance issues.
Journal of Web Engineering, Vol. 20_7, 1991–2016.
doi: 10.13052/jwe1540-9589.2071
© 2021 River Publishers