Research on Data Fusion Method of Multi-source Complex System
Yuxiang Cai
Shanghai Jiao Tong University, Shanghai, China;
State Grid Fujian Information & Telecommunication Company, Fuzhou, China
E-mail: caiyuxiang@sjtu.edu.cn
Received 26 April 2021; Accepted 28 May 2021; Publication 28 April 2021
Abstract
Multi source fusion of data collected by various sensors to realize accurate perception is the key basic technology of the Internet of things. At present, there are many problems in the fusion of various kinds of data collected by sensors, such as more noise and more null values. In this paper, the fuzzy neural network algorithm is proposed to establish the model, combined with the Delphi method and the null value estimation method based on the prediction value to construct the data fusion system. This method has rich application scenarios in the construction of IOT system in the field of power and energy.
Keywords: Artificial neural network, fuzzy neural network, Data fusion algorithm, Multi-platform sensor.
1 Introduction
Multi-platform sensor and multi-source data fusion was first proposed by American scholars in the 1980s. A series of achievements have been made in the field of system structure, state fusion and energy efficiency evaluation in foreign countries, and it has been applied in the military. However, the domestic research is basically in its infancy. Because the foreign research is mainly used in the military field, there are few channels to learn from in China. Moreover, the demand for multi-source data collection of multi-platform sensors in the early stage is not urgent. Limited by the impact of communication transmission bandwidth and quality, it cannot meet the requirements of quasi real-time large data transmission. Therefore, the domestic research in this direction The progress of research is also slow, basically staying in the research of basic concepts. At the same time, compared with the military, the civilian collection and transmission protocol is more abundant, the transmission content is more, but the reliability is lower. Therefore, in the civil field, the research direction is different from the military for the unreliable data transmission of the complex heterogeneous platform.
With the popularity of 4G and the large-scale commercial use of 5g, the bandwidth limit of sensors transmitting more accurate data to the background is gradually broken. The perception demand of large state-owned enterprises for terminal equipment and station buildings has become an urgent driving force for the implementation of the Internet of things. Integrating all kinds of sensor data, transmitting data to the cloud through multiple platforms and carrying out data fusion analysis, it has become an urgent need for enterprises to master the edge conditions more comprehensively to improve their benefits.
This paper mainly analyzes the multi-sensor data, points out the existing problems, including the basic principle, functional model, hierarchical structure and fusion method, as well as the space-time registration and performance evaluation method for multi-source complex system.
1.1 Basic Principles, Fusion Levels and Models of Data Fusion in Complex Systems
1.1.1 Basic principles
MSDF can mimic the state of the human brain when it synthesizes complex problems. MSDF uses multiple sensor resources to reasonably control and utilize the sensor information, and combines the information of the sensor in space or time, so that the information system has superior performance. MSDF can be interpreted as: information and data detection, correlation, estimation and synthesis of multi-stage, multi-faceted processing, so as to get the exact state and category, determine the situation and threat estimation. According to the hierarchical classification of data abstraction, fusion can be divided into three levels, and the specific hierarchical situation is shown in Figure 1.
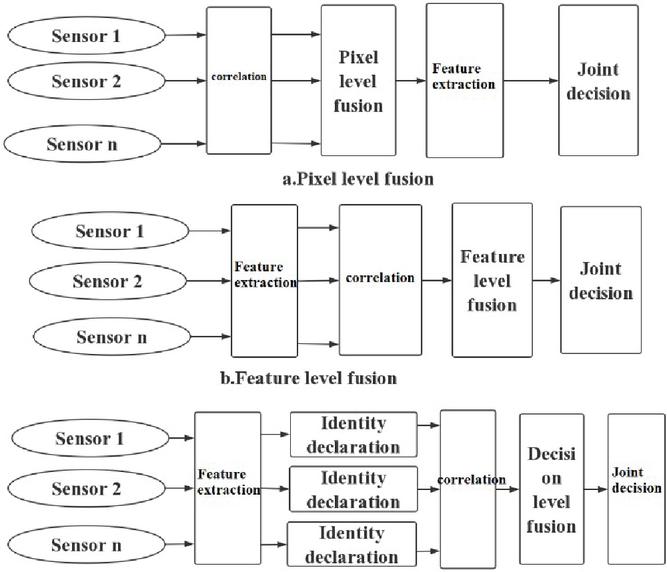
Figure 1 Illustrates the data fusion hierarchy of data abstraction.
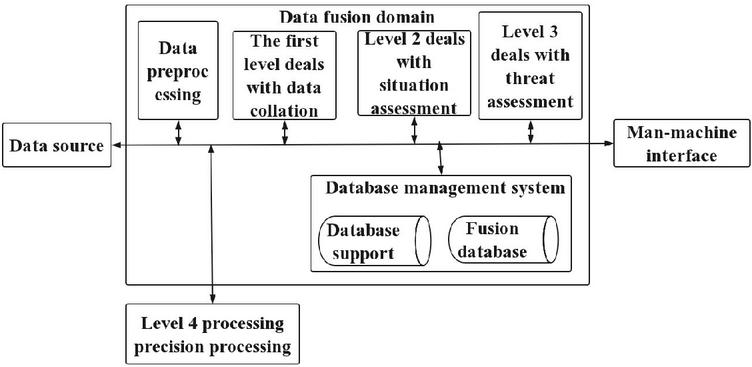
Figure 2 JDL data fusion model.
The structure of data fusion is described from different angles, and one or more data processing structures are adopted from the functional layer. For example, the location level fusion is divided from the fusion function. See Figure 2 below for details of its specific hierarchy [1–5].
1.1.2 Research direction and existing problems of data fusion of complex systems
In China, the research on data fusion just started, mainly focusing on the algorithm of target tracking and recognition and the conceptual design and discussion of multi-sensor and multi-soure data fusion platform. Because the technique of data fusion involves the research and application in the military field, there is a great degree of secrecy about this research, and the key technology is even more blocked. Data conversion, correlation and fusion algorithm are still the research focus of domestic data fusion, and multi-objective and tracking are also hot issues in domestic and foreign research under the complex background, all of which are highly valued by all parties.
At present, it is very urgent to realize unattended power station building through omni-directional perception. However, station state perception needs to integrate all kinds of sensor information scattered on multiple platforms, such as the ambient temperature and humidity collected by the traditional dynamic and environmental monitoring system, UPS and electric power cabinet voltage, current and other information collected by traditional power environment monitoring system, target tracking and recognition information of camera image and video class collected by unified video platform, and running state of information equipment collected by integrated network management system. Modular cabinet monitoring module also collects data such as temperature inside cabinet, video, air conditioning status, door switch and access information. The wearable devices of operators also collected relevant video and location information.
Therefore, it is urgent to solve the problem of false alarm and missed alarm caused by single platform or single sensor by information fusion technology. On the one hand, it can eliminate redundant and contradictory information. On the other hand, realize information complementarity, better identify and eliminate alarm errors, form a relatively complete consistency description of the system environment, help improve the accuracy of decision – making, and reduce decision – making risk.
This paper holds that the above multi-platform and multi-dimension data fusion and MSDF database construction are needed to achieve accurate monitoring of the status of the computer room, but there are few studies on this in China. To some extent, the data integrity and accuracy of topological relationships in MSDF databases determine the recognition rate of targets and identities to some extent. Therefore, on the one hand, we need to fully obtain various target platforms and their feature data; on the other hand, how to determine the appropriate feature vector dimensions and feature vectors of the database is also the main content of the database construction. See Figure 3 below for the specific architecture diagram.
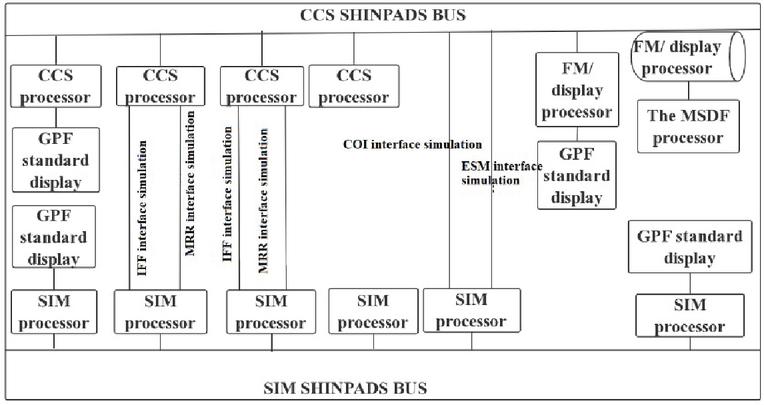
Figure 3 System structure block diagram of CPF MSDF.
1.2 Research on Random Set Representation of Multi-source Information
1.2.1 Establishment of fuzzy model
Multi-source data fusion using fuzzy neural network algorithm has its unique advantages, and embodies the fuzzy neural network does not need any priori information, not only improved the ordinary artificial neural network’s ability to deal with accurate information, but also deal with uncertain information and fuzzy information at the same time, it will contain in the structure of the neural network fuzzy logic reasoning mechanism, without a priori knowledge about the other, and of the trained network is able to multi-sensor information fusion, the fuzzy rule extraction and membership function determination in fuzzy theory fusion multi-sensor information are solved, greatly improve the fusion system integration ability and accuracy, the fuzzy system is highly adaptive ability of the system model, It has the characteristics of both automatic updating system and fuzzy membership function [6, 7]. The standard t-s fuzzy system is usually described by the rule of “if-then”. Generally, under the model with rule R’, we define the fuzzy inference rule as:
| (1) |
In the above formula, A is called the fuzzy set of the system, is the system parameter, and y is the fuzzy rule output element. The input type is fuzzy, and the output result is clear. According to the fuzzy rule, the fuzzy membership value of the input variable x is calculated as follows:
| (2) |
The following fuzzy continuous multiplication operator is used for fuzzy calculation:
| (3) |
1.2.2 Fuzzy neural network
The standard t-s fuzzy neural network adopts the network structure as shown in Figure 4: It is divided into four layers, namely input layer, fuzzy layer, fuzzy rule layer and the output layer respectively. The input layer is linked to the input vector x, and the number of network input nodes is the same as the dimension of the input vector. For input value of the network fuzzification layer, formula (4) is used to fuzz the output value of fuzzy membership. Formula (5) is applied to calculate the output of the fuzzy rule layer. Formula (6) is applied to calculate the final output of the fuzzy neural network. The specific standard algorithm is as follows [8–10]:
| (4) |
Coefficient correction:
| (5) |
Where, p is the weight of the fuzzy neural network, a is the learning rate of the fuzzy neural network, x is the input parameter of the fuzzy neural network, and ok is called the membership degree continuous multiplication operator.
| (6) |
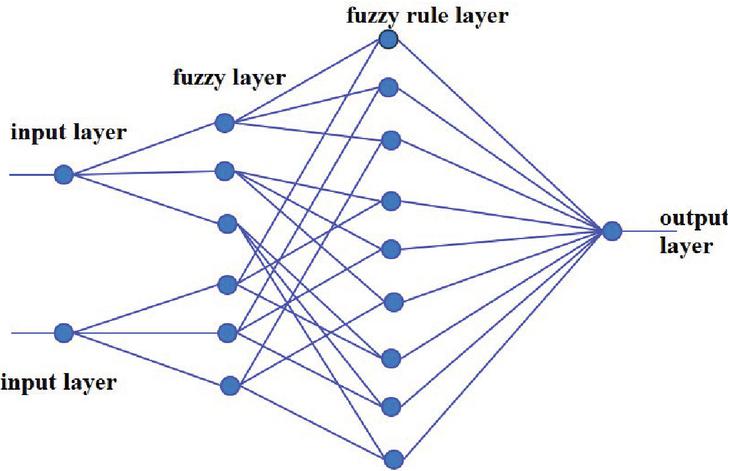
Figure 4 Fuzzy neural network structure.
1.2.3 Function establishment
By introducing the concepts of trust function and likelihood function, d-s theory has been widely used in uncertain information problems to express the uncertainty interval. In the evidence theory, for element A in U, the trust function and likelihood function described by the support degree are as follows:
| (7) |
The trust function Bel is analogue to the probability density function. The summary of the basic probability assignment values of all subsets in A is used to express the total trust to A. The interval [Bel(A),Pl(A)] is the trust interval of A, indicating the possible range from the lower limit estimation to the upper limit estimation of A. On the other hand, Pl(A)Bel(A) indicates A measure that neither trusts nor denies A, and is A measure of ignorance. The degree of contradiction is calculated as follows:
| (8) |
M is used to represent the mass function m m1 star m2 synthesized by the two pieces of evidence on U. The rule of synthesis is:
| (9) |
Evidence theory hypothesis of space mapping: 2 u – is A set of random mapping, (omega) have A:
| (10) | ||
Trust function and the likelihood function, m (A) said here will be the probability of random sets A equivalent to the degree of evidence theory in A precise, i.e. p m ( A) (A) are:
| (11) |
U two statistically independent random subset and , m and m is their mass functions respectively. Then for any subset A of U, there is:
| (12) |
Equivalent to K1 in evidence theory, applied to describe the degree of contradiction between two random sets. The rule of evidence theory is:
| (13) |
2 Methods
2.1 Random Set Representation of Basic Probability Distribution of Expert Opinions
The state of power computer room involves knowledge in different fields of strong current, weak current and information. When it comes to condition monitoring and fault diagnosis, need to rely on experts in different fields to put forward various opinions. Experts give subjective judgments based on their own experience. Due to their rich expertise and experience, they play an important role in determining diagnostic results and adjusting model parameters. After observation and test, experts give judgment results based on their own domain knowledge and experience. Here, comment set 1, 2…MF FFF is all possible states. Set 1, 2…NM MMM represents the set of experts. N is the total number of experts. Due to experts’ own domain knowledge and other conditions, different weights are assigned to each expert in different situations, and w:M[0,1] is defined to represent the weights of experts. For each monitoring and diagnosis situation, choose to adopt the expert opinion that the weight is greater than a average value [11, 12].
For element fi in the comment set, the expert’s comprehensive opinion in a diagnosis can be regarded as a measure of the degree of confidence of the random expert group in the support degree of the current state of fi of the diagnosed object, which is expressed by ib. Because each of the selected experts will give the corresponding advice, so random set M and the number of elements in the fi is must be equal. When calculating the ib values, methods, M and fi corresponding position in small operations, the elements which are the results to get the maximum, the specific formula is:
| (14) |
Taking equipment X for monitoring and fault diagnosis as an example, temperature C is the influencing factor. Sensors set . Theta. Theta X to equipment to monitor the temperature of the three independent sensor respectively in t time to obtain a set of observations, theta I mu is used to describe the I number sensor measurement random set theta I single point cover function. Here it is expressed in gauss form:
| (15) |
as global sensor, theta. 1, 2, theta, theta 3 three sensors function graphic intersecting for global sensor number range interval, in the intersection interval take to establish a data set, gaussian fitting is used to determine the single point cover function mu the values of the parameters, including has a value of 24.49 c, sigma value of 2.522, mu still take coefficient value is 1, the exp (12.72) mu c. The graph of the coverage function of the three independent sensors and the global sensors they determine is shown in Figure 5 below.
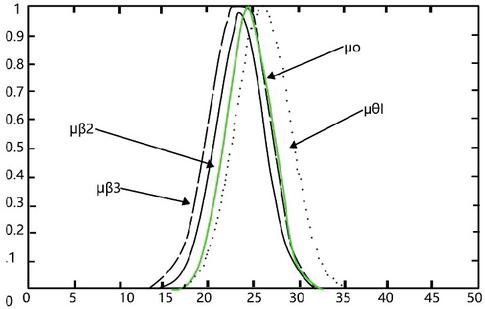
Figure 5 Single point coverage function diagram of every sensor.
Set up comment set corresponds to the comments of three device states. Here, it is only assumed that the device has three states, namely, safe, ordinary, dangerous. For factor temperature C, each state corresponds to a certain value and is represented by a random set. Here, the gaussian form is also applied to represent the single-point coverage function of each random set. The specific function expression is as follows:
| (16) |
Global sensor observation and sample database corresponding to each state for the matching results below 6 for details.
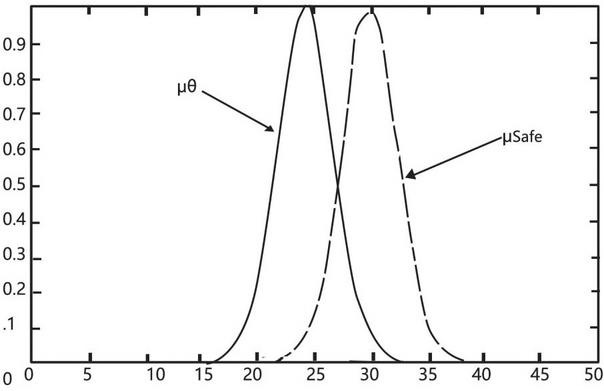
Figure 6 Matching results of observation and security state.
2.2 Research on Null Value Estimation Algorithm Based on Predicted Value
The acquisition system composed of multi-source data is usually an incomplete acquisition system, in which there are many types of null values. This chapter first studies the problem of missing null value estimation in incomplete acquisition system. Secondly, the method of empty value estimation based on similarity relation model is introduced in detail, and the problems in sparse data processing are analyzed. Thirdly, an improved score prediction method for sparse data is proposed, and a new feature weight method is introduced. Finally, the effectiveness and performance of the algorithm are verified by experiments. Rough set theory assumes that information systems contain only accurate data and that any attribute of any object has a unique exact value. In accuracy: refers to the ratio of the total number of correctly estimated attribute values to the total number of filled attribute values, denoted as C, that is:
| (17) |
MAE (mean absolute error) is one of the standards to evaluate the quality of recommendation algorithm. The accuracy of prediction is measured by calculating the deviation between the prediction score and the actual score of users. The smaller the value of MAE, the higher the accuracy of recommendation [13–15]. MAE is the most commonly used recommendation quality assessment method because it is easy to understand the intuitive measurement of recommendation quality. The calculation method of average absolute error MAE is as follows:
| (18) |
K 0.4, k 0.5, 0.6 k three different thresholds for the sparse degree of 0.54 shown in Table 4.2 the training data set, so through the use of MAE two indicators to evaluate accuracy and average error analysis of the result of the training, observe different threshold set to the effects of the experimental results, the resulting data set, the optimal threshold. According to Table 4.3, when the threshold of sparsity is 0.4, 0.5 and 0.6, the accuracy after the completion of data set filling is 68.9%, 73.3% and 65.6%, respectively. In order to observe the whole data set along with the change of the sparse degree to fill the accuracy of change, with sparse, the abscissa denotes the tau, accuracy as the ordinate, respectively under three different threshold value to get the accuracy in three different curve c1l, c2l, c3l, details see below 7.
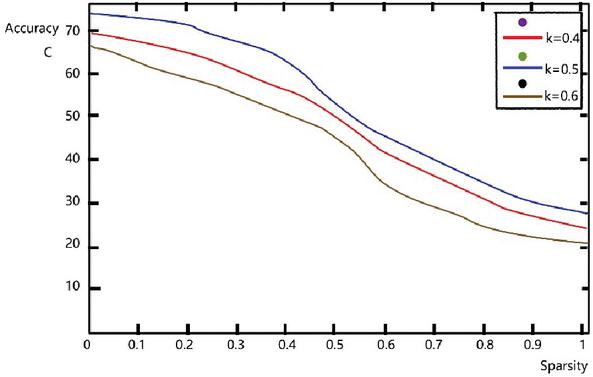
Figure 7 Comparison of accuracy of filling data sets under different thresholds.
3 Experimental Treatment
3.1 Data Preprocessing
In this paper, the fuzzy multilayer feedforward network in Figure 4 is used for data fusion, belongs to feature level fusion. Firstly, the weights between the first layer and the second layer, and between the second layer and the third layer of the network are initialized, all of which are set as constant 1. We take the HCH method as the membership degree. In the calculation process, BP algorithm with input of 5 neurons is applied to modify the weights of the neural network, so as to improve the data fusion efficiency. This not only realizes distributed data fusion and effectively solves the problem of evidence conflict, but also maintains the good properties of d-s synthesis rules such as the original associativity and commutativity. The concept of “discount rate” of basic probability distribution function and the calculation formula of relative reliability coefficient vector [16, 17]:
| (19) |
Matlab is used for simulation. According to the three expressions in Equations (6)–(8), the output data values of the sensor are generated respectively. Each sensor generates 100 random Numbers. In order to improve the accuracy of the above, a total of 10,000 sets of data were generated for training in the experiment. Finally, the expected value was taken as the expectation and applied to the actual distributed data fusion. Only part of the experimental data and the obtained values are presented here [18–22].
The random Numbers generated by the first group of experiments are as follows:
The basic probability distribution value obtained from the above random Numbers is as follows:
The sample results are detailed in Table 1 below.
Table 1 Results of training samples
| Sensors | Collision | The Normalized | Reliability | |
| Sensors | Vector | Vector Conflict | Coefficient | Value |
| A | (0.12,0.05) | (0.7059,0.2941) | 0.3532 | – |
| B | (0.12,0.06) | (0.6667,0.3333) | 0.3362 | – |
| C | (0.05,0.06) | (0.4545,0.5455) | 0.3106 | – |
The analog sensor produces different data due to different noises on the sine curve. In this paper, 10 sensor data were selected for the simulation test. The test information data are shown in Table 2 below. The corresponding data from I to 5 were selected by the fuzzy neural network for network training. The trained network is fused to the data from I from 6 to 10, and the results are shown in Figure 9, as shown in the error data in Table 2.
Table 2 Absolute error table of fuzzy neural network training fusion
| The | |||||||||||
| Number | Mean | ||||||||||
| of | 1 | 2 | 3 | 4 | 5 | 6 | 7 | 8 | 9 | 10 | Error |
| Training | 0.0345 | 0.0354 | 0.0347 | 0.0381 | 0.0396 | 0.0404 | 0.0461 | 0.0343 | 0.0345 | 0.0462 | 0.03838 |
| error | |||||||||||
| Fusion | 0.0436 | 0.0452 | 0.0489 | 0.0436 | 0.0432 | 0.0468 | 0.0597 | 0.0565 | 0.0487 | 0.0633 | 0.04995 |
| error |
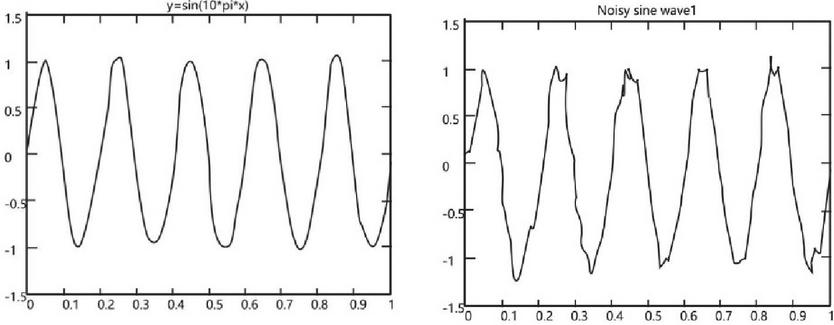
Figure 8 Sensor graphics.
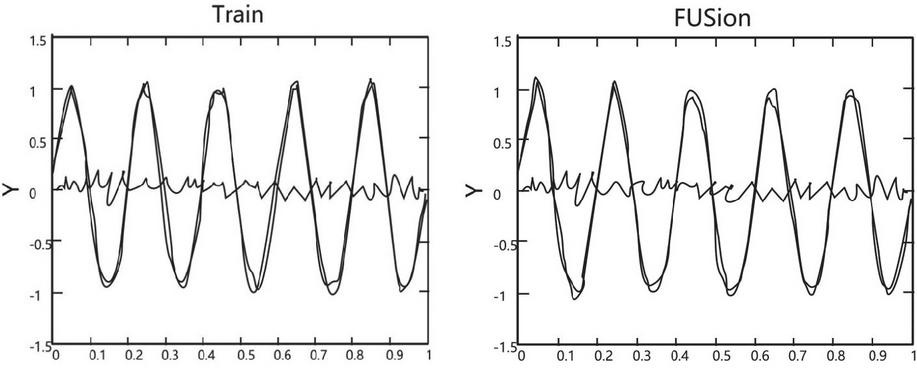
Figure 9 Network training diagram and fusion diagram.
3.2 Empirical Analysis
The DFDM MSDF fusion system takes CPF as the platform and USES the existing sensors on CPF to conduct the position fusion and attribute fusion of the target [23–28], so as to obtain the accurate target and target identity identification. DFDM can operate in two modes: (1) “simulation mode”, fusing data from CPF’s sensor actuator; (2) “real mode”, the data comes from the sensor data in the CPF real task. CPF adopts a distributed structure. MSDF system directly reads sensor data after adding interface CARDS from the monitoring nodes of CPF’s SHINPADS bus. See Figure 10 for details of its software frame diagram.
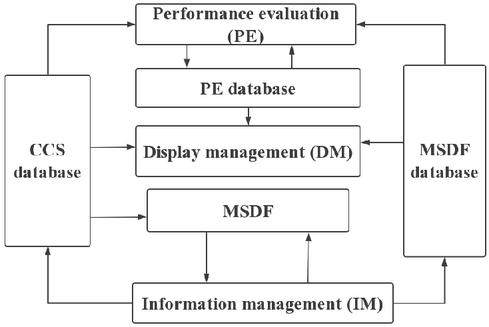
Figure 10 Software functional block diagram of CCP MSDF system.
IM split output after selection, classification and format transformation from the SHINPADS bus, one channel output to the CCS database, another channel output to the MSDF queue for fusion. Target tracking data and attribute identity information obtained from the MSDF fusion processing is exported to the MSDF database. PE reads the CCS and MSDF database data and sends the results to the PE database. DM supports MSDF man-machine interface, Since the display of MSDF s is similar to that of CPF, Two systems can be easily compared.
HCH characteristic is to deal with the problem of conflict evidence convergence faster, according to the above table, through the alpha value and historical data can get reliability coefficient, and the HCH ict between the value of the error is very small, forecast reliability coefficient of data fusion can be used to better solve the problem of evidence conflict with good convergence. In addition, the predicted reliability data fusion can calculate the reliability coefficient of each data source before the arrival of the next fusion data, which can save the time to calculate the reliability coefficient and improve the efficiency. See Figure 11 for details.
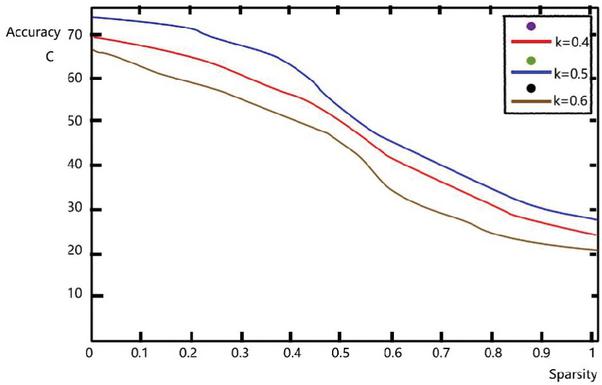
Figure 11 Time comparison of distributed fusion and HCH method fusion.
4 Conclusion
The demand quantity is calculated in the current solution, so it is necessary to find a feasible multi-sensor registration method suitable for engineering application. In a multi-platform multi-sensor system, there is a feature of each platform moving with each other, so we must allocate the problem dynamically. With the continuous development and progress of sensor technology, there are some uncertain error sources, so it is particularly important to establish a registration model in the registration process. The advantages of neural network itself can ensure the convergence of different deviation training according to the data definition in the training set, so the data of the set can be controlled on the premise of lacking experience. In terms of sensor bias, the shortcomings of random neural network are solved by using network weight or computational intelligence theory to adapt to the variation of sensor bias by combining knowledge base. Open and modular system can ensure the system to obtain as much flexibility and repeatability as possible, make full use of the existing fusion algorithm research results, save a lot of time and resources. On this basis, we also need to further study the order degree of the organizational structure of the information fusion system from the perspective of sensor management, so as to study the quality and timeliness of information transmission between each link of the fusion system. It provides reliable data support for comprehensive research and judgment to reduce false alarm, and lays a foundation for holographic sensing of power information room.
References
[1] Y. Lin, R. Chen, T. Jin. Research on multi-source heterogeneous data fusion technology for complex information system. China Measurement & Test, Vol. 46, No. 7, 2020. 1p.
[2] K. P. Zhu, G. C. Li, Y. Zhang. Big data oriented smart tool condition monitoring system. IEEE Transactions on Industrial Informatics, Vol. 16, No. 6, 2020. 4007p
[3] J. Qi, X. Liang, Z. Li, et al. Representation Learning of Large—Scale Complex Information Network: Concepts, Methods and Challenges. CHINESE JOURNAL OF COMPUTERS, Vol. 41, No. 10, 2018. 2394p.
[4] J. S. Jie, Z. X. Hu, G. Y. Qian, et al. Discovering unusual structures from exception using big data and machine learning techniques. Science Bulletin, Vol. 64, No. 9, 2019. 612p.
[5] Y. Zheng, X. Hu, J. Yin. Health data fusion method based on multi-task support vector machine. Systems Engineering—Theory & Practice, Vol. 39, No. 2, 2019. 418p.
[6] W. Huang, S. Kwun Oh. Hybrid Fuzzy Wavelet Neural Networks Architecture Based on Polynomial Neural Networks and Fuzzy Set/Relation Inference-Based Wavelet Neurons. IEEE Transactions on neural networks and learning systems, Vol. 29, No. 8, 2018. 3452p.
[7] Adaptive-fuzzy-neural-network data-fusion-based fault-location technique using wide-area synchronized measurements for transmission grids. 2020 5th Asia Conference on Power and Electrical Engineering, ACPEE 2020, 105p.
[8] J. Shi, S. Liang. Type 2 fuzzy neural network system identification based on fuzzy clustering. Science Technology and Engi-neering, Vol. 20, No. 4, 2020. 1454p.
[9] C. D. Li, G. Q. Zhang, et al. Knowledge and data drive type-2 fuzzy methods with applications. Beijing: Science Press, 2017.
[10] J. Gao, R. Yuan, J. Yi, et al. Automatically con-structing type-2 TSK neural fuzzy system based on type-1 fuzzy rules. Control Theory and Application, Vol. 33, No. 12, 2016. 1615p.
[11] L. Zhao, Y. Sun, H. Z. Wang, J Liu. Research on expert opinion aggregation model based on probability distribution theory. Statistics & Decision, issue 23, 2015. 21p.
[12] L. Ge, Y. L. Li, Y. Q. Wang. Comprehensive Evaluation Model for Situational Awareness Effects of a Smart Distribution Network. Journal of Tianjin University (Science and Technology), Vol. 53, No. 11, 2020. 1101p.
[13] L. Liu, L. Wang, F. Wu. An Efficient Method for Estimating Null Values in Relational Database. Computing Technology and Automation, Vol. 35, No. 3, 2016. 110p.
[14] F. Wu, Y. G. Mao. A Multi-null Value Estimation Method Based on Multi-table Relationship Information in Relational Database. Computer and Modernization, Vol. 6, 2016. 117p.
[15] Y. K. Guo. Related studies on incomplete information database. Nanjing University of Aeronautics and Astronautics, 2016, 35p.
[16] H. Wang. Research on multi-source data correlation and fusion algorithm. Southern Yangtze University, 2016. 110p.
[17] G.L. Mao. Pure Angle multi-target localization algorithm based on data fusion. Zhejiang University, 2013. 44p.
[18] Q. Gao. Research on multi-sensor data fusion algorithm. Xidian University, 2008. 65p.
[19] Z. Wang. Research on airborne multisensor data fusion technology. Nanjing University of science and technology, 2010. 21p.
[20] Y.J. Jiang. Research on key technology of multi-sensor data fusion. Harbin engineering university, 2010. 22p.
[21] H. Ye. Research on registration algorithm of multi-sensor system. China academy of engineering physics, 2014. 32p.
[22] C. Y. Yu. Research on the key technology of multi-resolution analysis image fusion. Chongqing University, 2014. 21p.
[23] J. Q. Zou. N. Qing, monitoring data acquisition and management technology research. Chinese academy of agricultural sciences, 2012. 23p.
[24] X. Tian. Research on multi-sensor data association and track fusion technology. Harbin engineering university, 2012. 34p.
[25] H. Jia. Research on data fusion algorithm based on perceptual guidance. University of electronic science and technology, 2012. 21p.
[26] J. Kang. Research on key technology based on multi-sensor information fusion. Harbin engineering university, 2013. 25p.
[27] Q. F. Gao. Research on multi-uav passive target positioning and tracking technology. Nanjing University of science and technology, 2017. 54p.
[28] Y. Liu, Z. Xu, G. Li, Y. Xia, S. Gao. Review on Applications of Artificial Intelligence Driven Data Analysis Technology in Condition Based Maintenance of Power Transformers. High Voltage Engineering, Vol. 45, No. 2, 2019. 337p.
Biography

Yuxiang Cai is a PH.D. student at the Shanghai Jiao Tong University. He studied in Fuzhou University and got a master’s degree in software engineering in 2011. Since 2006, Cai Yuxiang has been engaged in electric power informatization related work in State Grid Fujian Electric Power Co., Ltd. As a electric power information expert, he has rich experience in electric power Internet of things and data analysis. He is currently studying for a doctorate in electronics and information at Shanghai Jiaotong University. He takes the electric power IOT terminal as the research object and carries out terminal security and condition monitoring analysis.
Journal of Web Engineering, Vol. 20_5, 1553–1572.
doi: 10.13052/jwe1540-9589.20510
© 2021 River Publishers