A Mixed Deep Learning Based Model to Early Detection of Depression
Boumahdi Fatima1,*, Madani Amina1, Rezoug Nachida1 and Hentabli Hamza2
1Université Blida 1, Laboratoire LRDSI, Faculté des Sciences, B.P 270, Route de Soumaa, Blida, Algerie
2Faculty of Computing, Universiti Teknologi Malaysia, 81310 UTM Johor Bahru, Johor, Malaysia
E-mail: f_boumahdi@esi.dz; a_madani@esi.dz; n_rezoug@esi.dz; hentabli_hamza@yahoo.fr
* Corresponding Author
Received 17 March 2019; Accepted 02 June 2020; Publication 14 July 2020
Abstract
Mental health is considered as one of today’s world’s most prominent plagues. Therefore, our work aims to use the potential of social media platforms to solve one of mental health’s biggest issues, which is depression identification. We propose a new deep learning model that we train on a depression-dedicated dataset in order to detect such mental illness from an individual’s posts. Our main contributions lie in the three following points: (1) We trained our own word embeddings using a depression-dedicated dataset. (2) We combined a Convolutional Neural Networks model with the Message-level Sentiment Analysis model in order to improve the feature extraction process and enhance the model’s performance. (3) We analyzed through different experiments the performance of three deep learning models in order to provide more perspectives and insights for depression researches. A total of four classifier models were deployed with the same dataset. Those implementing CNN-BiLSTM with Attention model attained greater overall Accuracy, Recall, Precision and F1 macro scores of 0.97, 0.95, 0.84 and 0.92 on the final assessment test set, respectively.
Keywords: Sentiment analysis, early risk detection, deep learning, mental health, depression identification, text classification.
1 Introduction
Nowadays, people are using social media to express their feelings and share their innermost thoughts and desires, most importantly, all of that is done in a naturalistic way, giving us an opportunity to overcome the manipulation issue addressed in self-reported depression questionnaires. Thus, it allows us to capture these thoughts in their rawest form and use them to identify the publisher’s present state of mind, which can be used, using sentiment analysis techniques, to detect clinical depression.
Major Depressive Disorder identification has been the subject of research of many fields, psychiatry, psychology, medicine and even sociolinguistics fields. Depression comes in different degrees and the examinations are usually done through one of the popular questionnaires used by psychologists, such as the Center of Epidemiologic Studies Depression Scale (CES-D) [25], Beck’s Depression Scale (BDI) [4] and Zung’s Self-Rating Depression Scale (SDS) [43]. But, these examinations lack empirical data as they use the patient’s observations or a third-party’s ones which puts the results under the risk of flawed subjective human testing that can be manipulated easily, often with the purpose of gaining antidepressants or just to hide one’s own depression from peers [23].
The aim of this study is to use artificial intelligence’s deep learning techniques to overcome one of mental health’s most prominent challenges, which is identifying depression automatically from an individual’s behavior. We use social networks posts as a medium to track such behavior due to the thought expression culture of the platform and the availability of the data. Despite the efforts invested in it, mental health still remains one of the most life-threatening health issues in the world. What makes such matter worth more attention is the threat that comes from neglecting it. Research has shown that individuals suffering from one or more mental illnesses are likely experience a snowball effect towards other disorders, leading to life-degrading consequences, and in some cases, to fatal ones.
One of the most widespread mental disorders amongst the world’s populations is Major Depressive Disorder, commonly known as clinical depression, with nearly 300 million individuals suffering from it globally [1]. Studies have shown that 3–5% of males and 8–10% of female from the total world’s population are likely to experience a major depressive episode within a period of one year [1]. What makes depression the most known disorder in the world, is its likelihood of being triggered by other health issues as it often co-occurs with other illnesses and mental conditions. With that being said, it has been reported that it’s one of the major causes of suicide, something that shows why it deserves more attention.
The reason why depression is considered as life-threatening, is because of its methods of identification. Diagnosis is extracted from the patient’s self-reported experiences, behavior questionnaires, and surveys, which makes it prone to manipulation. Moreover, individuals suffering from depression tend to hide what they are going through and never seek out for help in most of the cases, something that can cause their state to worsen, and sometimes lead to suicide.
In our daily life, our behaviors and decisions are highly influenced by other people’s opinions. In Social Psychology, this phenomenon is called social compliance. Whether consciously or not, every choice we make is based upon a previous opinion.
With the birth of web 2.0, people began to express their opinions freely, publicly, and in different forms, something that increased the level of interest of organizations and companies in such data because of their precious value. Such insights can be very profitable to businesses and have a great political and economical impact on society. From that, a new research field birthed and became the center of attention of computer science’s research community, and it is called sentiment analysis.
One of mental health’s most important challenges is identifying depression automatically from an individual’s behavior. Once identified and treated, depression has been proven to be cured. Therefore, our main objective with this study is to propose a new way for identifying depression, a way that is based on concrete data and tracked natural behavior. For that, we strive to use one of today’s most advanced technologies, which is deep learning.
Since people are using social media more and more to express their feelings and share their innermost thoughts and desires, we take posts as a source of data, as it records people’s self expressions in their most naturalistic way.
Social media platforms like Twitter, Facebook, and Reddit allow people to share their views and feelings regarding an extensive gamut of topics on the Internet. Many research works have analysed the prowess of data from social media platforms for determining indications of depression. Furthermore, the scientific community has set forth different shared tasks like eRisk (Early Risk Prediction on the Internet)1 of CLEF (Conference and Labs of the Evaluation Forum) and CLPsych (Computational Linguistics and Clinical Psychology). In eRisk, the goal was to estimate whether a user was facing depression, considering a set of posts in a chronological sequence.
In this paper, we were interested in eRisk 2018 dataset because it was huge, labelled, and poised. Prediction is roughly categorised into two phases: training and test. In the training phase, eRisk 2018 emitted chunks of training data along with the test data of eRisk. The chunks comprised user content posted on Reddit along with results of classification. Users are categorised as depressed and non-depressed. Four models have been deployed through the deep learning methodology, that are:
- Model 1-Naive Bayes classifier,
- Model 2-CNN model,
- Model 3-LSTM model,
- Model 4-CNN-BiLSTM with attention model
Our main contributions with this work lie in the four following points:
- We demonstrated the potential of social media data for extracting clinical depression symptoms in individuals that can be leveraged to improve the current questionnaire driven diagnostic tools in its ability to glean clinical depression symptoms in a natural setting and in a continuous and unobtrusive manner.
- This proposed model could benefit future research on building a warning system which can predict the onset of major depression.
- Current clinical approaches is mainly focused on individuals; our findings can be utilized to automatically assess public health at community level for determining health risks behavior, suicidal tendency and help-seeking behavior.
- We analyzed through different experiments the performance of three deep learning models and one classic classifier in order to provide more perspectives and insights for depression researches.
This paper is composed of 4 sections:
- The first section is dedicated to depression detection related works that tackled the same or a similar problematic as ours.
- In Section 3 we present our proposed model and we explore each of its layers while explaining its origins and the different models it is built upon.
- In Section 4, we go through the step-by-step process that we followed to build, train and evaluate our model. By the end we share the obtained results and we compare it to other works that used the same dataset.
- Finally, we are end our paper with a conclusion, in which we summarize the key points of this research and future perspectives for our proposed model and how can it be improved and extended.
2 Related Work
Several researchers focus on detecting mental illness and depression on Twitter. But almost all of them used traditional statistical models as classifiers. Choudhury and all in [13] propose a crowdsourcing method to build a data on depression from Twitter. They develop a Support Vector Machine classifier (SVM) trained on these data to verify if posts could indicate depression. The classifier is based on language, emotion, style and user engagement. Their method can predict if a tweet is depression-indicative, with a high value of accuracy. They propose a new metric called SMDI (Social Media Depression Index) that help to characterize the levels of depression in populations. Their results correlate highly with depression statistics defined by the Centers for Disease Control and Prevention (CDC).
In [23], a dataset created by [10] for the Computational Linguistics and Clinical Psychology for CLPsych 2015 Shared Task [12] was used to study the potential of using Twitter as a tool for measuring and predicting Major Depressive Disorder. They used a Bag of Words approach to quantify each tweet. Several statistical classifiers were used: Decision Trees, Linear Support Vector Classifier, Naive Bayes 1-gram, Naive Bayes 2-gram, Logistic Regression, and Ridge Classifier. The study shows that if prioritization has to be made, recall is more important than precision, because identifying a few false positives is better than strictly identifying the most depressed individuals and missing potentially affected ones. Accuracy was prioritized as well over F1-score because a model which identifies depression well is more important than one which becomes unreliable through a myriad of false positives.
The method of Shen and all [29] aims to make timely depression detection via harvesting social media data. Benchmark datasets were constructed specifically for online depression detection that are: a well-labeled depression dataset, a non-depression one and a large-scale depression-candidate one. After that, six depression-related feature groups were extracted, covering not only the clinical depression criteria, but online behaviors as well. A multimodal depressive dictionary learning model was proposed and validated through a series of experiments, which showed an outstanding performance comparing to other related works.
In depression detection from Twitter, studies are focused on the analysis of textual contents of posts. However, emotions from posts over time are not very investigated. Chen and all [6] propose to identify users with or at risk of depression using eight emotions as features from posts over time (Anger, Disgust, Fear, Happiness, Sadness, Surprise, shame and Confusion). They apply a temporal analysis on these emotions to produce a set of temporal features using machine learning classifiers: LR, SVM, NB, DT and RF. Using emotional expressions, their results outperform other models [11, 12] and [7].
Many works addressed the deep learning usage in sentiment analysis such as [2, 17, 28, 33, 35, 38, 42] and [31]. Our focus is only on mental health using deep learning. In this area, few works exist. Thus, deep learning techniques were not taken advantage of to solve mental health purposes.
[32, 36] and [5] are different approaches that propose interesting models and evaluate them using CLEF/eRisk dataset which is a collection of textual contents posted by users in Reddit [19, 20, 21].
Maxim and all [32] propose to examine three different models using CLEF/eRisk 2017 dataset. Bag-of-words, embedding and bigram models are used to consider the classification task of Reddit users by processing their text messages in order to detect depression. They also investigate stylometric (lexicon volume, users averaged numbers of words per message, sentences per message and words per sentence) and morphological features (parts of speech usage proportions as additional feature sets).
The paper of Trotzek and all [36] is focused on ways to classify indications of depression using eRisk 2017 dataset as early as possible based on a convolutional neural network. Their model is based on a document vectorization using neural word embeddings. For classification, authors propose to use the userbased metadata features. They also examine the popular Early Risk Detection Error (ERDE) measure for early detection systems [19] and propose a modified score and compare it to the original one.

Figure 1 Our depression detection model architecture.
Fidel and all [5] propose an approach based on three types of features: textual similarity, semantic similarity and writing features and evaluate it using eRisk 2018 dataset. Based on bag-of-words and using Cosine similarity [30] and Okapi BM25 [27], Textual similarity is used to estimate the likeliness between a given subject versus positive and negative subjects. In order to find semantic similarity among documents, they apply Latent Semantic Analysis (LSA). They also exploit writing features used to report the characteristics of the subjects writings such as textual spreading, time gap and time span.
For the problem of depression, Wenwen and all [18] propose a new design based on deep learning model called DK-LSTM (Domain Knowledge-Long short-term memory). They propose to incorporate semantic and domain knowledge into LSTM. The authors did not implement their proposed model and then no experiments were presented in the paper.
3 Depression Detection Model Architecture
After going through the literature review and seeing some of the works that have been done in this field for similar purposes, we introduce in this section the architecture of our proposed model.
The architecture of our deep learning model consists of four layers (1): Preprocessing layer, Word Embeddings layer, Learning layer and finally a Softmax layer.
Now, we dive deeper into each one of our architecture components by explaining its origins and how has it been adapted for our goal and problematic.
3.1 Preprocessing
As in any social media platform, users tend to express themselves in everyday’s slang language, which makes it rare to find well-formed sentences that respect grammatical and linguistic rules.
Furthermore, abbreviations and smileys are widely used, especially when expressing feelings, opinions or any form of self-expression, in other words, sentiment, which is the subject of our study. These factors have been known to pose a major challenge in Natural Language Processing (NLP) and as much as this field is reaching its most advanced levels. They still are considered as the most important bottlenecks when dealing with raw text. In addition to that, dealing with posts gives us other factors to take in consideration, such as URLs and reserved words (RT, FAV).
Even though, some of this data can be useful to the sentiment expressed in the post, keeping them requires a very complex model that is able to handle every possibility, changing our focus from depression detection to solving natural language processing issues. Thus, the use of a text preprocessor becomes a necessity rather than an optional step.
Our preprocessing phase is divided in two major steps: cleaning and tokenization.
3.1.1 Cleaning
We sanitized each post so that they did not contain irrelevant text, so they would be suitable input for our various models. One category of irrelevant text, for both word-based and character-based models, are hyperlinks, because they do not add much to the actual content of the post. We apply Stopwords elimination by removing empty words that have little lexical meaning such as propositions and pronouns using a stop-words list.
3.1.2 Tokenization
The process of breaking a string or text into a list of tokens is known as tokenisation. It is the task of chopping it up into pieces, called tokens, perhaps at the same time throwing away certain characters, such as punctuation. A token is an instance of a sequence of characters, in some particular document that are grouped together as a useful semantic unit for processing. A type is the class of all tokens containing the same character sequence.
For example (Figure 2), a sentence is a token in a paragraph, while a word is a token in a sentence.
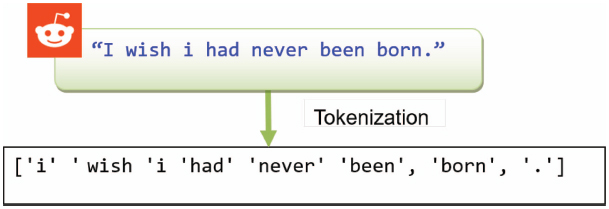
Figure 2 Tokenization example.
3.2 Embedding Layer
The word representations computed using neural networks are very interesting because the learned vectors explicitly encode many linguistic regularities and patterns. Some what surprisingly, many of these patterns can be represented as linear translations.
The Skip-gram model’s main objective lies in finding word representations that are useful for predicting the surrounding words in a sentence or a document, or a post in our case, which is its main differentiator from other word embedding architectures. For a given sequence of training words w1, w2, w3, ..., wT, the model’s objective is to maximize the average log probability.
| (1) |
Where c is the size of the training context, and the more we increase it the more training examples we have and thus a possibility of having a higher accuracy, at the expense of the training time.
3.3 Learning layer
In this layer, we have four models:
- Naive Bayes model,
- CNN model,
- LSTM model,
- CNN-BiLSTM with attention model.
3.3.1 Naive Bayes
A Naive Bayes classifier can be referred to as a supervised classification algorithm. The instance (post) that requires to be classified is denoted as a vector of characteristics. The vectors with class labels are the training instances, which in this case are negative and positive. A Naive Bayes classifier constructs a probabilistic model through a training procedure, which can be applied to categorise new input instances.
3.3.2 CNN model
In recent years, CNNs started being used even in NLP tasks and the results were surprisingly impressive. By using word vectors to build the input matrix of the model, text was treated in the same way as images, both for feature-extraction and classification, and ever since it became one of the most used neural networks in NLP.
Inspired from [9, 15] created the CNN model for sentence classification purposes and it’s from this model that we are going to build the convolutional part of our model.
Let xi ∈ Rk be the k-dimensional word vector corresponding to the i-th word in the sentence. A sentence of length n (padded where necessary) is represented as:
| (2) |
Where ⊕ is the concatenation operator.
In general, let xi:i+j refer to the concatenation of words xi, xi+1, xi+2, ..., xi:i+j.
A convolution operation involves a filter w ∈ Rhk, which is applied to a window of words to produce a new feature. For example, a feature ci is generated from a window of words xi:i+h−1 by:
| (3) |
Here b ∈ R is a bias term and f is a non-linear function such as the hyperbolic tangent. This filter is applied to each possible window of words in the sentence x1:h, x2:h+1, ..., xn−h+1:n to produce a feature map.
We then apply a max-overtime pooling operation [15] over the feature map and take the maximum value O = max{c} as the feature corresponding to this particular filter. The idea is to capture the most important feature one with the highest value for each feature map. This pooling scheme naturally deals with variable sentence lengths.
Here we went through the step-by-step process through which one feature is extracted from one filter, but the CNN model uses multiple filters (with varying window sizes) to obtain multiple features. The layer formed by these features is called penultimate layer and is connected to a final softmax layer that provides the probability distribution over labels [15].
Same as it was described in the previous section, in our model, we are going to start with a tokenized post which we then convert to a post matrix, the rows of which are word vector representations of each token. These are the outputs of the embedding layer previously defined. According to [8], we can then effectively treat the post matrix as an image, and perform convolution on it using linear filters.
In text applications there is inherent sequential structure to the data. Because rows represent discrete symbols (namely words), it is reasonable to use filters with widths equal to the dimensionality of the word vectors (i.e., d). Thus, we can simply vary the height of the filter, i.e., the number of adjacent rows considered jointly. We refer to the height of the filter as the region size of the filter.
3.3.3 LSTM model
LSTM is utilised for remembering just the vital segments of every input sentence and is trained to overlook the rest. Hence, the output is a blend of the present input sentence estimations and the memory of prior key segments of sentences. LSTM makes use of 3 gates to capture Long Term Dependencies:
- Forget Gate: decides what component of previous cell state must be forgotten.
- Input Gate: responsible for adding information to the cell state.
- Output Gate: responsible for ascertaining beneficial information to output at current cell state.
In this step, the focus is on the application of LSTM, which is an artificial RNN (Recurrent Neural Network) architecture. In the context of this research, a LSTM constitutes of various attention processes. These processes assign class labels for TASK1 and TASK2 of CLEF 2018, and execute efficient binary classification (positive or negative) of input data.
3.3.4 CNN-BiLSTM with attention model
As shown in the Figure 3, we combine the CNN and BiLSTM models to detect the depression. The proposed model takes the output vector of the CNN as the input vector of the BiLSTM, then it builds a new BiLSTM model on the CNN one to extract the features of the input comment and improve the results of the classification.
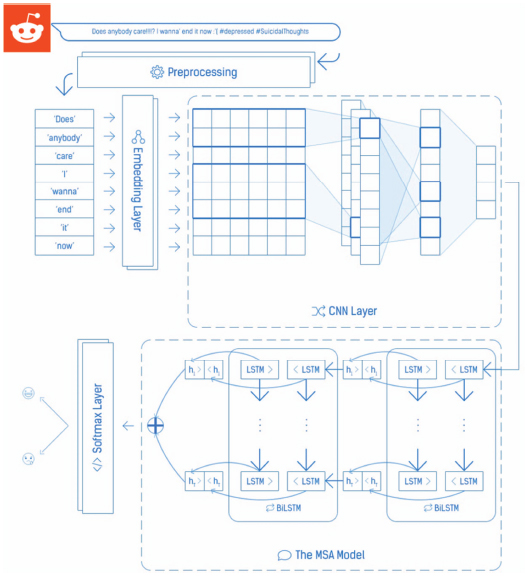
Figure 3 CNN-BiLSTM with attention model architecture.
The difference between the CNN model (presented in Section 3.3.2) and our model is that we don’t have a softmax layer but we have instead a BiLSTM with Attention layer through which the features inputted, and we are going to cover the process of the latter in the next section.
As mentioned previously, our model uses the MSA (Message-level Sentiment Analysis) model [3, 41] and [40] as a part of it and its sequential layer consists of 2-layer BiLSTM with an attention mechanism, to improve the feature extraction process and enhance the model’s performance.
LSTM networks are a special kind of RNN that is designed specifically to solve RNNs’ long-term dependency problem. LSTMs are being used in a wide variety of problems due to their ability to remember information over long periods of time [14, 16] and [34]. Similarly to standard RNNs, LSTMs have the same structure, the difference is in the repeating modules, which contain a four-layer neural network instead of a single one.
An LSTM takes the words of a post as an input and produces annotations H = (h1, h2, ..., hT), where hi is the hidden state of the LSTM at time-step i, summarizing all the information of the sentence up to xi. For this case, the use of bidirectional LSTM (BiLSTM) brings the advantage of getting word annotations that summarize the information from both directions, first, going forward from x1 to xT, then backward from xT to x1. The final annotation of a given word is the concatenation of the annotations from both directions. Finally, the reason why two layers of BiLSTMs are used is to make the model learn more abstract features.
The uniqueness of this BiLSTM model lies in the attention layer. Knowing that not all words contribute equally to the expressions of a sentiment in a message, the attention mechanism allows the model to find the relative importance of each word to the expression by assigning a weight ai to each word annotation then computing the fixed representation r of the whole message as the weighted sum of all the word annotations.
3.4 Softmax Layer
In the final layer, the representation r is fed to the final fully-connected softmax layer as a feature vector used for classification. The result is a probability distribution over all classes.
We have gone through the different phases and layers of our proposed model. Most importantly, we dug deep in each part to give a better understanding of the basics of all the models used, this way everything is justified.
In the next section, we’re going to describe the process we went through in order to implement this model and we discuss the results at the end.
4 Experiments and Results
We share more details about the data used in our experiments and the process followed, and by the end, we present the results of the models and we compare them with others of similar study.
4.1 Data
This section presents a synopsis of the dataset utilised for the experiments outlined in this paper and its key attributes. Furthermore, it specifies the conforming task and the assessment norms. Our input encompassed a collection of comments and posts from a social platform, explicitly collected for eRisk 2018. Data were mined from Reddit.
Table 1 Datasets used
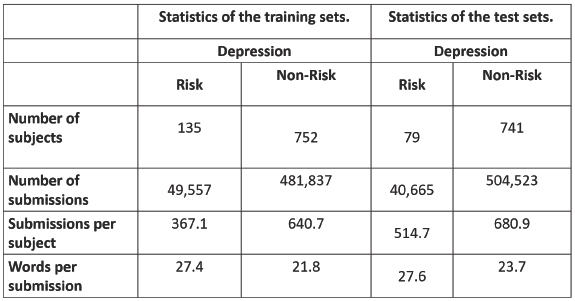
As shown in Table 1, the dataset involves a total of 887 subjects. Of these, 135 are facing depression. The dataset comprises over 500,000 different comments and posts, with an average of around 600 posts for every subject. Furthermore, other descriptive statistics are indicated to exhibit the dissimilarities between control and depressed users.
4.2 Performance Measures
For the users categorisation task, we select accuracy, recall, precision, and F-measure as performance indicators. From the perspective of detecting depression:
- A false positive (FP) is user the model incorrectly labels as depressed but does not suffer from depression actually.
- A True positive (TP) is correctly identified by the model as depressed and indeed suffers from it.
- A True negative (TN) is a user labeled as not depressed and at present he has no depression.
- A false negative (FN) is labeled by the model as not depressed but he is actually depressed.
We need to define the metrics through which we measure the results of our work and compare it to other works.
Precision: percentage of posts appropriately categorised taking into account the false negatives.
| (4) |
Recall: percentage of posts appropriately categorised taking into account the false positives. The question that recall answers is: of all of the depressed users, how many did we appropriately identify?
| (5) |
F1 Score is the weighted average of Precision and Recall.
| (6) |
For substantiating the exactitude of a classifier and ascertain its suitability, it is necessary to gauge its performance. Conventionally, the most frequently deployed metric is accuracy.
Accuracy is the percentage of properly categorised instances.
| (7) |
4.3 Training
The training data contain the following components:
- risk_golden_truth.txt: this file holds the ground truth. Code 0 means that the subject is a non-risk case, while Code 1 indicates that the subject is a risk case of depression.
- positive_examples_anonymous_chunks: this folder stores all the posts of the risk cases.
- negative_examples_anonymous_chunks: this folder contains all the posts of the non-risk cases.
We experimented with different approaches so that we get rich insights by the end of the study. Since we have distinct datasets that are depression oriented, using a supervised learning approach was the best option we could take. Therefore, instead of using a pre-trained word embedding, we trained our own word embeddings. We also trained a naive bayes, CNN, LSTM and the CNN-BiLSTM model separately using our depression-trained word embeddings to see how efficient they are and what improvements does our model bring.
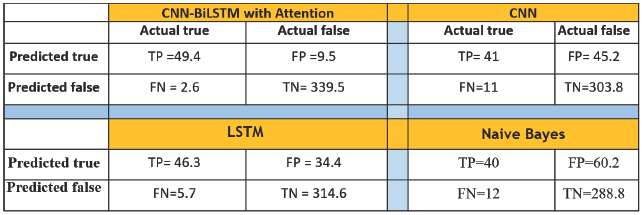
Table 2 Confusion matrix for the users
Our next experiment was to train the CNN-BiLSTM with Attention model that we mentioned in the previous section, individually as well, using our depression-trained word embeddings to see if the BiLSTM deep neural network is able to detect depression with high efficiency.
4.4 Error Analysis
To present the misclassifications, we use the confusion matrix (error matrix or a table of confusion), it is used in predictive analytics to understand what type of data is being designated as true and what kind of data is designated as false by the classifier (Naive Bayes) or the classification model chosen (CNN, LSTM and CNN-BiLSTM with Attention).
As we show in the Figure 2, the confusion matrix illustrates us how the classification algorithm is performing with respect to the real. This matrix reports the number of true positives, false positives, false negatives, and true negatives from the classifier.
4.5 Results
The detection performances of our model and baselines were compared based on four identified measures.
As it is shown the Figure 4, we notice that deep learning methods are more effective than any traditional methods (Naive Bayes), no matter how advanced and tailored it is.
From Figure 4, it is clear that CNN-BiLSTM with Attention model outclassed other classifiers with a precision of 97% which is better compared to Naive Bayes by 15% and CNN by 11%.
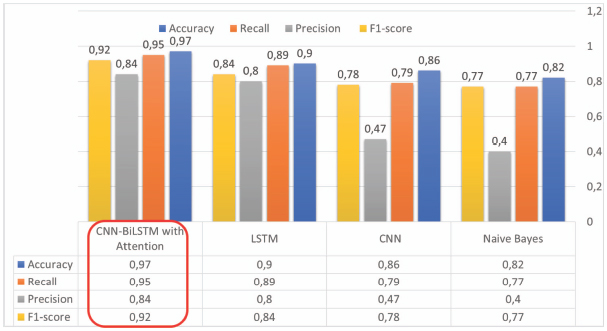
Figure 4 The results of the different experiments conducted on the dataset used.
Moreover, CNN-BiLSTM with Attention model performed superior to LSTM and CNN with regards to recall, outclassing Naive Bayes by 18%.
This was because the count of False Positives for Naive Bayes was greater compared to False Negatives; in case of CNN-BiLSTM with Attention, False Positives are more compared to False Negatives. We consider False Positives (or False Alarm) are higher to False Negatives.
Thus, we chose the outcomes of the CNN-BiLSTM with Attention classifier in the stage categorisation process.
Most importantly, we see that the deeper the neural network is the better the learning is, the better results we get.
4.6 Discussion
The key observations of this research work are as follows: In the early detection of depression, the significance of using a deep learning model enables the comparison of the deep lerning and classic approaches that predict the depression condition. Following a performance Measures analysis, an enhancement of the state-of-the-art models is achieved.
In this work, we put forth three approaches on the basis of deep learning which exclusively utilised data from social media platforms for offering an early discovery of depression cases. The issue was addressed through deep learning and was formalised as a classification problem.
In the beginning, a Naive-Bayes model is presented that is based on two functions (positive and negative) and a binary classifier. However, the outcomes attained were unexceptional as, for making a final decision, the classifier needs adequate evidence to abandon one option as against the other, hence triggering a delay.
Conversely, the CNN model sensing more false negatives (11) might trigger lower Precision, and as a result users suffering from depression may not get timely help, which could result in grave outcomes such as suicide. Thus, low recall might cause a loss of human life.
A classifier identifying more false positives might drive lower precision, and as a result the state is required to invest more funds to aid users who are not essentially depressed.
In order to detect depression, we propose a new MSA model consists of a 2-layer bidirectional LSTM with an attention mechanism associated at CNN model. As show Figure 4, with regards to the deep learning model, the best results were derived through the CNN-BiLSTM with Attention model.
The methodology that exhibited the best performance was based on the CNN-BiLSTM with Attention model that identified the non-depressed and the depressed subjects.
Comparing with others models, our observations indicated how the CNN-BiLSTM with Attention model is capable of enhancing performance up to over 10%. We believe these outcomes could aid in the formulation of new tools for identifying persons at risk, allowing those people suffering from depression to be identified and treated as early as possible.
4.7 Comparison with Existing Models
Comparing our solution with existing models using the same dataset eRisk 2018, we achieved state of the art tagging accuracy, as we presented in Table 3.
As part of the eRisk2018, [22] implement a system based on the topic extraction algorithm, Latent Dirichlet Allocation and simple neural networks, they uses uni-gram, bi-gram and tri-gram frequency, then the users are given a diagnostic probability by a Multilayer Perceptron. [22] achieved moderate results as show in Table 3.
Several machine learning models have been developed by [24], they have using different types of features, such as both Bag Of Words (BOW) features and Unified Medical Language System (UMLS ) features to identify depression in eRisk 2018. [24] have studding Ada Boost, Logistic Regression, Support Vector Machine and Random Forest classifiers, However, [24] are concluded that the results of Ada Boost using BOW features are the best.
Table 3 Comparison with published results on eRisk 2018
| Research | Model | F1 | Precision | Recall |
| [26] | LIRMMA | 0.49 | 0.38 | 0.68 |
| LIRMMB | 0.36 | 0.24 | 0.73 | |
| [24] | Ada Boost with BOW Features | 0.75 | 0.75 | 0.76 |
| [22] | FHDO-BCSGB | 0.64 | 0.64 | 0.65 |
| RKMVERIC | 0.48 | 0.67 | 0.38 | |
| UDCB | 0.18 | 0.10 | 0.95 | |
| [39] | TF-IDF and CNN | 0.37 | 0.29 | 0.52 |
| [37] | BCSGA | 0.64 | − | − |
| Our model | CNN-BiLSTM with Attention | 0.92 | 0,84 | 0.95 |
LIRMM present the results of eRisk-2018 dataset in [26], It performs the classification through two phases of supervised learning using text vectorization methods. The first learning phase builds the bayesian inversion technique, while the second learning phase is a classification model.
[39] presented a combined approach to early risk detection of depression in eRisk 2018, [39] combined TF-IDF (Term Frequency-Inverse Document Frequency) information and CNN to identify the depressed users. Therefore, the evaluation shows that the model proposed achieves Precision of 0.29, Recall of 0.52, and F-score of 0.37 in depression detection.
The results of FHDO Biomedical Computer Science Group (BCSG) in eRisk dataset has presented in [37], they used four machine learning models, those based on user-level linguistic metadata, Bags of Words, neural word embeddings, and CNN. BCSG has achieved F1 score of 0.64, but Precision and Recall performance measures are not presented.
The result of this paper has been compared to related works [22, 24, 39] and [37], they predict depression based on eRisk 2018 dataset. Therefore, our test Precision is 0,84 which is significantly better than others. In addition, our proposed model already reaches a good Recall of 0.95, and can achieve the best F1 score of 0.92.
The advantage of CNN-BiLSTM with Attention model is to enhance the classification performance.
5 Conclusion
The objective of our study was to solve one of mental health’s biggest issues, which is the inefficiency of the traditional identification methods of mental illnesses. More specifically, we chose to focus on major depressive disorder, also known as clinical depression, because of its major popularity and likelihood of spreading, and most importantly, to prevent the tragedies that might occur from such disorder. For that, we wanted to design and propose a new way of identifying depression using an advanced artificial intelligence technology known as deep learning.
In this study, the results are presented using eRisk 2018 dataset that indicates early identification of signs of depression. The development in the field of mental health and safety makes it essential to have early risk prediction on the internet. This has been considered as a classification problem and three variations of Deep learning approaches have been presented, along with a traditional naive bayes classifier model.
To attain the best outcome from this project, we did not restrict ourselves to training only the applied model. We also experimented with various approaches to ensure that rich insights were obtained by the end of this study. The naive bayes, CNN, LSTM and the MSA model were also trained separately with the help of our depression-trained word embeddings to ascertain their efficiency and assess the improvements that the model brings in.
To identify clinical depression symptoms in individuals, the potential and influence of social media data was demonstrated. The data was leveraged to upgrade the current questionnaire driven diagnostic tools in order to improve their potential for identifying clinical depression symptoms in an uninterrupted and unobtrusive manner in a natural setting.
This analysis structure can supplement future research on constructing a warning mechanism that can project the arrival of large-scale depression.
Existing clinical approaches are primarily concentrated on individuals. The findings of the study can be applied to automatically evaluate public health at community level in order to ascertain suicidal tendencies, health risks behaviour, and help-seeking behaviour.
The future possibility for our model involves complete automation, which is free of any sort of online research or processing, and provides scope for implementing other algorithms that could improve the model accuracy.
1http://early.irlab.org/
References
[1] Laura Andrade, Jorge J Caraveo-Anduaga, Patricia Berglund, Rob V Bijl, Ron De Graaf, Wilma Vollebergh, Eva Dragomirecka, Robert Kohn, Martin Keller, Ronald C Kessler, et al. The epidemiology of major depressive episodes: results from the international consortium of psychiatric epidemiology (icpe) surveys. International Journal of Methods in Psychiatric Research, 12(1):3–21, 2003.
[2] Oscar Araque, Ignacio Corcuera-Platas, J Fernando Sanchez-Rada, and Carlos A Iglesias. Enhancing deep learning sentiment analysis with ensemble techniques in social applications. Expert Systems with Applications, 77:236–246, 2017.
[3] Christos Baziotis, Nikos Pelekis, and Christos Doulkeridis. Datastories at semeval-2017 task 4: Deep lstm with attention for message-level and topic-based sentiment analysis. In Proceedings of the 11th International Workshop on Semantic Evaluation (SemEval-2017), pages 747–754, 2017.
[4] Aaron T Beck, Calvin H Ward, Mock Mendelson, Jeremiah Mock, and John Erbaugh. An inventory for measuring depression. Archives of general psychiatry, 4(6):561–571, 1961.
[5] Fidel Cacheda, Diego Fernández Iglesias, Francisco J. Nóvoa, and Victor Carneiro. Analysis and experiments on early detection of depression. In CLEF, 2018.
[6] Xuetong Chen, Martin D. Sykora, Thomas W. Jackson, and Suzanne Elayan. What about mood swings: Identifying depression on twitter with temporal measures of emotions. In Companion Proceedings of the The Web Conference 2018, WWW ’18, pages 1653–1660. International World Wide Web Conferences Steering Committee, 2018.
[7] Munmun De Choudhury, Michael Gamon, Scott Counts, and Eric Horvitz. Predicting depression via social media. In Proceedings of the Seventh International Conference on Weblogs and Social Media, ICWSM 2013, Cambridge, Massachusetts, USA, July 8–11, 2013.
[8] Ronan Collobert and Jason Weston. A unified architecture for natural language processing: Deep neural networks with multitask learning. In Proceedings of the 25th International Conference on Machine Learning, ICML ’08, pages 160–167, New York, NY, USA, 2008. ACM.
[9] Ronan Collobert, Jason Weston, Léon Bottou, Michael Karlen, Koray Kavukcuoglu, and Pavel Kuksa. Natural language processing (almost) from scratch. Journal of Machine Learning Research, 12:2493–2537, 2011.
[10] Glen Coppersmith, Mark Dredze, and Craig Harman. Quantifying mental health signals in twitter. In Proceedings of the Workshop on Computational Linguistics and Clinical Psychology: From Linguistic Signal to Clinical Reality, pages 51–60. Association for Computational Linguistics, 2014.
[11] Glen Coppersmith, Mark Dredze, Craig Harman, and Kristy Hollingshead. From adhd to sad: Analyzing the language of mental health on twitter through self-reported diagnoses. In Proceedings of the 2nd Workshop on Computational Linguistics and Clinical Psychology: From Linguistic Signal to Clinical Reality, pages 1–10. Association for Computational Linguistics, 2015.
[12] Glen Coppersmith, Mark Dredze, Craig Harman, Kristy Hollingshead, and Margaret Mitchell. Clpsych 2015 shared task: Depression and ptsd on twitter. In Proceedings of the 2nd Workshop on Computational Linguistics and Clinical Psychology: From Linguistic Signal to Clinical Reality, pages 31–39. Association for Computational Linguistics, 2015.
[13] Munmun De Choudhury, Scott Counts, and Eric Horvitz. Social media as a measurement tool of depression in populations. In Proceedings of the 5th Annual ACM Web Science Conference, WebSci ’13, pages 47–56. ACM, 2013.
[14] Thomas Fischer and Christopher Krauss. Deep learning with long short-term memory networks for financial market predictions. European Journal of Operational Research, 270(2):654 – 669, 2018.
[15] Yoon Kim. Convolutional neural networks for sentence classification. In Proceedings of the 2014 Conference on Empirical Methods in Natural Language Processing, EMNLP 2014, October 25–29, 2014, Doha, Qatar, A meeting of SIGDAT, a Special Interest Group of the ACL, pages 1746–1751, 2014.
[16] Jitendra Kumar, Rimsha Goomer, and Ashutosh Kumar Singh. Long short term memory recurrent neural network (lstm-rnn) based workload forecasting model for cloud datacenters. Procedia Computer Science, 125:676–682, 2018. The 6th International Conference on Smart Computing and Communications.
[17] Changliang Li, Bo Xu, Gaowei Wu, Saike He, Guanhua Tian, and Yujun Zhou. Parallel recursive deep model for sentiment analysis. In Pacific-Asia Conference on Knowledge Discovery and Data Mining, pages 15–26. Springer, 2015.
[18] Wenwen Li and Michael Chau. Applying deep learning in depression detection. In 22nd Pacific Asia Conference on Information Systems, PACIS 2018, Yokohama, Japan, June 26–30, page 333, 2018.
[19] David E. Losada and Fabio Crestani. A test collection for research on depression and language use. In Experimental IR Meets Multilinguality, Multimodality, and Interaction – 7th International Conference of the CLEF Association, CLEF 2016, Évora, Portugal, September 5–8, 2016, Proceedings, pages 28–39, 2016.
[20] David E. Losada, Fabio Crestani, and Javier Parapar. erisk 2017: CLEF lab on early risk prediction on the internet: Experimental foundations. In Experimental IR Meets Multilinguality, Multimodality, and Interaction – 8th International Conference of the CLEF Association, CLEF 2017, Dublin, Ireland, September 11–14, 2017, Proceedings, pages 346–360, 2017.
[21] David E. Losada, Fabio Crestani, and Javier Parapar. Overview of erisk: Early risk prediction on the internet. In Experimental IR Meets Multilinguality, Multimodality, and Interaction – 9th International Conference of the CLEF Association, CLEF 2018, Avignon, France, September 10–14, 2018, Proceedings, pages 343–361, 2018.
[22] Diego Maupomé and Marie-Jean Meurs. Using topic extraction on social media content for the early detection of depression. In CLEF: Conference and Labs of the Evaluation Forum, 2018.
[23] Moin Nadeem. Identifying depression on twitter. arXiv preprint arXiv:1607.07384, 2016.
[24] Sayanta Paul, Sree Kalyani Jandhyala, and Tanmay Basu. Early detection of signs of anorexia and depression over social media using effective machine learning frameworks. In CLEF: Conference and Labs of the Evaluation Forum, 2018.
[25] Lenore Sawyer Radloff. The ces-d scale: A self-report depression scale for research in the general population. Applied Psychological Measurement, 1(3):385–401, 1977.
[26] Waleed Ragheb, Bilel Moulahi, Jérôme Azé, Sandra Bringay, and Maximilien Servajean. Temporal Mood Variation: at the CLEF eRisk-2018 Tasks for Early Risk Detection on The Internet. In CLEF: Conference and Labs of the Evaluation Forum, volume CEUR Workshop Proceedings, September 2018.
[27] Stephen Robertson and Hugo Zaragoza. The probabilistic relevance framework: Bm25 and beyond. Found. Trends Inf. Retr., 3(4):333–389, April 2009.
[28] Aliaksei Severyn and Alessandro Moschitti. Twitter sentiment analysis with deep convolutional neural networks. In Proceedings of the 38th International ACM SIGIR Conference on Research and Development in Information Retrieval, pages 959–962. ACM, 2015.
[29] Guangyao Shen, Jiang Jia, Liqiang Nie, Fuli Feng, Cunjun Zhang, Tianrui Hu, Tat-Seng Chua, and Wenwu Zhu. Depression detection via harvesting social media: A multimodal dictionary learning solution. In Proceedings of the 26th International Joint Conference on Artificial Intelligence, IJCAI’17, pages 3838–3844. AAAI Press, 2017.
[30] Amit Singhal. Modern information retrieval: a brief overview. Bulletin of IEEE Computer Society Technical Committee on Data Engineering, 24:2001, 2001.
[31] Richard Socher, Alex Perelygin, Jean Wu, Jason Chuang, Christopher D Manning, Andrew Ng, and Christopher Potts. Recursive deep models for semantic compositionality over a sentiment treebank. In Proceedings of the 2013 Conference on Empirical Methods in Natural Language Processing, pages 1631–1642, 2013.
[32] Maxim Stankevich, Vadim Isakov, Dmitry Devyatkin, and Ivan Smirnov. Feature engineering for depression detection in social media. In Proceedings of the 7th International Conference on Pattern Recognition Applications and Methods – Volume 1: ICPRAM,, pages 426–431. INSTICC, SciTePress, 2018.
[33] Zengcai Su, Hua Xu, Dongwen Zhang, and Yunfeng Xu. Chinese sentiment classification using a neural network tool word2vec. In Multisensor Fusion and Information Integration for Intelligent Systems (MFI), 2014 International Conference on, pages 1–6. IEEE, 2014.
[34] Yoshihiko Suhara, Yinzhan Xu, and Alex ‘Sandy’ Pentland. Deep-mood: Forecasting depressed mood based on self-reported histories via recurrent neural networks. In Proceedings of the 26th International Conference on World Wide Web, WWW ’17, pages 715–724. International World Wide Web Conferences Steering Committee, 2017.
[35] Duyu Tang, Furu Wei, Bing Qin, Ting Liu, and Ming Zhou. Coooolll: A deep learning system for twitter sentiment classification. In Proceedings of the 8th International Workshop on Semantic Evaluation (SemEval 2014), pages 208–212, 2014.
[36] Marcel Trotzek, Sven Koitka, and Christoph M Friedrich. Utilizing neural networks and linguistic metadata for early detection of depression indications in text sequences. arXiv preprint arXiv:1804.07000, 2018.
[37] Marcel Trotzek, Sven Koitka, and Christoph M. Friedrich. Word embeddings and linguistic metadata at the clef 2018 tasks for early detection of depression and anorexia. In CLEF: Conference and Labs of the Evaluation Forum, 2018.
[38] Duy-Tin Vo and Yue Zhang. Target-dependent twitter sentiment classification with rich automatic features. In Proceedings of the 24th International Conference on Artificial Intelligence, IJCAI’15, pages 1347–1353. AAAI Press, 2015.
[39] Yu-Tseng Wang, Hen-Hsen Huang, and Hsin-Hsi Chen. A neural network approach to early risk detection of depression and anorexia on social media text. In CLEF: Conference and Labs of the Evaluation Forum, 2018.
[40] You Zhang, Jin Wang, and Xuejie Zhang. Ynu-hpcc at semeval-2018 task 1: Bilstm with attention based sentiment analysis for affect in tweets. In Proceedings of The 12th International Workshop on Semantic Evaluation, pages 273–278. Association for Computational Linguistics, 2018.
[41] Peng Zhou, Wei Shi, Jun Tian, Zhenyu Qi, Bingchen Li, Hongwei Hao, and Bo Xu. Attention-based bidirectional long short-term memory networks for relation classification. In Proceedings of the 54th Annual Meeting of the Association for Computational Linguistics (Volume 2: Short Papers), pages 207–212. Association for Computational Linguistics, 2016.
[42] Shusen Zhou, Qingcai Chen, and Xiaolong Wang. Active deep learning method for semi-supervised sentiment classification. Neurocomputing, 120:536–546, 2013.
[43] William WK Zung, Carolyn B Richards, and Marvin J Short. Self-rating depression scale in an outpatient clinic: further validation of the sds. Archives of General Psychiatry, 13(6):508–515, 1965.
Biographies

Boumahdi Fatima obtained the BS and master degree in computer science from Saad Dahlab University, Blida 1, Algeria, in 2006. She got the PhD degree in computer science from the National School of Computer Science (ESI), Algier, Algeria, in 2015. Since 2015, she is assistant professor in Sciences Faculty at Saad Dahleb University, Blida, Algeria. She published numerous publications in the areas of Decision Support Systems, Web information systems, and Service Oriented Architecture. Her current research interests and endeavours mainly go out to natural language processing, Sentiment Analysis, Deep learning and Artificiel Intelligence.

Madani Amina is a Lecturer at Department of Informatics, Saad Dahleb University – Blida 1, Algeria. She has received her Ph.D at the National School of Computer Science (ESI), Algiers in May 2017. Her interests in research include: Data Mining, Deep Learning, Natural Language Processing, Sentiment Analysis, Trending Topics and Social Networks.

Rezoug Nachida is a Lecturer at Department of Informatics, Saad Dahleb University – Blida 1, Algeria. She has received her Ph.D at the National School of Computer Science (ESI), Algiers in May 2016. Her main research interests are in data warehousing solutions, data mining and OLAP system, decision support system, and context-aware recommender system. She has co-authored in numerous papers in proceedings of international conferences.

Hentabli Hamza obtained the BS degree in computer science from Saad Dahlab University, Blida 1, Algeria, in 2003. He got the master and PhD degree in computer science from Universiti Teknologi Malaysia, johor (Malaysia), in 2019. His current research interests lie in the fields of Information Retrieval, Cheminformatics, Image Processing, Deep learning and Data Mining.
Journal of Web Engineering, Vol. 19 3-4, 429–456.
doi: 10.13052/jwe1540-9589.19344
© 2020 River Publishers