Elastic Performance Test Method of Web Server in Cloud Computing Environment
Xin Su and Xiaohui Li*
Department of Computer & Information, Hebei Petroleum University of Technology, ChengDe, 067000, China
E-mail: xiaohui9702@163.com
*Corresponding Author
Received 05 June 2021; Accepted 20 June 2021; Publication 28 April 2021
Abstract
In the process of traditional web server elastic performance test, the performance of tracking data is poor, which leads to excessive server jitter and poor accuracy of elastic test results. Therefore, this paper studies the network server elastic performance test method in cloud computing environment. In this method, cloud monitoring technology is used to track the operation data of Web server. According to the multi platform call mode of Web server, a statistical regression model is established to determine the elasticity measurement index. The load balancing algorithm is used to test the server load balancing to obtain the elasticity value of Web server. Experimental results: in the whole running period of Web server, the jitter times of the proposed method are 15.6066 times, 16.5600 times and 16.5733 times lower than those of the three traditional methods, respectively. It can be seen that the new test method can accurately track the response ability of the server and obtain more accurate elasticity value.
Keywords: Cloud computing, Web server, elastic performance, jitter times.
Introduction
At present, many institutions and scholars at home and abroad have studied elasticity, but the definition of elasticity is still not clear. Among them, NIST, the more authoritative one, defines flexibility as the ability to dynamically acquire or release resources, which is affected by some external or internal factors, so as to automatically expand its resource scale [1]. IBM, a giant in the industry, believes that flexibility and scalability are consistent in concept, and can automatically increase or decrease resources. Herbst and others defined resilience as automatically adjusting and adapting to the load changes of the system, and at the same time, resource allocation and supply ensure that resources match the load they face. Al-Dhuraibi et al summarized resilience as the ability of a system to rapidly increase and remove resources in order to adapt to load changes in real time. Chilipirea and others believe that the flexibility in cloud computing is the ability to adjust the amount of resources on demand. Sotiriadis and others regard resilience as the ability of cloud system to adjust virtual resources according to the needs of users.
The concept of cloud was first established on the basis of cloud computing. The word “cloud computing” was first widely spread in 2006. In August 2006, at the SES (search engine strategy) conference held in San Jose, Google CEO Eric Schmidt answered the questions raised by the moderator. Cloud computing originated from Internet companies, they need cost control, management and maintenance of tens of thousands of servers [2].
For the objective and comprehensive evaluation of cloud computing, it is necessary to collect the operation data in real time and make reasonable use of elastic measurement index for comprehensive analysis. This involves a variety of technologies, including load simulation technology, cloud monitoring technology and benchmark test technology. There are many types of business load applied to cloud computing system, including linear, exponential and random modes. According to the actual load change, the steady load change and sudden load change are simulated. Currently, the common load generators are JMeter, faban, siege, etc. [3]. Cloud monitoring technology mainly detects cloud resources and services. The resource indicators are CPU and memory, and service indicators mainly include latency and throughput. Currently, the most common cloud monitoring tools are cloudwatch, chukwa, ganglia, etc. [4]. Benchmark technology refers to the technical benchmark for evaluating and testing the test object through standard test methods, testing process and testing tools, and is the trend of elastic test standardization [5].
In order to reduce Web server jitter and enhance its elastic value, this study takes the load simulation technology proposed in reference [3], cloud monitoring technology proposed in reference [4] and benchmark testing technology proposed in reference [5] as reference. In order to reduce Web server jitter and enhance its elastic value, this paper studies the Web server elastic performance testing method in cloud computing environment, and establishes statistical regression model based on cloud monitoring technology, Determine the elastic metrics to achieve the Web server elastic performance test.
1 Elastic Performance Test Method of Web Server in Cloud Computing Environment
1.1 Cloud Monitoring Technology Tracks Web Server Operation Data
The traditional test scheme of Web server can’t realize the lossless transmission of data, just send the measurement data, but can’t guarantee whether it can reach the data processing end. This study introduces cloud monitoring platform to track the running data of Web server. The overall structure of cloud monitoring platform is divided into data acquisition layer, data processing layer, data storage layer and user query layer from bottom to top. The data acquisition layer is composed of multiple collectors. The collector sends the real-time data to the local server, and then the local server transmits it to the data processing layer through the network. The data processing layer is based on the real-time data of storm, and the real-time data tracking algorithm ensures the reliability of data processing. The data storage layer is established by the combination of redis database and MySQL database. The user query layer consists of Web server and client. The Web server pushes the real-time data to the Website platform built by HTML5. Use the client to access the platform through the browser to view real-time data and historical data [6]. In this method, the real-time data processing process is tracked to ensure that the data can be processed reliably. The real-time data stream is sent to the output processing node, and the output sends the data to the bolt in the form of tuples. When the thread passes through the bolt, all tuples are recorded to form a tuple tree. If all the nodes in the tuple tree have been processed, it means that the real-time data has been completely processed; otherwise, it means that there are still unprocessed nodes in the tuple tree [7]. Cloud monitoring technology in cloud monitoring platform, real-time data processing process, as shown in Figure 1.
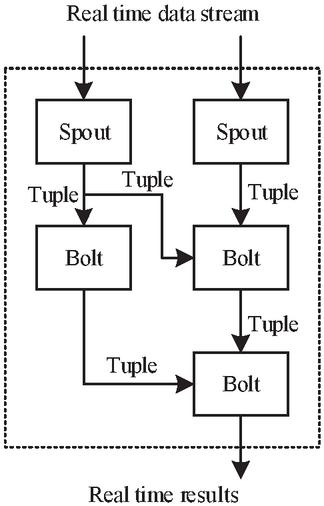
Figure 1 Real time data processing.
According to the real-time data processing process shown in Figure 1, the data tracking steps of cloud monitoring technology are set. Ensure that a data is assigned a unique identification F, such as F 1010, and inform the monitoring thread and the relevant Bolt in Topology to monitor and calculate. The two Tuples sent by spot are recorded as Tuple1 and Tuple2 respectively, and a 64 bit data ID is assigned, namely FTuple1 0110 and FTuple2 1100. After the allocation, the monitor thread performs XOR operation on FTuple1 and FTuple2, that is, 0110XOR1100 1010. Spout sends Tuple1 (FTuple 0110) to a Bolt in Topology, marking the Bolt as Bolt1. Bolt1 processes Tuple1 and generates a new Tuple, which is recorded as Tuple3. Bolt1 randomly assigns a new identifier, named FTuple3 1101, FTuple1 0110, and the XOR result of FTuple3 1101 is 1011. Finally, the monitor thread XORs 1010 and 1011, and the result is 0001. Similarly, Spout sends Tuple2 (FTuple2 1100) to another Bolt in Topology, marking the Bolt as Bolt2. After Bolt2 receives Tuple2, it processes it, generates a new Tuple, and randomly assigns an ID, which is recorded as FTuple4 0101. FTuple2 1100, and the XOR result of FTuple2 and FTuple4 is 1001. After the monitoring thread XORs the result, the result is 1000. Finally, Tuples sent by Bolt1 and Bolt2 flow to the same Bolt node, marking this node as Bolt3. At this time Bolt3 informs the monitoring thread, receives all Tuple monitoring threads issued by the previous Bolt, and performs exclusive or operation on the identity of Tuple3 and Tuple4 received, that is 1101XOR0101 1000. Finally, the monitoring thread XORs the result, and there is 1000XOR1000 0000 [8, 9]. The results show that every Tuple in Tuple tree has been successfully processed. In other words, the real-time data sent to Storm will not have packet loss processing, which realizes the real-time tracking of Web server running data by cloud monitoring technology.
1.2 Get Web Server Multi Platform Call Mode
Web service is based on RPC. An important idea of RPC is to make remote call look like local call. Client stub is an important part to ensure this feature. Stub is a piece of code used to convert the parameters passed in the RPC process, including the problem of size between different OS [10]. In java development environment of Linux platform, client stub code is generated when Web service interface is called, so Axis2 code generator plug-in can be used in Eclipse to generate available stub code automatically according to WSDL file. According to the WSDL generated by querying the alarm level interface in service publishing, the description file generates the Java code of the client stub, and the client calling code of the interface is written by calling the generated stub code. In the process of cloud monitoring, the Web front-end calls the interface to query the warning level through the bottom layer, and displays the information related to the alarm level in the browser page, including the alarm type, task initiation and abnormal problems. It can set different alarm levels for each alarm type according to the demand, and update the background database by calling the bottom layer interface. In Android platform, there is no class library related to calling Web service. Therefore, if necessary, the Web service client development kit of Web service PC can only be called through the third-party SDK. However, these are too large for the Android mobile platform, and they may not be easy to transplante to the Android platform. Therefore, it will not consider using these development frameworks any more. When calling Web service on Android platform, it relies on the third-party class library Ksoap2, which is a SOAP Web service client development kit for resource constrained Java environment. But in Android platform, instead of using Ksoap2 directly, Ksoap2-android is used. Ksoap2-android is equivalent to the porting version of Ksoap2 on Android platform. It is an efficient and lightweight SOAP development package.By calling the JSON format, this paper encapsulates the network topology information string. There are many ways to parse JSON data. You can use the official JSONObject, Google’s open source library GSON, and some third-party libraries such as Jackson or FASTJSON. The acquisition of Web server in Android platform call mode, all using GSON to complete [11].
In the interface calling mode based on RESTfuI Web service, RESTfuI has the characteristics of cross platform and cross language. REST abstracts the object as a resource, which is addressable. Through the general method defined by HTTP protocol, URI protocol is used to identify the interface published by a resource. Therefore, whether it is Java or Android platform, the process of requesting a resource is to access a specified and descriptive URI, and transfer the description of the resource from the server to the client through HTTP, instead of the stub program similar to the SOAP based Web service client. The client package Jersey client of Jersey 2. X implements the client API of JAX-RS2.0 and extends it with hot plug. The client API requests Web resources through HTTP, which makes the client API conform to the uniform interface and REST architecture style. At the same time, the client API can be consistent with the server in concept and extension point. Compared with Apache HTTP client and HTTP URL connection, the client API has a REST aware high-level API. The REST client mainly includes three interfaces, javax.ws.rs.client.Client, javax.ws.rs.client.WebTarget and javax.ws.rs.client.Invocation. Client interface is the basic interface of REST client, which is used to communicate with REST server. It is defined as a kind of heavyweight object. Its internal requirement is to manage the bottom layer of client communication and realize the management of various objects. Therefore, it is not recommended to generate a large number of client instances in the application. Jersey’s implementation class of JAX-RS2.0 client interface, and it is org.glassfish.jersey.client.JerseyClient. The WebTarget interface is an interface to locate resources for rest clients. Through the WebTarget interface, the specific address, query parameters and media type information of the requested resources can be defined. Jersey implements the WebTarget interface of JAX-RS2.0, and it is org.glassfish.jersey.client.JerseyWebTarget. The invocation interface is an interface that initiates requests to the REST server after the resource location configuration is completed. Requests include synchronous and asynchronous modes, which are defined by the builder interface inside the invocation interface. The builder interface inherits the standard HTTP request defined by SyncinvokeroSyncinvoker [12]. Through the above analysis, the SOAP based Web service and RESTfuI Web service based Web server multi platform call mode are obtained.
1.3 Establish Statistical Regression Model to Determine the Elastic Measurement Index
Regression model is a common model to establish quantitative analysis model with statistical analysis method. There are many classification methods for regression model. In this paper, regression models are divided into linear regression model and nonlinear regression model. In the actual production environment, when the time is taken as the horizontal axis and the system load is taken as the vertical axis, it can be concluded that the request load of the system should be a nonlinear regression model. However, the proposed method will use linear statistical regression model to estimate the system load. Maybe this regression model is not the best way to deal with this problem, but there are enough good reasons to choose this model to test the resilience of Web servers in the cloud computing environment [13]. The proposed method adjusts the number of system server instances and updates the performance model in the form of a cycle. Although the user can freely adjust the time interval of the cycle, it is usually within 2030 s as the time interval of the cycle. During this period, the request load can be approximately considered as a linear statistical regression model. Even in the time interval of this cycle, the request load behaves as a nonlinear model. Because the elastic test method proposed in this paper considers whether the curve of the number of requests and the average number of requests is linear or non-linear in a cycle period, which will not affect the final conclusion of the elastic test results. In addition, even for the cloud platform with excellent performance, it takes several minutes to get and start the server instead. In a cycle, the cloud platform cannot respond to the load request curve. Therefore, it is reasonable and acceptable to estimate future load by linear regression model. In the load estimation test task of this paper, the linear regression model in statistical learning is used as the load model, and the ordinary least squares method is used for linear fitting of this model [14]. The linear regression model is a unitary linear regression model with load corresponding to time. It is expressed in the form of:
| (1) |
In the formula: represents the estimated number of requests in the system where the server is located; represents the time independent variable; represents the slope; represents the offset value, which represents the intercept in the number axis. After obtaining the dependent variables of time independent variables and the number of system requests in several cycles through the historical data recording system, the ordinary least squares method is used to find the best function matching of these data pairs by minimizing the sum of squares of errors [15]. The work of ordinary least squares method is to ensure that the selected regression model can minimize the sum of squares of residual errors of all observed values. This method is usually the most common method of linear regression fitting model, which is very sensitive to outliers on the premise of ensuring the approximation between fitting curve and real curve. In order to obtain the fitting curve with the least sum of squares of residuals, the following function can be obtained by transforming the above formula:
| (2) |
In the formula, is a constant value. At this time, the system request load fitting problem has been transformed into the problem of getting the correct correlation coefficients and to minimize the function. This means that the problem of system request load fitting has been transformed into an extreme value problem with and as independent variables and as dependent variables [16]. Usually, the extremum of a function is obtained when the derivative of the function is zero. By solving the equation that the partial derivative of function is zero, it can get the following results:
| (3) |
After substituting the two correlation coefficients into the linear regression model expression, the linear model of the system load model is established. According to the calculation results of the above model, the elastic measurement index is set.
1.4 Test Server Load Balance to Get Server Elasticity Value
The workload is highly dynamic. If the change of load is not considered in the test process, and only the same deterministic factors as the average load are used to determine the migration of virtual machine, it will lead to physical service overload and increase the risk of violating SLA agreement. Benson et al.’s research shows that the demand of virtual machine for specific resources is dynamic and can be characterized; Chen et al.’s research thinks that the resource demand of virtual machine is from normal distribution. Generally speaking, the load balancing algorithm of virtual machine migration needs to follow the three principles of when to migrate, which virtual machine to migrate and where to migrate. In addition, it needs to ensure that the total consumption of virtual machine migration is as small as possible [17]. Therefore, this paper designs a random load balancing algorithm to make effective decision-making of virtual machine migration, so that the total demand of virtual machine resources of each physical server does not exceed the capacity threshold of its resources, and minimize the consumption of virtual machine migration. The data center analysis model designed in this paper consists of physical servers and virtual machines. Among them, the capacity occupied by resource on physical server is recorded as , and the random demand of virtual machine for resource is recorded as . The probability distribution of can be estimated by measuring the state of virtual machine during the operation of data center. Set as index variable. If virtual machine is placed on server , exists, otherwise . The matrix is defined as the placement matrix of virtual machine on physical machine. The load balancing algorithm used in virtual machine migration is to calculate and update the placement matrix [18]. The limiting condition of placement matrix calculation is that the total demand of each physical server to allocate resources for each virtual machine placed on it does not exceed the probability of and is not less than , which can be expressed by the following formula:
| (4) |
In the formula: is the threshold of overload probability of each server, which can be determined by protocol, and represents the risk of each physical server violating the protocol. According to Arzuaga’s research, the consumption of virtual machine migration process is determined by the memory capacity of the virtual machine to be migrated and the distance between the source server and the destination server. Let be the memory occupation of virtual machine , and be the distance from server to server . then the total consumption of virtual machine migrating to the updated location is . When virtual machine moves from server to server , there is , otherwise . Therefore, the analytic result of random load balancing problem is [19]. The above result is a non deterministic polynomial, and there are a large number of virtual machines and physical servers in the data center, which increases the computational complexity. Therefore, this paper uses a heuristic algorithm to solve the problem of high burst load balancing. Figure 2 shows the test scheme of elastic load balancing for Web server.
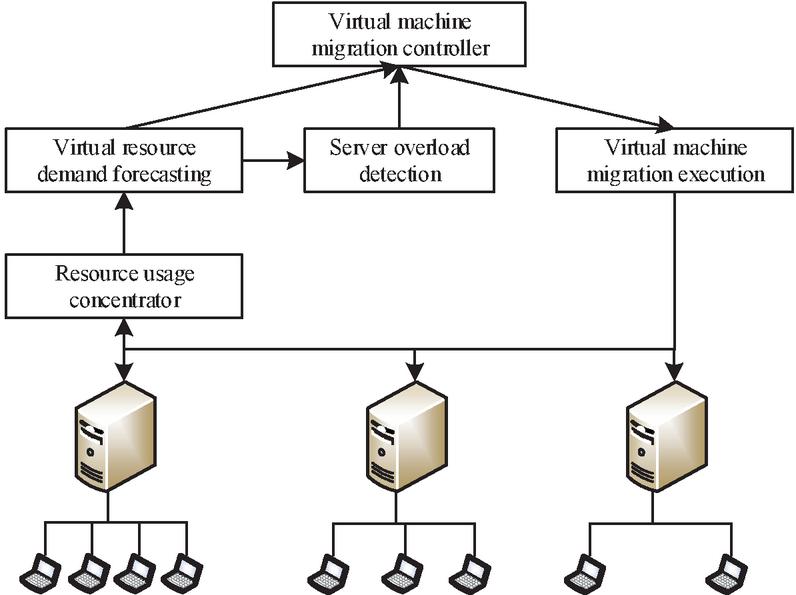
Figure 2 Elastic load balancing test scheme.
According to the test method shown in Figure 2, the evaluation results of Web server elasticity in cloud computing environment are obtained, and the test of Web server elasticity is realized [20].
2 Experimental Study
In order to verify whether the test method has practical performance, a simulation comparative test experiment is proposed. Taking the proposed elastic performance test method as the test object of the test group, three groups of traditional elastic performance test methods, namely control group A, control group B and control group C, are used as the comparison objects, which are load simulation technology proposed in reference [3], cloud monitoring technology proposed in reference [4] and benchmark test technology proposed in reference [5].
2.1 Setting Up the Experimental Environment
The experimental operating system is Windows 2018a and the browser is IE11.0. Matlab R 2018a is selected as the simulation software, and Dev Test is used as the simulation test recording tool. In order to ensure the authenticity and reliability of the experimental results, several rounds of Web server elastic performance tests are carried out. In order to get more accurate test results, the Web server is set to have different times of resource requirement changes in three cycles.
Four different methods are used to test the flexibility of Web server in cloud computing environment, and compare the jitter times of Web server system under different methods. Build the experimental test environment. The hardware of the experimental environment includes voltage sensor, DC electronic load, signal conditioning box, F/V sensor, F/V converter, signal collector, industrial computer and battery. Connect the above hardware to build a stable test environment. The basic test data are obtained by simulation software, and the experimental results are output in the form of images.
2.2 The Web Server Jitter Time Test
In order to make the test results universal, the number of resource requirement changes in the three test cycles is 47, 992 and 9835 respectively. In the actual test, when the jitter number is less than 30 times, the accuracy of the data will be higher. Four groups of methods are used to test the elastic performance of Web server under different resource requirements. The test results are shown in Figure 3.
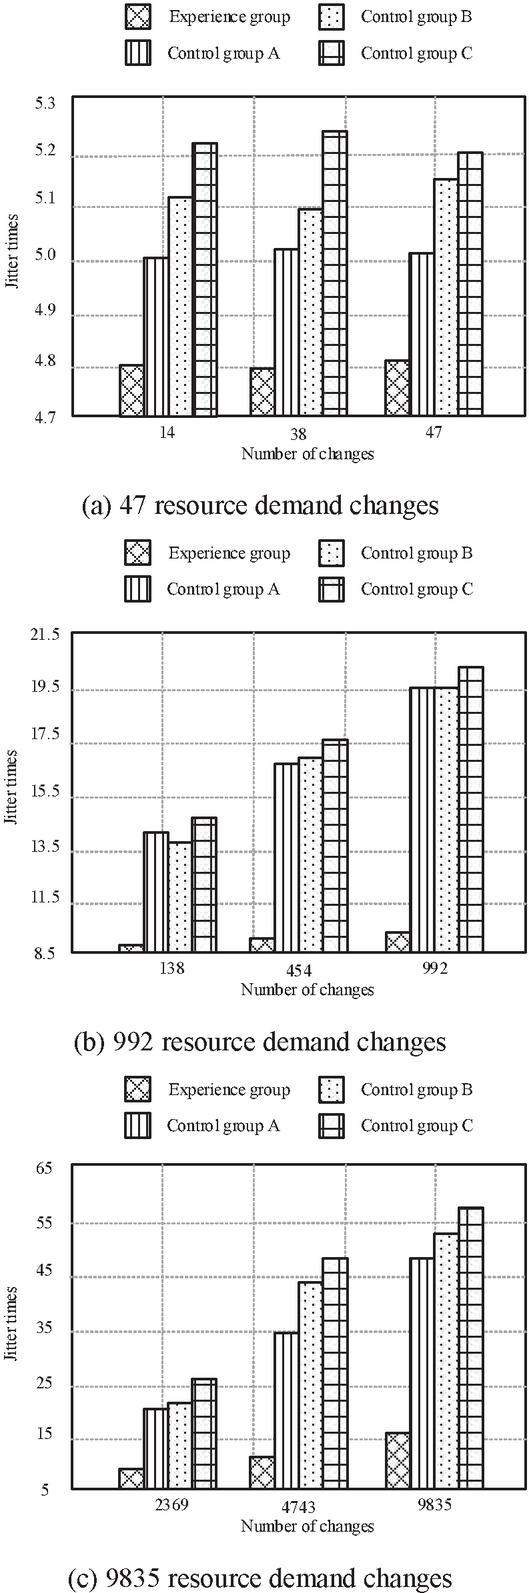
Figure 3 Test results of Web server jitter times.
According to the above experimental results, when the number of resource requirement changes is less than 100, the jitter times obtained by the four methods are highly similar. When the number of resource requirements changes is more than 500 times, the Web server makes real-time response according to these changes, so as to adjust the actual resources. At this time, the shaking times of the experimental group had a weak change, while the shaking times of the three control groups began to increase significantly. When the number of resource demand changes is close to 10,000 the jitter number of the experimental group has a certain increase, but considering the other three groups of methods, the jitter number of the experimental group is relatively smaller.
2.3 Jitter Times Test
In order to get more accurate test results, the experiment was repeated five times, and the jitter times of three groups of experiments under 15 tests were calculated. The results are shown in Table 1 below.
Table 1 Jitter times test results
| Number of Resource | Experience | Control | Control | Control | |
| Demand Changes | Turn | Group | Group A | Group B | Group C |
| 47 | 1 | 4.8 | 5.0 | 5.1 | 5.2 |
| 47 | 2 | 5.2 | 4.9 | 4.9 | 5.1 |
| 47 | 3 | 4.7 | 4.9 | 4.9 | 5.0 |
| 47 | 4 | 4.8 | 5.2 | 4.9 | 5.0 |
| 47 | 5 | 5.0 | 5.2 | 5.0 | 5.1 |
| 992 | 1 | 9.4 | 19.2 | 19.2 | 19.7 |
| 992 | 2 | 10.3 | 19.6 | 20.9 | 20.3 |
| 992 | 3 | 9.9 | 19.5 | 20.6 | 20.2 |
| 992 | 4 | 9.8 | 20.8 | 19.7 | 19.8 |
| 992 | 5 | 10.0 | 19.3 | 20.1 | 19.4 |
| 9835 | 1 | 15.3 | 46.3 | 50.7 | 55.9 |
| 9835 | 2 | 16.7 | 49.8 | 55.9 | 58.1 |
| 9835 | 3 | 15.2 | 52.4 | 54.8 | 52.3 |
| 9835 | 4 | 15.4 | 58.6 | 56.2 | 54.9 |
| 9835 | 5 | 15.4 | 55.3 | 57.4 | 54.5 |
For the convenience of comparison, calculate the average jitter times of the Web server during the whole running period of the system. The statistical results are shown in Table 2 below.
Table 2 Average results of jittering times
| Number of Resource | Experience | Control | Control | Control |
| Demand Changes | Group | Group A | Group B | Group C |
| 47 | 4.9 | 5.04 | 4.96 | 5.08 |
| 992 | 9.88 | 19.68 | 20.1 | 19.88 |
| 9835 | 15.6 | 52.48 | 55 | 55.14 |
| Mean value | 10.1267 | 25.7333 | 26.6867 | 26.7000 |
Based on the test results shown in Tables 1 and 2, it is found that the average jitter times of the Web server in the whole operation period of the system are 15.6066 times, 16.5600 times and 16.5733 times higher than those of the other three groups of methods, respectively. It can be said that under the same test conditions, the jitter data obtained by this method is smaller and closer to the real data. The main reason is that, this paper determines the elastic measurement index of Web server running data tracked by cloud monitoring platform according to regression model, and realizes the elastic value test of Web server by load balancing algorithm, which improves the performance of tracking data.
3 Conclusion
This research combines the load simulation technology and cloud monitoring technology, and proposes a new Web server elastic performance test method, which provides a more reliable technology for the elastic test results in the cloud computing environment. However, according to the overall research content in this paper, it is difficult to avoid the noise signal interference when testing the elastic value, and there is no description of the noise reduction process in this paper. In the future, we can focus on this work and analyze the anti noise ability of this method. In the future, the relevant research can focus on this work and analyze the anti noise capability of the method.
Acknowledgement
Research on the Application of Intelligent Recognition in Smart Home Communication Protocol Selection in Artificial Intelligence , Fund Source: Self-financed Project of Hebei Province Key R&D Program, No. 18210338.
References
[1] Retwitzer MD, Reinharz V, Churkin A, et al. incaRNAfbinv 2.0: a Webserver and software with motif control for fragment-based design of RNAs[J]. Bioinformatics (Oxford, England), 2020, 36(9).
[2] Shehzad AC, Kim IL, Seungmin R, et al. An improved anonymous authentication scheme for distributed mobile cloud computing services[J]. Cluster Computing, 2019, 22(1).
[3] Li WL, Lu Y, Guo D, et al. Research on Road Load Simulation Technology of Commercial Vehicle Driveline Based on Chassis Dynamometer[J]. SAE International Journal of Commercial Vehicles, 2020, 14(1).
[4] Li F, Niu D, Li T, et al. Research and design of cloud monitoring and management system for intelligent stereo garage[J]. The Journal of Engineering, 2019, 2019(22).
[5] Marijke B, Lex VV, Hermie H. Assessing usability of eHealth technology: A comparison of usability benchmarking instruments[J]. International Journal of Medical Informatics, 2019, 128.
[6] Xiao P, Liu DB. A Novel Cloud Monitoring Framework with Enhanced QoS Supporting[J]. International Journal of e-Collaboration (IJeC), 2019, 15(4).
[7] Vala, Patel, Gosai, et al. A low-cost and efficient cloud monitoring camera system design for imaging satellites[J]. International Journal of Remote Sensing, 2019, 40(7).
[8] Fabio A, Vittorio C, Marco G, et al. Analytical modeling of performance indices under epistemic uncertainty applied to cloud computing systems[J]. Future Generation Computer Systems, 2020, 102.
[9] Chakraborty P, Honnappa H. A many-server functional strong law for a non-stationary loss model[J]. Operations Research Letters, 2021, 49(3).
[10] Jeganathan K, Harikrishnan T, Selvakumar S, et al. Analysis of Interconnected Arrivals on Queueing-Inventory System with Two Multi-Server Service Channels and One Retrial Facility[J]. Electronics, 2021, 10(5).
[11] Papachristos I, Pandelis DG. Optimal server assignment in a two-stage tandem queueing system[J]. Operations Research Letters, 2020, 48(1).
[12] Tal N, David P. Mixed fault tolerance in server assignment: Combining reinforcement and backup[J]. Theoretical Computer Science, 2020, 836.
[13] Álvarez VA, Muñiz CM, Fernández CA, et al. A geometry and temperature dependent regression model for statistical analysis of fracture toughness in notched specimens[J]. Engineering Fracture Mechanics, 2021, 242.
[14] Yousef GA, Ma XL, Zhao XD, et al. A statistical model for dew point air cooler based on the multiple polynomial regression approach[J]. Energy, 2019, 181.
[15] Kingsley A, Basil P. Fuzzy-statistical prediction intervals from crisp regression models[J]. Evolving Systems, 2019 (prepublish).
[16] Paulo P, Jean A, Matheus T, et al. Stochastic performance model for Web server capacity planning in fog computing[J]. The Journal of Supercomputing, 2020 (prepublish).
[17] Julian V, Jorge JC, Manuel JB, et al. High-Performance Time Server Core for FPGA System-on-Chip[J]. Electronics, 2019, 8(5).
[18] Hong HY, Tsangaratos P, Ilia I, et al. Introducing a novel multi-layer perceptron network based on stochastic gradient descent optimized by a meta-heuristic algorithm for landslide susceptibility mapping[J]. Science of the Total Environment, 2020, 742.
[19] Ghulam H, Khurram SA, Imran K. Electric load forecasting based on deep learning and optimized by heuristic algorithm in smart grid[J]. Applied Energy, 2020, 269.
[20] Debankur M, Sem CB, Johan SHL, et al. Asymptotic Optimality of Power-of-d Load Balancing in Large-Scale Systems[J]. Mathematics of Operations Research, 2020, 45(4).
Biographies

Xin Su was born in 1981, He has gained master degree of computer, major in Multimedia, he has worked in hebei petroleum university of technology since 2009, teaching courses such as C Language Programming, image processing, etc. As associate professor, her main research domaines are laaS, big data, data visualization.

Xiaohui Li was born in 1978, She has gained master degree of computer, major in applications of computer network. She has worked in hebei petroleum university of technology since 2005, teaching courses such as C Language Programming, .net Programming, software project management, soft test, etc. As associate professor, her main research domaines are software project, network application.
Journal of Web Engineering, Vol. 20_5, 1641–1658.
doi: 10.13052/jwe1540-9589.20514
© 2021 River Publishers