The Collaborative Production Management System of Power Enterprises Based on Online Information Sharing
Yu Guoji*, Zhong Jianxu, Yu Shaofeng, Liao Chongyang and Ma Yining
CSG Power Generation Company Information Communication Branch, GuangZhou, 511400, China
E-mail: Yugj@pgc.csg.cn
*Corresponding Author
Received 08 June 2021; Accepted 20 June 2021; Publication 28 April 2021
Abstract
With the development of online information sharing, high-tech equipment for collaborative production management of power enterprises emerges endlessly. Therefore, it is necessary to design the collaborative production management system of power enterprises based on online information sharing to meet the information sharing needs. In terms of the hardware, the B/S structure was built, and the computer was debugged with Cascading Style Sheet (CSS). In terms of the software, Hadoop horizontal architecture technology framework was designed, the physical deployment was carried out, the production management center module was designed, and the production operation chain was monitored and managed to realize the collaborative production management of power enterprises. The experimental results showed that the designed collaborative production management system of power enterprise had high reliability and friendliness, the highest reliability is 97.2%, the highest friendliness is 99.8%, which meets the current demand.
Keywords: Online information sharing, electricity, power enterprises, production management system.
Introduction
With the development of big data, intelligent power high-tech equipment emerges endlessly. Intelligent meter reading system, intelligent online condition monitoring system, intelligent fault diagnosis system in power, intelligent operation analysis system, and a power panoramic big data visualization are gradually built and applied. The scale and types of smart grid data are growing rapidly. Traditional power systems are unable to process multi-source data, including heterogeneous data and unstructured data. The data volume has been increased from the original GB level to PB level. It is difficult to obtain real-time dynamics and cannot show the overall situation of power operation. Therefore, traditional technologies can no longer meet the needs of the rapid development of power enterprises. In this regard, document [1] screens the problem, selects the target survey objects, conducts an online survey to collect 124 complete questionnaires from Malaysian manufacturing enterprises, tests the structural model and hypothesis statements, determines the relatively important driving factors of inventory efficiency, and has a positive relationship between inventory sharing and inventory efficiency. Document [2] Finding that international students share both similarities and differences in the use and sharing of information and communication technologies with other students and migrants, as well as a range of settlement barriers and assistance related to information and communication technologies, and that the transferable findings of information and communication technologies in supporting the information, social and emotional needs of international students fill in the gaps in our existing knowledge regarding the use of information and communication technologies and online information sharing by international student migrants. Literature [3] examines how credit reporting affects where companies have access to credit and how lenders enter into contracts with them, highlighting the mixed impact of financial technologies for greater transparency on credit availability.
This paper integrates the above research methods to support the development and innovation of electric power enterprises by introducing big data technology, and make full use of relevant business data and external data of the College of Electric Power to give full play to the comprehensive advantages of the College of Electric Power. Big data technology includes data processing, data analysis, data modeling, data presentation, artificial intelligence, etc. [4–7]. A data asset is the core of management for power enterprise management, which adopts cutting-edge big data technology, including the Hadoop distributed framework, Hadoop Distributed File System (HDFS), hive databases, distributed offline computing, spark real-time computing, storage data based on HBase, etc., to build the ecological environment of power enterprises and formulate strategies for power companies. To improve the scientific ability of power enterprises in the fields of power system analysis, power automation, marketing, and power distribution and utilization, big data should be adopted to innovate in daily equipment operation of power grid and management of power enterprises, including business innovation and technical innovation, and improve the market competitiveness of power enterprises.
Design of Hardware
B/S Structure
B/S structure was built before the design of the collaborative production management system of power enterprises. First of all, we built the structure on the J2EE platform, combined with the MVC framework. In the design of the collaborative production management system of power enterprises, we adopted Cascading Style Sheet (CSS) technology to design each page of the system, which could achieve the software real-time better dynamic and interactive display [8–10].
At present, with the development of information technology, especially the rapid updating of web-based information systems for publishing and retrieval technology and the diversification of customer demand for system software. In the actual system development and design work, the traditional master-slave structure C/S gradually evolves into a multi-level distributed structure [11]. The client of the application system of B/S structure is the browser, and the client of the engineering application is the webserver. Data and application-related files are stored on the server.
As shown in Figure 1, the application on the server has been extended dynamically. According to the basic principles of communication engineering, the server layer itself has a multi-layer structure. The data processing type of the B/S structure itself can also be expanded dynamically [12–14]. In the principle of practical communication engineering technology, in the maintenance system developed with B/S structure, the main work of development and maintenance is concentrated on the server. The server in actual operation does not need maintenance. This model has a wide range of work and strong applicability. Therefore, the legitimate user of the browser can use the browser easily.
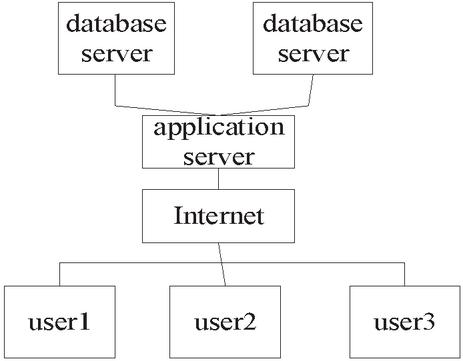
Figure 1 B/S structure mode diagram.
Because the B/S structure concentrates the core part of the system function realization on the server, simplifies the development, maintenance and use of the system, and the basic principles of data interaction and application are unchanged, which is suitable for different task processing of multiple roles in the collaborative production of power enterprises. The B/S structure adopts the working mode of browser request and server response. The main working principle of the B/S structure mainly includes the user submitting form operation in the client, sending a request to the server, and waiting for the corresponding response from the server. At the technical level, the server receives the application and uses the common server-side technology to process the request sent by the client, thus generating a response [15–17]. In the response phase, the actual server returns the relevant request data results to the browser, and then the browser that receives the receipt information interprets and executes HTML language and presents the requirements in the user interface. If the request hits the cache, it will directly return the cache result, or when the back-end response data is consistent with the front-end cache, it does not need to send the data back to the next stage, so as to reduce the amount of response data and response time.
CSS Debugging Computer
CSS is needed to debug the computer to control the page layout. In the actual software development and application, CSS can realize the external standard of separating the structure behavior and performance of web pages. CSS tables can support multiple browsers, independently carry out the style design of the web page, and make dynamic effects in the web page [18]. In practice, CSS has the advantages of simple syntax, easy writing, clear and diverse layout, fast page browsing speed, and easy publishing compared with the traditional software engineering development language. Therefore, CSS is widely used in computer systems.
When debugging the computer, firstly, the rich appearance for the document was provided using the CSS technology, and then the diversity of styles needed to be ensured. The cohesion between elements was shortened, and the text size was modified. Secondly, the same style elements were classified, and CSS to web page settings was applied to facilitate the modification of styles. The same element could be designed many times. Finally, the elements were cascaded in the page to rewrite the page.
Design of Software
Hadoop Horizontal Architecture Technology Framework
The front-end web framework was developed with Java language, using various components, including report visualization, component map display, data transmission component ESB, etc. The back end adopted the Hadoop distributed framework and introduced distributed computing technology, including offline and quasi-real-time computing. Data storage mainly adopted a hive data warehouse. HBase database was used to store detailed data, and MongoDB database was used to store summary data [19]. By introducing spark memory computing, the computing efficiency was improved rapidly. Hadoop cluster could solve future power data growth and could be expanded horizontally based on this framework. It enabled the enterprise management and control system to continuously monitor and deeply analyze the key nodes and key indicators in the production domain, provide a comprehensive and intuitive display platform according to the results and process, assist the decision-making level and management level to deeply grasp the safety production situation, timely discover the management weaknesses, and assist the optimization of management decision-making.
Physical Deployment of Online Information Sharing
The physical architecture of the system was mainly distributed deployment, which realized the distributed storage and computing functions. Memory computing cluster: distributed deployment, master-slave structure, and dynamic expansion of computing nodes. Management and scheduling cluster: load balancing cluster was adopted to ensure the stability and reliability of services in high concurrency. The interface cluster adopted a load balancing cluster, ensuring the stability and reliability of service in high concurrency.
In physical deployment, the establishment of forms is important. The user’s letter table is mainly used for recording basic information. User names can be ID numbers or smart numbers, and the password is composed of numbers and symbols. The password state is divided into two kinds: 1 represents the use, and 0 represents the user’s information table, the English alphabet, and special use. The system role table mainly records each role in the system and describes the specific permission scope of the role. The role names include system administrator, data management administrator, data analysis administrator, operation and maintenance administrator, etc. the role description mainly describes the main tasks of each role. For example, data center administrators are described as data center administrators or data rights management, and the user role table records the corresponding roles of each user.
To identify system objectives, enterprise production process and data from top to bottom, different roles have different tasks, but their basic architecture, namely Figure 1, is the same. Therefore, data can be analyzed at the same time to form a role task model under collaborative production of power enterprises:
| (1) |
In the model, represents the node dynamic expansion model, represents the storage capacity, represents the storage assignment, represents the structure difference, and represent the corresponding constant, represents the load, and represents the balance value.
Design And Production Management Center Module
For production management, a data center is designed for massive data storage, including unstructured data. With the development of big data, the data of power enterprises is increasing rapidly, and the business challenges are large. The advanced enterprise information system is constructed. However, there is still a certain gap compared with foreign power grid enterprises because foreign power enterprise asset management and big data applications in power have moved towards artificial intelligence. As an innovative means of modern enterprise management, big data can provide basic data, analysis methods, and management tools for business management.
Through construction and operation, the data center of the power enterprises has accumulated an amount of business data in marketing, production, finance, materials, human resources, infrastructure, planning, etc. However, the current data center architecture has shown a bottleneck in managing and applying massive data assets. To go online with the integrated business system, the data center needs to improve data collection, storage, and computing capabilities. By introducing web-related technologies, we can construct the data center capability layer, improve the data collection, storage, calculation, and application capabilities, and promote the company’s long-term development.
In this study, the processing flow of the production center is to extract data sources through the ETL cluster, store the data in the data warehouse, and then store the calculated result set in the database through Hadoop distributed computing. According to business results, the data can be stored in HDFS distributed file system and HBase column storage database. The data result set also can be imported to a traditional external database, such as MySQL or Oracle data, and provide self-service analysis or data services for the upper layer based on the database, including data query and data subscription [20]. By setting the collection time cycle, frequency, priority, increment, and full amount collection strategy, the data aggregation task can be flexibly executed to realize the aggregation, transmission, cleaning, and integration of various information resources. The function of exploratory analysis in production management is realized. The content related to quality inspection is built in as analysis items. According to the field metadata, the analysis items are selected. Finally, according to the analysis data, whether to be included in the scope of quality inspection is determined, and the inspection rules are designed.
Monitoring and Management of the Chain for Production and Operation
Enterprise management and control chain operation analysis adopted online information sharing technology to analyze the business about safety production, such as equipment management, production management, safety production evaluation management (power reliability, voltage quality), system operation plan management, power supply guarantee management, etc., and generated analysis reports regularly. Analysis reports could be used to analyze personnel at different levels or meet reports on different occasions. Reports could be divided into different analysis periods of weekly, monthly, quarterly, and annual reports.
According to the design results of the operation analysis function in the production area, the operation analysis function was developed. The special analysis included reliability of power, voltage quality, net asset scrap rate, equipment retirement period, etc. Thematic analysis generated analysis reports regularly, which could be used to analyze personnel at different levels or meet reports on different occasions. The reports could be divided into different analysis periods of weekly, monthly, quarterly, and annual reports.
The comprehensive analysis function was to comprehensively grasp the main business activities of the company’s production management through the monitoring of the operation status, promote the popularization and practicability of the project, summarize the overall operation dynamics and characteristics, reveal the problems, risks, and rules in operation, put forward countermeasures and suggestions, and realize the operation control objectives. The comprehensive analysis included monthly/quarterly summary, semi-annual/annual analysis, etc. The monthly summary was a comparative analysis and a trend analysis on the main business activities and core resources of this month from the dimensions of organization, business field, and severity. The monthly summary was to master the overall situation and characteristics of this month’s operation and make a preliminary cause analysis on the changes exposed in the monitoring, which could provide countermeasures and suggestions. The quarterly summary was a comparative analysis and trend analysis of the main business activities, core resources, and external environment of this quarter from the dimensions of organization, business field, and severity. The quarterly summary was to master the overall situation and characteristics of this quarter’s operation. This paper analyzed the causes of the changes exposed in the monitoring, summarized the common problems, and provided countermeasures and suggestions. A half-year analysis was to analyze the external environment, main business activities, core resources, and comprehensive performance of asset management in half a year, summarize the operation characteristics and rules, clarify the problems and risks in operation, and put forward measures and suggestions. An annual analysis was to analyze the external environment, main business activities, core resources, and comprehensive performance of asset management in the year, summarize the operation characteristics and rules, clarify the problems and risks in operation, and put forward measures and suggestions.
Realizing The Production Management of Electric Power Enterprises
Production management mainly focuses on the dynamic monitoring of the core business, key processes, and core resources of equipment management. By setting a target value for monitoring and early warning value, dynamic monitoring and automatic early warning of changes and problems in the asset operation can be realized. In the specific project construction, the monitoring module will be studied in detail. Combined with the company’s strategy and business needs, the comprehensive monitoring module will be designed and constructed by referring to the relevant successful practices at home and abroad. The big data operation management and control system of power enterprises will adopt the method of combining case analysis and research reports to conduct best practice research and clarify the background and objectives, business scope, construction content, and comprehensive monitoring steps at home and abroad. The experience of international and domestic comprehensive monitoring construction, especially the relevant experience of power industry at home and abroad, is learned to clarify the positioning and objectives, design focus, construction steps of comprehensive monitoring of production equipment management of China Southern Power Grid Corporation.
The collaborative solution function module is mainly used to monitor the production of power grid enterprises and analyze the operation results of abnormal data. The module can solve the problem through communication and coordination and present the operation data dynamically. By coordinating multiple departments and units, we can quickly locate and eliminate the abnormal state, accurately solve the problem, and prevent the risk from happening again. Besides, the specific matters arranged by the leaders can be coordinated and handled synchronously through this module, which can coordinate the implementation of relevant departments and units. The collaborative solution function in this study is mainly based on big data monitoring and big data analysis. With the help of big data computing ability and data mining ability, the collaborative solution function plays an important role in coordination, collaboration, and assistance around the development strategy and goal of power grid companies in production management.
Experiment
To ensure data and system security, we built the same set of environments as the actual operating environment. After the population is clearly defined, the sampling is random, so that all members of the population have the same chance to be selected. It is ensured that the sample selected represents the population as far as possible, and the sample size is moderate, which meets the requirements of statistics, and is feasible with small error. The writing and implementation of the test plan of power enterprises’ collaborative production management system help to achieve the following purposes: check whether the overall function, effect, and performance of the software are consistent with the non-functional requirements of big data operation management and control system in power enterprises; whether there are missing function points; and whether the system can process data normally, guide the whole test process, control the test progress, put forward the test strategy, provide the basis for the test, allocate the relevant resources in the test process, reduce the defects in the systematization, and provide preventive measures for the possible risks in the test process. With the development of information systems, people’s requirements for information systems are increasing, requiring system standards to be improved. The system quality includes few bugs, high performance, high reliability, and good friendliness.
Experimental Preparation
The specific task allocation and time arrangement are shown in Table 1.
Table 1 Schedule of task allocation
| Testing Phase | Task | Working Hours |
| Write a plan | Module operation | 12 h |
| Functional testing | Function arrangement | 6 h |
| System test | Detection module | 8 h |
| Test case | Solution module | 10 h |
| Compatibility test | Friendliness test | 12 h |
| Regression testing | Report submission | 10 h |
In the implementation phase, there are risks such as progress, technology, defects, and other unpredictable risks. Schedule risks mean the inaccurate estimation of workload before testing, and slow change of defects by the development team, leading to delay of the testing schedule. Technical risks mean that the mastery of testing tools is not high enough, and the construction of the testing environment is not objective and practical enough, leading to the failure to reflect the product quality truly. The defect risks mean that the product requirements are not fully understood, the test experience is not rich enough, and the test case writing is not fully covered, leading to the defects of the product and posing a hidden danger for the future product quality.
We should take preventive measures against these risks. For schedule risks, we should analyze the product requirements, estimate the workload, design the test plan, track the defects of the development team before testing, and do regression testing in time. For technical risks, the test of the data management platform should consider the compatibility of each big data component. For defect risks, we should write and review test cases, record, track and solve the defects, and observe the defects that are difficult to reproduce, and summarize the rules. For unpredictable risks, we should and seek others’ help and give solutions.
Experimental Results and Analysis
According to the plan, the test was carried out: we selected 4 groups of samples, collected the information after the test, and tested them fir friendliness and reliability. The results are shown in Table 2:
Table 2 Test results
| Sample | Reliability (%) | Friendliness (%) |
| 1 | 94.3 | 99.8 |
| 2 | 95.2 | 94.2 |
| 3 | 97.2 | 97.2 |
| 4 | 94.6 | 95.7 |
Table 2 shows that the designed collaborative production management system of power enterprises based on online information sharing has high reliability and friendliness, which meets the current demand.
Conclusion
According to the current situation of power enterprises, the collaborative production management system of power enterprises is constructed. The production management problem is solved by introducing online information sharing. The problem of real-time data calculation is solved using data fusion. The operation status of power enterprises can be monitored in real-time, meeting the operational requirements of power enterprises, improving the production efficiency of power enterprises, reducing redundancy, and improving the operation cost. According to the core idea of “Service First, Keep Improving”, the collaborative production management system of power enterprises adopts advanced online information sharing. With business demand as the guide, data driven as the main line and resource integration as the starting point, a complete data lifecycle management system has been established, with the highest reliability of 97.2% and friendliness of 99.8%. The quality of electric power data is improved and the security of data is ensured to implement the government’s integration, sharing, opening, and application of internal and external data resources, boost the overall informatization in-depth application construction of electric power, and enhance the core business cooperation of all units.
References
[1] Yudi Fernando, Ahmed Zainul Abideen, Muhammad Shabir Shaharudin. The nexus of information sharing, technology capability and inventory efficiency[J]. Journal of Global Operations and Strategic Sourcing, 2020, 13(4).
[2] Adam Worrall, Erin Ballantyne, Jen Kendall. “You don’t feel that you’re so far away”: Information sharing, technology use, and settlement of international student immigrants[J]. Proceedings of the Association for Information Science and Technology, 2019, 56(1).
[3] Information Technology – Data Sharing; New Findings from Sloan School of Management Describe Advances in Data Sharing (Does Credit Reporting Lead To a Decline In Relationship Lending? Evidence From Information Sharing Technology)[J]. Computer Technology Journal, 2019.
[4] Anitha Velu, Menakadevi Thangavelu. Hetero-GCD2RDF: An Interoperable Solution for Geospatial Climatic Data by Deploying Semantic Web Technologies[J]. Wireless Personal Communications, 2021, 117 (prepublish).
[5] Xinlei Chen, Dongming Zhao, Wei Zhong and Jiufeng Ye. Research on Information Sharing Technology of Mental Health Alliance Based on Multi-source Heterogeneous Data Fusion Algorithms[J]. Academic Journal of Computing & Information Science, 2019, 2(1).
[6] Bauerle William L. Internode elongation and strobili production of Humulus lupulus cultivars in response to local strain sensing[J]. Scientific Reports, 2021, 11(1).
[7] Mihretie Fekremariam Asargew, Tsunekawa Atsushi, Haregeweyn Nigussie, Adgo Enyew, Tsubo Mitsuru, Ebabu Kindiye, Masunaga Tsugiyuki, Kebede Birhanu, Meshesha Derege Tsegaye, Tsuji Wataru, Bayable Muluken, Berihun Mulatu Liyew. Tillage and crop management impacts on soil loss and crop yields in northwestern Ethiopia[J]. International Soil and Water Conservation Research, 2021 (prepublish).
[8] Bagni Gustavo, Godinho Filho Moacir, Thürer Matthias, Stevenson Mark. Systematic review and discussion of production control systems that emerged between 1999 and 2018[J]. Production Planning & Control, 2021, 32(7).
[9] Wang Mengyue, Huang Hongxuan, Li Jingshan. Transients in flexible manufacturing systems with setups and batch operations: Modeling, analysis, and design[J]. IISE Transactions, 2021, 53(5).
[10] Li Na, Li Yi, Biswas Asim, Wang Jinghong, Dong Hezhong, Chen Jinhua, Liu Chuncheng, Fan Xiangyang. Impact of climate change and crop management on cotton phenology based on statistical analysis in the main-cotton-planting areas of China[J]. Journal of Cleaner Production, 2021, 298.
[11] Moretti Erica, Wickings Kyle, Nault Brian. Environmental factors and crop management that affect Delia antiqua damage in onion fields[J]. Agriculture, Ecosystems and Environment, 2021, 314.
[12] Hansen Veronika, Eriksen Jørgen, Jensen Lars Stoumann, Thorup-Kristensen Kristian, Magid Jakob. Towards integrated cover crop management: N, P and S release from aboveground and belowground residues[J]. Agriculture, Ecosystems and Environment, 2021, 313.
[13] Chen Liang, Xie Hao, Wang Guiliang, Yuan Limin, Qian Xiaoqin, Wang Weilu, Xu Yunji, Zhang Weiyang, Zhang Hao, Liu Lijun, Wang Zhiqin, Gu Junfei, Yang Jianchang. Reducing environmental risk by improving crop management practices at high crop yield levels[J]. Field Crops Research, 2021, 265.
[14] Xue Feng, Zhang Weimin, Xue Fei, Li Dongdong, Xie Shulian, Fleischer Jürgen. A novel intelligent fault diagnosis method of rolling bearing based on two-stream feature fusion convolutional neural network[J]. Measurement, 2021, 176.
[15] Chen Lufeng, Zhang Xing, Cao Mengxi, Pan Yu, Xiao Cailing, Wang Pu, Liang Yong, Liu Guangliang, Cai Yong. Release of legacy mercury and effect of aquaculture on mercury biogeochemical cycling in highly polluted Ya-Er Lake, China[J]. Chemosphere, 2021, 275.
[16] Li Guangdi D., Schwenke Graeme D., Hayes Richard C., Lowrie Adam J., Lowrie Richard J., Poile Graeme J., Oates Albert A., Xu Binbin, Rohan Maheswaran. Can legume species, crop residue management or no-till mitigate nitrous oxide emissions from a legume-wheat crop rotation in a semi-arid environment?[J]. Soil & Tillage Research, 2021, 209.
[17] Guimarães Danielle Vieira, Silva Marx Leandro Naves, Beniaich Adnane, Pio Rafael, Gonzaga Maria Isidória Silva, Avanzi Junior Cesar, Bispo Diêgo Faustolo Alves, Curi Nilton. Dynamics and losses of soil organic matter and nutrients by water erosion in cover crop management systems in olive groves, in tropical regions[J]. Soil & Tillage Research, 2021, 209.
[18] Phoncharoen Phanupong, Banterng Poramate, Cadena Leidy Patricia Moreno, Vorasoot Nimitr, Jogloy Sanun, Theerakulpisut Piyada, Hoogenboom Gerrit. Performance of the CSM–MANIHOT–Cassava model for simulating planting date response of cassava genotypes[J]. Field Crops Research, 2021, 264.
[19] Jha P.K., Araya A., Stewart Z.P., Faye A., Traore H., Middendorf B.J., Prasad P.V.V. Projecting potential impact of COVID-19 on major cereal crops in Senegal and Burkina Faso using crop simulation models[J]. Agricultural Systems, 2021, 190.
[20] Malobane M.E., Nciizah A.D., Bam L.C., Mudau F.N., Wakindiki I.I.C. Soil microstructure as affected by tillage, rotation and residue management in a sweet sorghum-based cropping system in soils with low organic carbon content in South Africa[J]. Soil & Tillage Research, 2021, 209.
Biographies

Yu Guoji, born in 1977, graduated with a bachelor degree in computer science. He started working in informatization since 2001, mainly focusing on power enterprise informatization, design and development of ERP for large business.

Zhong Jianxu, born in 1993, graduated with a bachelor degree in software engineering. He started working in informatization since 2016, mainly focusing on power enterprise informatization, cloud computing, mobile Internet.

Yu Shaofeng, born in 1995, graduated with a bachelor degree in software engineering. He started working in informatization since 2018, mainly focusing on power enterprise informatization, cloud computing, mobile Internet, etc.

Liao Chongyang, born in 1993, has gained master degree of computer science. He started working in informatization since 2017, mainly focus on informatization of the power indstry and enterprise digital transformation.

Ma Yining was born in 1991. She has gained master degree of computer application. He started working in informatization since 2016, mainly focusing on power enterprise informatization.
Journal of Web Engineering, Vol. 20_5, 1659–1674.
doi: 10.13052/jwe1540-9589.20515
© 2021 River Publishers