A Study on Hybrid Hierarchical Network Representation Learning
Yongxiang Hu
Huanggang Normal University, Hubei, 438000, China
E-mail: hbsandy1314@163.com
Received 16 June 2021; Accepted 18 July 2021; Publication 14 October 2021
Abstract
Network representation learning (NRL) aims to convert nodes of a network into vector forms in Euclidean space. The information of a network is needed to be preserved as much as possible when NRL converts nodes into vector representation. A hybrid approach proposed in this paper is a framework to improve other NRL methods by considering the structure of densely connected nodes (community-like structure). HARP [1] is to contract a network into a series of contracted networks and embed them from the high-level contracted network to the low-level one. The vector representation (or embedding) for a high-level contracted network is used to initialize the learning process of a low-level contracted graph hierarchically. In this method (Hybrid Approach), HARP is revised by using a well-designed initialization process on the most high-level contracted network to preserve more community-like structure information.
Keywords: Network representation learning, dimension reduction, graph contraction.
1 Introduction
Graphical data is widely used in various fields, such as social network, consumer-commodity network, protein structure network and so on. These information networks usually contain billions of nodes and edges. Due to the limitation of size in representing graphical data, large-scale information networks are difficult to analyze. Network representation learning (NRL) is aimed to represent a large-scale networks by low-dimensional vector representation. The vector representation contains rich information of a network that helps us to analyze large-scale networks efficiently. NRL includes two major goals. First one is to perform the technique of dimension reduction that focuses on efficiently reducing network information into low-dimension space. Second one is preserving information about a network as much as possible.
To preserve network information, current NRL methods [2, 3, 8] focus on maintaining the local relationship of nodes in the vector representation. For example, adjacency and neighbor similarity of two nodes are considered as important properties in a network and should be preserved in the NRL process. To measure the efficiency of preservation, the experimental results [2, 3] show that disadvantages by only considering the local connection of nodes like adjacency and neighbor similarity. To preserve more information of a network, besides considering the local connection of nodes, the community distance and skeleton of a network should also be examined to create vector representations in NRL.
HARP [1] uses hierarchical contraction technique to make the nodes of the high-level contracted network retaining the structure of densely connected nodes of a network. Thus, HARP improves other NRL methods by preserving more global information of a network [4]. But HARP does not use a mathematical based initialization method for embedding the high-level contracted network. The skeleton of the high-level contracted network is not preserved. Therefore, a well-designed initialization strategy is proposed for the high-level contracted network to consider more global information of a network. The vertices in a contracted network are called super nodes. Our initialization method aims to preserve the lengths of the shortest paths between super nodes in the high-level contracted network in vector representation. Thus, distances between super nodes and the skeleton of the high-level contracted network will be preserved in Hybrid approach we proposed. By considering distances between super nodes and the skeleton of the high-level contracted network, vector representation will create a more obvious cluster structure and have a clearer boundary between clusters. That helps classification algorithm to distinguish the nodes with different labels easily.
2 Problem Definition
2.1 Hierarchical Contracted Graphs
The contracted graphs are denoted as G where , L is the number of contracted graphs and G is the original network without contraction. Let Contract (G) denote the process of graph contraction that contracts G into by hybrid contraction. In each contraction, Star Collapsing (SC) is firstly used to shrink the nodes with second-order proximity and Edge Collapsing (EC) is next used to shrink the nodes with first-order proximity.
The hierarchical contracted graphs are generated by the process: where i is from 1 to L. A network is recursively contracted until the size of a contracted network is less than threshold . Lastly, these quence of contracted graphs is the hierarchical contracted graphs of a network G.
2.2 Hierarchical Network Representation Learning
Hierarchical Network Representation Learning (HNRL) aims to use an arbitrary NRL method on these contracted graphs. The chosen NRL method is denoted as EMBED () where G is the contracted networks and is the initial vector representation of G. The nodes in a contracted graph G will be converted into vector representation by the recursive process defined as Equation (1). If , random initialization is used for initializing the vector representation of GL then the chosen NRL method is applied to embed GL. If that the vector representation of is used as an initial vectors for learning vector representation of . Finally, the vector representation of a network is computed at the end of the HNRL process.
| (1) |
3 Hybrid Approach
3.1 Community-like Structure
Community is the sub-graph consisting of densely connected nodes in the network. Modularity, betweenness and average linkage are common measurements to evaluate intensity of connections inside a community. These measurements mostly focus on intra-connection in a community. It has the properties that more edges connect these gathering nodes, stronger a community is.
The high-level contracted graph also contains densely connected nodes, because the super nodes in the contracted graph are generated by a series of graph contraction processes. Since a super node and a community having the similar properties of node structure that is composed of densely connected nodes, a super node can be regarded as a community-like structure. When the contracting level of a contracted graph grows from 0 to L, the density of nodes and edges in the super node will increase because more nodes are shrunk together. Therefore, the super nodes of the most high-level contracted graph include highly intra-connected node structures. Thus, these super nodes preserve the community-like structures and the skeleton of the original network.
3.2 Analysis of Initialization
Most NRL methods usually use vector representation to construct the objective function for measuring proximity between nodes. These proximities are preserved in the vector representation when the objective function is optimized. Deepwalk and LINE are formulated to non-convex optimization problem which are solved by using stochastic gradient descent (SGD). The initialization of vector representation affects SGD to reach the global maximum. SGD might be stuck in local minima if the initialization is near at a saddle point or local minima. In other words, these NRL methods may not generate a proper vector representation for each node to preserve enough information of a network. To make SDG finding a better vector representation, HARP uses as an initial vector for embedding to prevent Deepwalk and LINE sticking in local maxima and reaching the global maximum as close as possible.
But for the most high-level contracted network , HARP uses random initialization for embedding unlike using to embed the other contracted network G. Thus, HARP may not reach the global maximum as close as possible in embedding G. A well-designed initialization approach of embedding G is proposed to help HARP generating a proper vector representation for G. This approach also preserves more community information of a network and has more interpretability than random initialization used in Deepwalk and LINE.
4 Community Distance Preserving
4.1 Shortest Path between Super Nodes
The distance between two nodes in a graph is usually measured by the length of the shortest path between these two nodes. A super node in the most high-level contracted network can be regarded as a community-like structure that includes one or more communities. So all pairs shortest paths of all super nodes in G are computed at first. By preserving lengths of shortest path between all super nodes in G, the relative positions between all communities like structures in the original graph are preserved. Moreover, the relative positions of super nodes are linear combination of all distances between the other super nodes [6]. That is to say the coordinate of a super node vector is a linear combination of the other super node vector of a network in Cartesian coordinate system. Thus, relative positions and skeleton of a network are preserved by the distances between each pair of super nodes [7, 9].
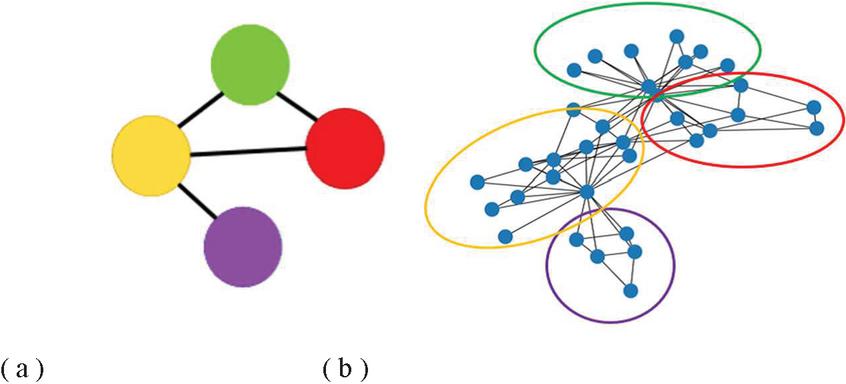
Figure 1 Related positions between communities.
As example is given in Figure 1, (b) is an uncontracted network (G) with four communities and (a) is the most highly contracted network (G). In (b) three groups at top connect to each other and the group marked with purple circle only connects to the yellow one. In (a) three super nodes at top connect to each other and the bottom one just connects to the node marked with yellow. The structure of super nodes in the contraction process from G to G is similar to the structure of groups in (b). In other words, the relative positions between different communities are preserved in G and G.
Let’s consider the case shown in Figure 2 that a super node contains more than one community. Suppose two communities C and C are shrunk into a super node V and a super node V’ only contains one community . The information of distance between and C denoted as ) is preserved in the distance between V and because is shrunk into . In the same way, the information of and ) is also preserved in the distance between V and V. Therefore, the relation of distances between one shrunk communities are preserved by the distance between the corresponding super nodes. That means in this case, C and C are still close and is still far from C and C.
So, if some super nodes contain more than one community, the relation of distances between communities is also preserved in the relation of super nodes [10]. Thus the relative positions of communities in a network are preserved in its most high-level contracted network (G). In conclusion, by considering the distances between all pairs of super nodes in G, the relative positions of all communities in a network will be preserved approximately.

Figure 2 Distances preserving, the curve line means path between two locations. Thicker line means a short path.
4.2 MDS for Dimension Reduction
Multidimensional Scaling (MDS) is applied to reduce the dimension of G in Hybrid approach. Inspired by Isomap, MDS is used to preserve the lengths of the shortest paths between super nodes in G. Firstly we construct a distance matrix D from all shortest paths in G. Each element D is the length of shortest path between super node i and j in G. Next B matrix which is used to calculate vector representation Z is computed by distance matrix. Finally the vector representation of G is computed by eigendecomposition of B with . The relative positions of all communities in a network are preserved.
4.3 Overall Framework
This framework adopts a mathematical based initialization to revise HARP in order to increase performance of HARP. This mathematical based initialization approach is called Isomap_G which is to revise Isomap by transforming continuous data type (like vector) to graphical data type (like network). The process of this framework contains three steps that are presented in the following paragraph and Figure 3.
First step is to adopt star and edge collapsing to hierarchically contract the network into a series of contracted graphs . Second step is to use Isomap_G to embed G. In Isomap_G, Dijkstra’s algorithm is used to compute all shortest paths between super nodes in G. After Dijkstra’s algorithm is performed, the distance matrix is constructed by the lengths of all shortest paths between all super nodes. In order to compute low-dimensional vector of G, an intermediary matrix B is computed by D. The details of calculating B are presented in Appendix I. Then Z is computed by eigendecomposition of B and equation . Third step is to adopt Z as the initialization for embedding G in HARP. The vector representation of each contracted graph will be learned by the chosen NRL method. This step is presented in the recursive form Equation (2).
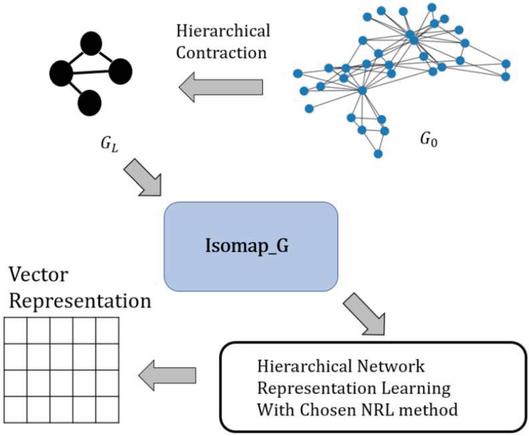
Figure 3 Framework of hybrid approach.
5 Experiments
In this section, several real-world networks in experiments will be introduced. Next, the baseline methods from the representation learning areintroduced to compare the performance of Hybrid Approach. Then, multi-label classification, visualization are applied to evaluate the effectiveness of Hybrid Approach. At last KNN classifier is used to measure the result of visualization objectively.
5.1 Multi-label Classification
Classification is aimed to classify the data with different labels. Multi-label is generated from each data which gives belonging probability corresponding to each label. The input data is the nodes in the network in our experiment. The goal is to classify the node with multi-label. Macro F1 is used to evaluate the accuracy of classification. This score is a value between 0 and 1 and the bigger the better. The one-vs-rest logistic regression classifier is applied to classify the nodes in a network. The classifier is trained and tested with a different ratio of label data from 1% to 9% respectively and generates 9 results for each baseline. Each training and test process uses 10-fold cross validation to ensure the reliability of our experiment.
5.2 Visualization
This task is aimed to visualize all the nodes in a network. It reduces the vector representation to 2-dimensional space and draws nodes with different colors corresponding to their label. A proper visualization is that nodes with the same label are clustered together and are separated from the groups with different labels. t-SNE is chosen as a visualization method. In our experiment, two vector representations of DBLP generated from Deepwalk and HARP are as the input to t-SNE.
5.3 KNN on Visualization
The result of visualization is subjectively understood by each person. To give an objective interpretation, the KNN classifier is used to evaluate the result of visualization. Firstly, KNN considers the top k close neighbors of each node vector by computing Euclidean distance. Secondly, it counts the number of each label in neighbors to find the major label of neighbors. This label will be regarded as a prediction of the node vector.
If the node vectors with the same label are close (short Euclidean distance), the chance of these node vectors that are chosen into top k close neighbors will increase. If top k close neighbors of the chosen node vector contain more node vector with the same label, this label will be regarded as the label of the chosen node vector. Thus, the accuracy of classifying the chosen node vector will increase, if node vectors with the same label are gathered closely and are separated from the other node vector groups with different labels.
The k value in KNN in our experiment is set from 1 to 50 for considering different number of neighbors. If top k neighbors contain more neighbors with the same label as the chosen node vector, the accuracy of classifying the chosen node vector will increase. That means t-SNE succeeds to separate nodes vector with different labels. Thus the results of visualization are quantified by average accuracy of KNN classifier. If the average accuracy of classifying node vectors of visualization is high, that means the result of visualization is fine.
5.4 Results and Analysis
The classification results are shown from Figures 4 to 5. The left half of these figures is Deepwalk version and the right half is LINE 1st version. The horizontal and vertical axis of these figures means the percentage of used labels and Macro F1 score.
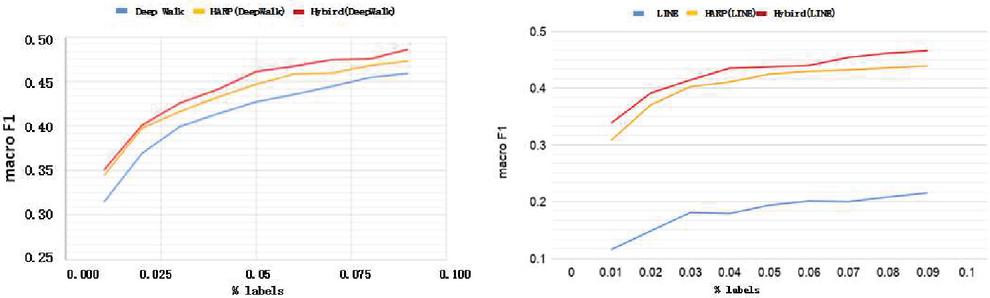
Figure 4 Citeseer.
In Figures 4 to 5, Macro F1 of both Deepwalk and LINE 1st are increased by HARP approach. Meanwhile Hybrid approach has more improvement than HARP. We can see the result of LINE 1st has signicantly improvement. Because Citeseer is a citation network that contains lots of second-order proximity, but LINE 1st only considers first-order proximity. Figures 5 and 4 both show that Deepwalk and LINE 1st are both improved by the HARP and Hybrid approach, but Hybrid approach has more improvement than HARP. LINE 1st has more improvement than Deepwalk, because DBLP is also a citation network that has the similar property (second-order proximity) with Citeseer.
Through the above experiments, the HNRL approach increase Macro F1 of classification by providing more global information. Hybrid approach further preserves the features of community distance and skeleton of a network to improve the performance of HARP.
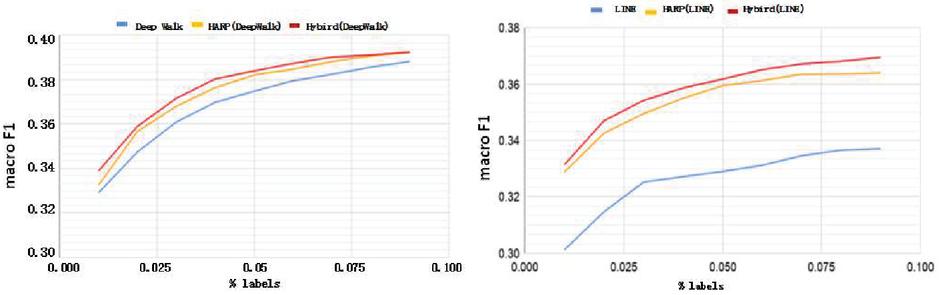
Figure 5 DBLP.
5.5 KNN on Visualization
In general, when the number of neighbors k increases, accuracy of KNN will decrease, because the top k neighbors will contain more neighbors with incorrect labels. The accuracy of Hybrid approach decreases slower than HARP when , because the top k neighbors contains more neighbors with correct labels. It shows that the node vectors with the same label are clustered closely and are separated from other node vector clusters using Hybrid approach. Thus it is clearly to identify each node cluster in the visualization of a network.
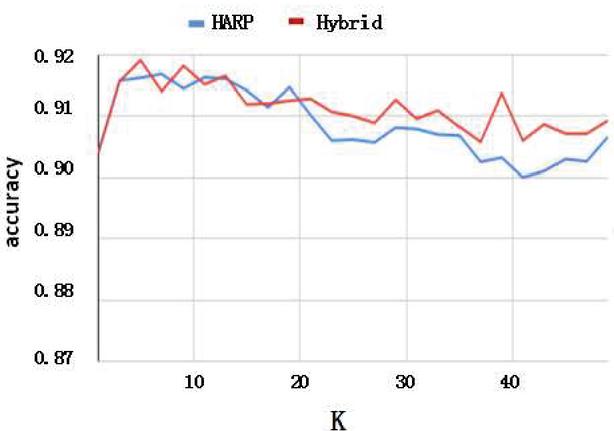
Figure 6 KNN on visualization.
6 Conclusion
In this paper, we proposed a hybrid approach combining HARP and Isomap G to increase performance of state-of-art NRL methods. Hybrid Approach preserves information of lengths of shortest paths between communities and skeleton of a network to revise the idea of HARP. In this way, performance of both classification and visualization are improved.
Two interesting research facts are found in this study. Firstly, because MDS uses Euclidean distance to measure the similarity of node vectors but Deepwalk and LINE both use cosine similarity, that may be the reason that the benefit of Isomap_G is not preserved from to . Secondly, Star and Edge Collapsing do not generate a more precise contraction of a network to preserve community information. In the future we will focus on solving the above two problems. The following is our future work. In the future we will focus on solving the above two problems. The following is our future work.
• Using cosine similarity to revise MDS for generating a better vector representation.
• The community detection algorithm will be introduced to contract a network by shrinking a community into a super node. Girvan-Newman algorithm [5] is considered to hierarchically cluster the nodes in a network and shrink it.
References
[1] Haochen Chen, Bryan Perozzi, Yifan Hu, and Steven Skiena. Harp: Hierarchical representation learning for networks. arXiv preprintarXiv:1706.07845, 2017.
[2] Aditya Grover and Jure Leskovec. node2vec: Scalable feature learning for networks. In Proceedings of the 22nd ACM SIGKDD international conference on Knowledge discovery and data mining, pages 855–864, 2016.
[3] Bryan Perozzi, Rami Al-Rfou, and Steven Skiena. Deepwalk: Online learning of social representations. In Proceedings of the 20th ACM SIGKDD international conference on Knowledge discovery and data mining, pages 701–710, 2014.
[4] Haochen Chen, Bryan Perozzi, Yifan Hu, and Steven Skiena. Harp: Hierarchical representation learning for networks. arXiv preprint arXiv:1706.07845, 2017.
[5] Michelle Girvan and Mark EJ Newman. Community structure in social and biological networks. Proceedings of the national academy of sciences, 99(12):7821–7826, 2002.
[6] Sam T Roweis and Lawrence K Saul. Nonlinear dimensionality reduction by locally linear embedding. Science, 290(5500):2323–2326, 2000.
[7] Fucheng Wan and Xiangzhen He, Chinese Shallow Semantic Parsing Based on Multi-method of Machine Learning, Journal of Web Engineering, pages 685–706, 2020: Vol. 19.
[8] Jian Tang, Meng Qu, Mingzhe Wang, Ming Zhang, Jun Yan, and Qiaozhu Mei. Line: Large-scale information network embedding. In Proceedings of the 24th international conference on world wide web, pages 1067–1077, 2015.
[9] Annamaria Goy, Diego Magro, Alessandro Baldo, A Semantic Web Approach to Enable a Smart Route to Historical Archives, Journal of Web Engineering, 2019(18).
[10] Rong-En Fan, Kai-Wei Chang, Cho-Jui Hsieh, Xiang-Rui Wang, and Chih-Jen Lin. Liblinear: A library for large linear classification. Journal of machine learning research, 9(Aug):1871–1874, 2008.
[11] Michelle Girvan and Mark EJ Newman. Community structure in social and biological networks. Proceedings of the national academy of sciences, 99(12):7821–7826, 2002.
Biography

Yongxiang Hu is a Associate researcher of the Huanggang Normal University, Hubei, China. He received the B.S. and M.S. degrees in computer Engineering System from Huazhong University of Science and Technology, Hubei, China, in 2001 and 2008, His research focuses on information security, Network architecture and network security technology.
Journal of Web Engineering, Vol. 20_6, 1923–1934.
doi: 10.13052/jwe1540-9589.20611
© 2021 River Publishers