On Modelling for Bias-Aware Sentiment Analysis and Its Impact in Twitter
Ahsan Mahmood1, Hikmat Ullah Khan2,* and Muhammad Ramzan3
1Department of Computer Science, COMSATS University Islamabad, Attock Campus, Pakistan
2Department of Computer Science COMSATS University Islamabad, Wah Campus, Pakistan
3Department of Computer Science and IT, University of Sargodha, Sargodha, Pakistan
E-mail: ahsan_mahmood_awan@yahoo.com; Hikmat.Ullah@ciitwah.edu.pk; mramzansf@gmail.com
*Corresponding Author
Received 10 October 2018; Accepted 04 February 2020; Publication 05 March 2020
Abstract
Sentiment Analysis (SA) is an active research area for the last ten years. SA is the computational treatment of opinions, sentiments, and subjectivity of text. Twitter is one of the most widely used micro-blog and considered as an important source for computation of sentiment and of data analysis. Therefore, companies all over the world analyze Twitter data using SA and extract knowledge which has potential applications in diverse areas. Although SA is the successful way of finding the people's opinion, the bias in the tweets affects the results of the SA and reflects inaccurate analysis that may mislead users to take erroneous decisions. The biased tweets are shared by valid, but biased human users as well as the social bots to propagate the biased opinions on certain topics. To counter this, this research study proposes a statistical model to identify such users and social bots who share the biased content in the form of tweets in the Twitter social media. For experiment purpose, we use annotated twitter dataset and argue the results of SA with and without the biased tweets and explored the effects of biased users at micro-level and macro level. The empirical results show that the proposed approach is effective and properly identifies the biased users and bots from other authentic users using sentiment analysis.
keywords:Social media, Twitter, sentiment analysis, bias, data mining, opinion mining
1 Introduction
Social media technology lets the users create and exchange their contents with one another. According to Khan HU [1], around 65% of adult users use social media sites to communicate and interact with others. These social media sites allow the users to share different sort of media with the other users. New content is constantly published on social media platform including private messages, personal opinions, facts, etc. [2]. As social media has changed our lives and the way we interact with others [3], analyzing social media sites for data mining and knowledge extraction tasks has become a trend for organizations as they carry out different tasks and gain knowledge about social media users [4]. Among the other social media sites, Twitter has become one of the most important social media sites as, in 2015, it had more than 200 million monthly active users worldwide [5] while the current statistics share that this count has reached to 336 million.1 A message sent using Twitter is called ``tweet''. The limit of a tweet was 140 characters until November 2017 when twitter doubled the limit of tweets characters. Twitter is used by individuals, companies, government officials, media networks, and many other users. As a result, textual data of a person's opinion related to diverse topics is available on the Twitter.
Due to the importance of twitter, many companies, government agencies, and organizations perform the analysis of tweets to generate the patterns and gain more knowledge about Twitter users in a particular area of interest [4]. Among other data analysis tasks from twitter, Sentiment Analysis (SA) is one of the mostly focused research area because Twitter data acts as a good corpus for SA and opinion mining [6]. Many companies provide twitter SA services to the users because many companies are seeking to mine the knowledge from twitter for their gains [7]. Despite that many researchers focus on SA in different fields to mine the knowledge from tweets, we believe the results of SA are somehow affected by the biased tweets from the users. Although bias tweets are discussed by some researchers, there is no research study solely focused on removing biased opinions from SA based research studies. Tweets became biased either by the people or social bots who are increasingly fluctuating on the social media platforms. To some extent, news sharing on twitter is biased as users intends to share diverse behavior and give their opinion on the shared news [8]. Moreover, the mentioning of other users in a tweet and re-tweeting are two common patterns of bias towards a particular topic [9]. LU H et al. [10], proposed a system for topic based biased detection of textual data from tweets. The authors classified the Twitter users based on their biased messages and compared them with the un-biased or fair messages. Miwa K et al. [11] proposed a mechanism to identify the behavioral biases of the investors on the dual moving average crossovers in the domain of stock prediction. Although twitter users are common source of bias in the tweets, social network are highly infiltrated by bots that can exploit other users' data and can affect millions of users [12]. While social media bots spread content in the social media can change the context of any scenario [13], many researcher shows that the impact of bots accounts on twitter is considerable and the bots behave differently and can change the course of an analysis [14]. Researchers have also worked in identification of twitter bots that spread different kinds of propaganda on social media platform for different purposes [15]. Other than bots and biased users, Twitter spam reach far beyond the social media platform to impact the real world because the number of spammers are increasingly at a very rapid rate on Twitter [16]. spam tweets usually contains deceptive information about different sort of advertisements and effect as a huge amount of tweets as recent research suggest that generally 6% of tweets consist of spam posts [17]. As a result, due to biased users, spammers, and social bots, gathering research data that is not biased is a challenging task for researchers because biased data, due to biased users and dedicated bots, changes the whole course of analysis on social media platforms [18]. As a result, this field has become more interesting yet challenging for the researchers because there is no formal study focused on identifying biased Twitter users.
If a user opinions are biased his/her tweets always yields positivity or negativity in most of their sharing. Moreover, if a user's or a bot's sentiment is always highly positive or negative above a certain a certain threshold that represents that those users are biased. As a result, when tweets are analyzed for sentiment analysis these biased users and their tweets effect the results of the overall analysis. Therefore, in order to remove such bias from normal or fair opinion mining, we identify those biased users and compute the results of the SA without their tweets.
In this paper, we investigate about the biased users and their effects on twitter and how they can change the overall results of sentiment analysis. We discuss regarding the higher valence of positive as well as negative sentiment expressed by the twitter users and then compare the results with and without the biased tweets. In order to identify biased users, we propose a statistical model that measure the bias in user's tweets and exclude the biased users from the overall results of SA. We carry out comprehensive empirical analysis with different bias thresholds and find the results of all the thresholds.
The remainder of this paper is organized as follows. Section 2 discusses SA applications related to twitter. Section 3 explains the statistical approach to measure the bias of the user's tweets Section 4 discusses the findings of the paper before concluding the paper.
2 Applications of Sentiment Analysis
In this section, we discuss different applications of twitter SA. Although SA applications are very vast [19], our focus is on the SA applications that have been proposed using twitter datasets. We also discuss the uses and importance of these application areas and their effect on companies and other stakeholders. Due to the importance of twitter SA, if we propose a method to remove bias tweets from twitter, it can help in better assessment of SA. The importance of these applications demonstrates that even a slight change in SA results leads towards a wrong decision or analysis so excluding biased users from such SA analysis makes sure that SA results can be more accurate.
2.1 Prediction about Future
Predicting future about different topics is one of the key applications of SA. Researchers used the users' opinion to analyze and predict the future about different topics. A model is proposed that predict the future about different topics through the help of twitter SA. The model use user's opinions about different topics to predict future about those topics [20]. Tweets can be used to predict the citation of an article after the article is published [21]. Pestilences can also be predicted by using tweets as researchers predicted Swine flu on the basis of people discussions on the topic [22]. SA is also used by the researchers to predict crime indications. The researchers used their model to predict the crimes in the big cities through the help of SA along with the weather data [23].
2.2 Politics
Politics is one of the most important topic of research in the field of opinion mining. Twitter is one of the social media platforms where politics is regularly discussed among users. This way studying twitter data allow to gain knowledge about people perception about political topics. Future based political prediction about political alignment and election results have also become a trend in modern day politics. Political alignment of the twitter users is predicted by using a machine learning model [24] while the relation between sentiments and future election was also discussed by researchers [25]. Moreover, Researchers investigate the use of twitter during the election period and their behavior towards influential users [24]. The researchers help the politicians find the influential users through the help of SA [26]. Regarding election prediction, initially, the researchers raises the question whether the social media sentiments can predict the election or not. Later, many researchers discussed how elections can be predicted using twitter SA. According to them, the political sentiments demonstrate the position of parties while the election are approaching and this research method can be used to predict the elections [27]. As a result, if public monitoring is used in election campaigns than elections can be predicted by using twitter [28]. Researchers also explores the tweets data through SA about the U.S election and calculate the results through different perspective and analyzed public opinion about candidates [29]. Recent studies show Social bots changed the people perception about candidates in the US presidential election of 2016 [30].
2.3 Business
Many researchers focus the field of business in SA. They use SA to analyze the customers' reviews, market trends, public opinions, etc. to improve the customer satisfaction, company sales, product features, etc. As a result, the companies make timely and accurate decisions about their products and gain market confidence. A case study was performed using text mining and SA of Facebook data. The author extracts the value of the business by using social media data and recommended different tasks to the companies to improve their analysis study [31]. Mittal et al. [32], performed SA using machine learning approach to correlate public sentiments with market sentiments and proposed a management policy on the basis of predicted results. Smartphones were used as a product domain to discover the sentiment of people towards the different features of product. The research helps smartphone companies to make decision in the features in which users are highly interested [33]. Public tweets were used to identify and classify the sentiment about mobile phones and other products [31, 35]. Customers' sentiments were examined about different companies to examine the people sentiment about those companies [36, 37]. Researchers also investigate that mobile phone app ratings on the app-store are not enough to give feedbacks to the users so they proposed a framework for SA of the apps review so the developers can easily understand the generalized feedbacks of the users about the app [38]. Using the sentiments of words, a system was proposed to measure the consumer's satisfaction in mobile services, mobile service was given a rating based on the SA of the users [39].
2.4 Stock Market
Analysis and prediction of stock market prices and its fluctuations is one of the most challenging tasks in data mining due to the sparsity of the field. Many researchers worked in this area to analyze the stock market through different ways although twitter SA makes this task even more interesting. SA can help in stock prediction through the help of topics from twitter data as experiment shows this approach is feasible and perform effectively [40]. Rao T et al discusses the relation between tweets and financial market and analyzed the stock market changes around the people discussion and their sentiment about stock market [41]. Positivity and negativity in people mood predicts the upcoming changes in the stock market. A model proposed in this manner achieved around 87% correct predictions related the changes in the stock market [42]. A company can change the stock pricing using the positivity or negativity of people sentiment about their stocks [43]. Tweets related to 30 companies were analyzed for SA to predict the stock pricing of those companies. The result shows that the stock closing price can be predicted as accurate as 77% for some companies [44]. Stock market behavior was examined by performing SA of investors tweets. According to the author, stock returns can be explained by the sentiments of investors [45]. Researchers investigate the impact of financial news on stock prices. They conducted different experiments on many stock markets using past data [46].
2.5 Movies
When people watch a movie, they discuss it on social media platforms. If analyzed correctly, people reviews about movies can really make a change in movies industry. Twitter data have been used to extract the people sentiment about movie reviews. User's sentiment about Hollywood movies were analyzed by researchers so customer's preferences can be understood by the concern authorities [47]. In another work, the researchers classify the movies into 2 categories according to the people sentiment about that movie [48]. Thet TT et al proposed a method to perform SA on movie reviews. They identify the positive and negative aspects of the movies through the help of SA [49]. Twitter SA was used to analyze the people opinion about movies. The authors give sentiment about each movie in different categories [49].
3 Problem Statement and the Proposed Statistical Model
In order to identify the users who, share biased tweets as exposed after sentiment analysis, a simple statistical model is proposed. The model aims to find the users with biased tweets and calculate the result of sentiments with and without their tweets in a given dataset.
3.1 Problem Formulation
In this section, some important preliminary parameters are defined along with the major characteristics of the problem. The problem is stated in a formal way and the major issues are identified.
Let us begin by introducing is a set of tweets and as the set of all the users who have contributed to the creation of items of . Note that each tweet has exactly one sentiment denoted by so this way is a set containing all tweets sentiment values. The value of the sentiment of a tweet is either 0 (negative), 2 (neutral) or 4 (positive). In the dataset, each user has one or more than one tweet . Based on this analysis, we identify a subset which contains tweets that belong to users and that contains tweets related to all of the users. As each tweet belongs to exactly one user, . In order to compute the overall sentiments of a particular user , we use Arithmetic Mean (AM). In order to compute the sentiment results of a user the AM can be given as shown in Equation (1).
| (1) |
The arithmetic mean of a user's tweets shows the overall result of his/her sentiment and can be used as a baseline to find the biased opinion. A similar approach may be applied to calculate the sentiment results of the whole data set. Therefore, the sentiment results the whole dataset can be computed by using the equation as shown in Equation (2).
| (2) |
The results of sentiment analysis computed by using Equation (2) are affected by tweets from biased users, social bots and spammers. As a result, the sentiment analysis is highly affected due to those tweets. In order to solve the issue, a model is proposed that compute the bias in users' opinion and identify the biased users among the others in a Twitter dataset.
3.2 The Problem Model for Finding Biased Users
In order to detect the biased opinions in the users' tweets, the minimum threshold of bias is set to be 90%. This resembles that if 90% of a user's tweets have similar sentiments then the user is said to be a biased user. After identifying all the biased users, the results of such users' sentiments will be removed from the overall average sentiment represented as . In order to find the biased users, a simple solution is proposed in this way: Let us suppose M is the mode of , n is the frequency of the mode in , and N is the number of elements in then biased n of a user's tweets can be given as shown in Equation (3):
| (3) |
If the value of then the user tweets are said to be biased. The value 0.9 resembles that 90% of a user's tweets have similar opinions. As a result, the model creates a new subset that contains the tweets of the all the users except those whose . So the proposed model identifies two sorts of bias, i.e., negative bias and positive bias. The equation used to compute the overall sentiments of the tweets can be given as shown in Equation (4).
| (4) |
The value of is calculated by using different threshold values of from 0.9 to 1.0. Another important factor in bias calculation is to measure which topics are affected by the biased users. This can be identified by analyzing the tweets of biased users. In order to analyze the tweets of biased users, the tweets of biased users are tokenized and frequency of each word appear in those tweets is calculated that yields another set is a set containing words from biased user's tweets. If a word is denoted by , then the tweet containing word is denoted by . As a result, all the tweets containing the word is denoted by and the sentiment of all such tweets can be computed as shown in Equation (5).
| (5) |
After removing the tweets of the biased users from , a new subset of tweets is created called subset that contains all the tweets that contains the word except those from biased users. So the sentiment score of the subset is computed by the formula as shown in the Equation (6).
| (6) |
Equation (2) calculates the results of overall sentiments including biased results, whereas Equation (4) computes the results of overall sentiments without biased results. Equation (5) computes the result of the sentiments of tweets that contains the word while Equation (6) computes the sentiments of tweets that contains the word without the tweets of biased users. In Table 1 presents the list and description of the symbols used in this paper.
Table 1 List and description of symbols used in the paper
| Symbol | Summary |
|---|---|
| The set containing all tweets | |
| The set containing all users | |
| The set containing all words present in the tweets | |
| The set containing all the sentiments of tweets | |
| An arbitrary tweet | |
| Sentiment of tweet | |
| An arbitrary user | |
| An arbitrary word | |
| The tweets belong to | |
| The tweets belong to all users | |
| The tweets containing | |
| The sentiments of tweets belong to all users | |
| Sentiments of all tweets belongs to | |
| Arithmetic mean of | |
| Arithmetic mean of | |
| The Arithmetic mean of | |
| Bias of | |
| The set containing unbiased sentiments of tweets | |
| The sentiments of tweets belong to unbiased users | |
| The Arithmetic mean of | |
| The Arithmetic mean of |
4 Results and Discussions
Twitter data set, used in this paper, is freely available for research purpose.2 The dataset contains 1.6 million tweets which are annotated with sentiment values (0 for negative 2 for neutral and 4 for positive). In order to identify the relationship between the users and tweets, the functional relationship is analyzed through power regression model. IF T denotes tweets and U denotes users then power regression is given as shown in Equation (7), when taken natural log, the resultant equation is shown in Equation (8) and if ε is the error term, then linear regression model, can be written as shown in Equation (9).
| (7) |
Table 2 Statistics of power regression analysis
| Regression Statistics | |
|---|---|
| Multiple R | 0.979 |
| R Square | 0.958 |
| Adjusted R Square | 0.958 |
| Standard Error | 0.197 |
| Observations | 177 |
Table 3 Statistics between 2 regression variables
| Lower | Upper | Lower | Upper | ||||
|---|---|---|---|---|---|---|---|
| Coefficients | S.E | t Stat | P-value | 95% | 95% | 95.0% | 95.0% |
| 5.25 | 0.02 | 248.37 | 0.00 | 5.20 | 5.29 | 5.20 | 5.29 |
| −0.36 | 0.01 | −63.76 | 0.00 | −0.38 | −0.35 | −0.38 | −0.35 |
| (8) |
| (9) |
The model shown in Equation (8) is the log-log regression model so now if Equation (8) holds, then the value of y will be computed as shown in Equation (10).
| (10) |
After calculating the relation between and through the help of regression analysis, the output results are shown in Table 2.
The power law results show that the model is a good fit. Table 3 shows the relationship between the 2 regression variables, Tweets and Users.
The relation between and is given as, . Now in order to calculate the value when apply e to both sides of equation the result can be given as shown in the Equation (11).
| (11) |
Figure 1 shows the log-log analysis between the user's tweets. The chart shows that there is a strong relationship between the users and the number of posts. It shows that a huge amount of users has few tweets while few users have a high number of tweets.
After extraction of users and their tweets, two types of analysis are performed on the dataset. In the first part, micro-level analysis is performed with the users with 50 to 150 tweets are analyzed for bias and the results are computed only among those users. In the second part, macro-level analysis is performed and SA results are computed on the whole dataset of 1.6 million tweets and biased users are identified among the users with 30 and more tweets.
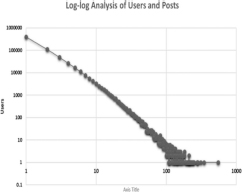
Figure 1 Log-log analysis between users and posts.
4.1 Micro-level Analysis
During first analysis, the system is able to extract 825 users. This analysis reveals the importance of bias and is carried out to show the effects of bias in small datasets. The tweets of these users are equally distributed among 50–150 posts as shown in Figure 2.
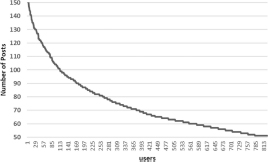
Figure 2 Number of users with 50–150 posts in the dataset.
For the micro-level analysis, During the first part, as the number of users with 50–150 tweets are 825, the analysis of bias identification based upon these 825 users. The number of tweets shared by such users is 61,487. Figure 3 shows the graphical representation of of users with different numbers of tweets. Tweets are spread across the graph that resembles that users with different values of sentiments are present in the dataset. However, there are many points on the edge of graph, i.e., many users with either SA results near 4 or 0. This resembles that the number of biased users in the data is quite huge. Another thing to note here is that the number of positive sentiments looks on the higher side of the graph the reveal that the sentiments are highly positive. Regarding biased users, one point to remember here is that these biased users can be social bots, spammers or general biased users who are negatively or positively biased. According to our assumptions, the users with 100% biased opinions are social bots that are propagating their agenda on the social media.
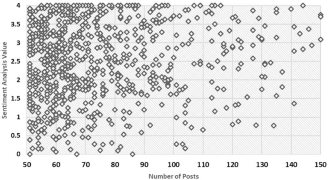
Figure 3 Graphical representation of SA of the users.
The distribution of user sentiment values in terms of is shown in Figure 4. There are many users in the dataset with sentimental value equal to four. These users the most biased users in the selected data. Moreover, there are more users with positive sentiments that resembles that the results of are highly positive.
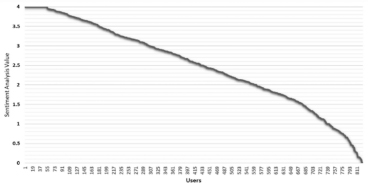
Figure 4 Distribution of SA results in different groups.
After the model calculates the overall , the resultant value is 2.541. This shows that the user opinions in the dataset are on the positive side because the value of 2.54 clearly resembles that peoples' opinions are generally positive. On the other hand, when we move towards another perspective of our analysis where the model calculates the with different levels of threshold so that we can analyze how the results are varying. Figure 3 reveals that majority of the users' comments are on the positive side, thus there are many users with positive biased comments. There are as many as 57 users with 100% biased comments. That makes the analysis quite interesting because having 57 users from 825 users with 100% bias is very high. Therefore, in order to have a deep insight, the proposed model calculates the results of with different level of threshold criteria. The results of these calculations are shown in Table 4.
Table 4 SA results with different bias threshold
| % | Number of Users | Excluded Users | |
|---|---|---|---|
| None | 2.54 | 825 | 0 |
| 0.99 | 2.26 | 768 | 57 |
| 0.98 | 2.19 | 751 | 74 |
| 0.97 | 2.14 | 740 | 85 |
| 0.96 | 2.07 | 716 | 109 |
| 0.95 | 2.02 | 707 | 118 |
| 0.94 | 1.99 | 699 | 126 |
| 0.93 | 1.92 | 681 | 144 |
| 0.92 | 1.87 | 668 | 157 |
| 0.91 | 1.80 | 653 | 172 |
| 0.90 | 1.75 | 638 | 187 |
The result of is 2.541, while after applying different threshold values of the value of overall sentiment changes dramatically in the data. With the value of set to 0.99, the value of average sentiment becomes 2.26. This value changes from 2.26 to 1.75 with the threshold value of 0.90. Among the other biased users, the most important biased users are the one who have 100% similar sentiments as these are the most effective user and have the highest impact upon the sentiment analysis result. Figure 4 shows the identified biased users in the data.

Figure 5 Biased users in the dataset among users with 50–150 tweets.
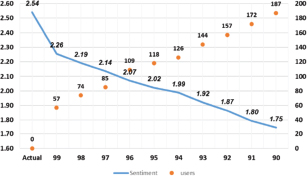
Figure 6 Biased users' distribution among users with 50–150 tweets.
In order to know the biased users better, Figure 6 shows the complete distribution of frequency of biased users. According to the results, there are 57 users with 100% bias, whereas the value become 2.26 that shows that the impact of the users with 100% bias is the highest among the other biased users. When value set to 0.99 the model exclude 74 users and result become 2.19. Similarly, as the threshold decreases, the value of sentiment also decreases that shows that most of the biased users positively biased. The model moves on to put the criteria of as 0.97 and value of becomes 2.14 and identify 85 biased users. This shows that the results of sentiments are changing slowly as the threshold decreases due to the highest impact of the users with more biased tweets than others. When the value of is set to 0.9 the value of become 1.75. The graph shows that the impact of the users with low bias is much less than the users with high bias.
The changes in sentiment values from 2.54 to 1.75 doesn't only showing the change in sentiment values, but it means that there is even a bigger difference in terms of the meaning of the sentiment results. Originally, the sentiment value is supposed to be on the higher positive side, but now sentiments are said to be on the negative side. The biased users in the data are shown in Figure 7. Interestingly, although the data contain many positively biased users, there are some users that are negatively biased who mostly express negative opinions in tweets.
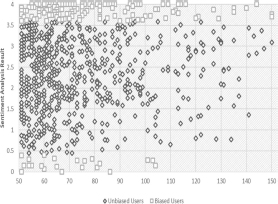
Figure 7 Biased vs unbiased users in the dataset.
4.2 Macro-level Analysis
In the second part of the analysis, the complete dataset is used for the analysis. During this part, the users with a minimum of 30 tweets are analyzed for bias because thirty tweets are enough to resemble the bias in the user's tweets. This part is further divided into four tiers in which T1 shows the tier of users with 50–150 tweets, T2 shows the tier of users with 50–549 tweets, T3 shows the tier of users with 40–549 tweets and T4 shows the tier of users with 30–549 tweets. As a result, bias is analyzed by taking the users with different number of tweets so the impact can be determined more explicitly. Table 5 shows the results of different tiers and bias criteria levels. When the value of is calculated for the complete dataset of 1.6 million tweets the value is 1.998.
Table 5 Sentiment analysis results over the whole data set with different tiers
| Bias Criteria | Sentiment Analysis Result | No of Users Excluded | No of Posts Excluded | |||||||||
|---|---|---|---|---|---|---|---|---|---|---|---|---|
| T1 | T2 | T3 | T4 | T1 | T2 | T3 | T4 | T1 | T2 | T3 | T4 | |
| None | 1.998 | 1.998 | 1.998 | 1.998 | 0 | 0 | 0 | 0 | 0 | 0 | 0 | 0 |
| 99 | 1.986 | 1.985 | 1.982 | 1.976 | 57 | 62 | 104 | 171 | 17692 | 19568 | 25432 | 33792 |
| 98 | 1.984 | 1.983 | 1.979 | 1.974 | 74 | 79 | 121 | 188 | 21692 | 23568 | 29432 | 37908 |
| 97 | 1.982 | 1.980 | 1.974 | 1.967 | 85 | 92 | 154 | 242 | 25324 | 28572 | 37124 | 48272 |
| 96 | 1.979 | 1.977 | 1.971 | 1.963 | 109 | 117 | 180 | 289 | 29412 | 33504 | 42056 | 55420 |
| 95 | 1.977 | 1.974 | 1.968 | 1.959 | 118 | 127 | 205 | 314 | 32336 | 37436 | 47688 | 61168 |
| 94 | 1.976 | 1.973 | 1.966 | 1.956 | 126 | 135 | 215 | 343 | 34484 | 39584 | 50440 | 66228 |
| 93 | 1.973 | 1.970 | 1.962 | 1.951 | 144 | 153 | 244 | 401 | 38968 | 44068 | 56192 | 74832 |
| 92 | 1.971 | 1.968 | 1.959 | 1.947 | 157 | 167 | 269 | 434 | 42408 | 48100 | 61184 | 80924 |
| 91 | 1.969 | 1.964 | 1.955 | 1.942 | 172 | 185 | 291 | 473 | 46752 | 54384 | 68036 | 89492 |
| 90 | 1.967 | 1.962 | 1.953 | 1.938 | 187 | 200 | 314 | 528 | 49652 | 57284 | 71276 | 94676 |
Although the dataset contains tweets of different topics, the analysis is performed on the complete dataset to reveal the difference in sentiment results. Therefore, even a small amount of change in the result of sentiments means that the difference on the lower level, for instance, topic level will be quite huge. Moreover, the overall results reveal the general amount of biased users and tweets in a twitter dataset and their impact on the overall sentiment results. Although T1 contains a small number of group, i.e., 50–150, the results show that the impact of this group is quite clear as with bias threshold set to 90%, the value of is 1.96. In T1, the number of omitted users is 187 and the number of excluded posts from final results are 49652. This shows that the impact of these users is very high because as shown in Table 5, these are the important users in the dataset. Furthermore, as the highest frequency of tweets by a user is 549, T2 is comprised of users with 50–549 tweets and when analyzed at a bias threshold of 90%, the value of become 1.962. As the actual value of is 1.998, when the value of is calculated with bias threshold of 0.9 i.e., 90% for T4 i.e., users with 30 to 549 tweets, the result is 1.942. This shows that the results are clearly changing when tweets from biased users are excluded from the dataset. This tier shows that the value of is changed from 1.998 to 1.964 with only 200 users excluded from the final results. When the tweets of these users are analyzed, these users are either social bots that are advertising particular brands as all of their tweets are about particular websites or brands that they are advertising or there are users with extreme levels of bias in their posts like we extract a user who has 549 posts and all of their posts are negative. For instance, the analysis from T1 and T2 are enough to support the assumptions, further experiments are carried out for T3 and T4 to analyze the impact for those users. During these analyses, although the number of identified users in the 90% threshold is 314 and 528, the impact of these users is less than the impact of the previously discussed users. Here one point to note is that this change in sentiment is from both types of biased users, i.e., positively biased users who always have positive opinions in their tweets and negatively biased users who always have negative opinions in their posts but still the results of is decreasing due to the high number of positively biased users. Although negatively and positively biased users are not separately analyzed in this paper, the model extract 434 positively biased and 95 negatively biased users in T4 with a bias threshold of 90%. This means, 80% users among the biased users are positively biased and 20% users are negatively biased. As a result, after calculating the value of at each level, the SA result is decreasing. This happens in this case, while the number of positively and negatively biased users can vary for different data sets. Moreover, the dataset used in this paper consist of data from numerous topics therefore it is not possible to see which users are impacting what kinds of topics. In case of a more specific dataset where dataset consists of tweets related to only one topic positivity and negativity towards a specific topic can be analyzed in a much better way.
For further analysis of the biased users and their impact on the sentiment analysis results, the frequency of words used by the biased users in tweets is calculated through the help of Equation (5). After calculating the frequency of each word, all the tweets are extracted that contains that the word . For each of the , value of and is calculated for different threshold values of bias. Although topic based bias is not discussed in this paper, the word based analysis helps in examining the overall sentiment of tweets on the basis of different topics or words and can help in investigating the overall impact of the biased users and their tweets about diverse topics. Figure 8 shows the change in sentiment analysis results for the words `followers', `everyone', `using', and `question'.
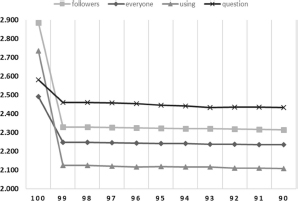
Figure 8 Changes in sentiment analysis results based on different words.

Figure 9 Changes in sentiment analysis results based on different words.
Some words are highly used by biased users, thus the change in sentimental value is quite high. In this example, the result tweets containing the word `followers' is 2.884 when computed with all the tweets. After removing the tweets from biased users, the value of sentiment at the threshold of 90% become 2.31. Similarly, different words are influenced differently, but the example shown in Figure 8 shows the words where the sentiment value changes a little bit. Likewise, Figure 9 shows another example of the keywords `relieve', `limit', `train', `pay', `longest', and `poem'. In this particular case, the sentiment values of different words have a higher impact of bias as the sentimental value of the word `relieve' changes from 3.64 to a very low value of 2.15. The figure also shows the change in sentiment values of other words. Like the sentiment score of word `poem' changes from 3.2 to 2.6. As the foremost focus in this paper is towards identifying biased users instead of topic based bias, therefore, the analysis of the words is more focused on change in the sentiment value than the subjective analysis. Moreover, as the dataset contains tweets about different topics, topic based bias can't be focused in this particular data set.
Table 6 shows randomly selected 20 different words and the change in their sentiment results with different threshold values of bias. One point to note here is that all these results are shown on the basis of T4 i.e., users with 30 to 549 analyzed for bias and results are generated from the whole data set.
Table 6 Changes in sentiment analysis results for 20 randomly selected words
| Word | B100 | B99 | B98 | B97 | B96 | B95 | B94 | B93 | B92 | B91 | B90 | Diff |
|---|---|---|---|---|---|---|---|---|---|---|---|---|
| relieve | 3.640 | 2.154 | 2.154 | 2.154 | 2.154 | 2.154 | 2.154 | 2.154 | 2.154 | 2.154 | 2.154 | 1.486 |
| limit | 2.509 | 1.438 | 1.438 | 1.430 | 1.423 | 1.423 | 1.423 | 1.423 | 1.423 | 1.415 | 1.415 | 1.094 |
| train | 2.623 | 1.625 | 1.625 | 1.622 | 1.620 | 1.620 | 1.618 | 1.617 | 1.615 | 1.615 | 1.615 | 1.009 |
| pay | 2.518 | 1.696 | 1.696 | 1.694 | 1.689 | 1.688 | 1.688 | 1.688 | 1.685 | 1.685 | 1.682 | 0.837 |
| longest | 2.065 | 1.358 | 1.358 | 1.358 | 1.358 | 1.358 | 1.358 | 1.358 | 1.358 | 1.358 | 1.358 | 0.706 |
| included | 3.131 | 2.453 | 2.453 | 2.453 | 2.443 | 2.443 | 2.443 | 2.459 | 2.449 | 2.428 | 2.428 | 0.703 |
| poem | 3.294 | 2.612 | 2.612 | 2.600 | 2.600 | 2.600 | 2.600 | 2.610 | 2.610 | 2.610 | 2.610 | 0.684 |
| using | 2.736 | 2.124 | 2.124 | 2.122 | 2.118 | 2.119 | 2.118 | 2.116 | 2.112 | 2.111 | 2.109 | 0.626 |
| followers | 2.884 | 2.330 | 2.329 | 2.328 | 2.325 | 2.323 | 2.322 | 2.321 | 2.319 | 2.317 | 2.314 | 0.570 |
| money | 1.475 | 1.472 | 1.472 | 1.420 | 1.417 | 1.417 | 1.417 | 1.416 | 1.415 | 1.415 | 1.413 | 0.062 |
| typical | 2.116 | 2.094 | 2.094 | 2.086 | 2.079 | 2.071 | 2.071 | 2.063 | 2.056 | 2.056 | 2.056 | 0.060 |
| thinking | 1.992 | 1.950 | 1.949 | 1.948 | 1.943 | 1.941 | 1.940 | 1.936 | 1.936 | 1.936 | 1.933 | 0.059 |
| accept | 1.616 | 1.610 | 1.610 | 1.608 | 1.596 | 1.590 | 1.590 | 1.584 | 1.577 | 1.571 | 1.558 | 0.058 |
| world | 2.399 | 2.352 | 2.352 | 2.351 | 2.348 | 2.348 | 2.346 | 2.345 | 2.344 | 2.343 | 2.342 | 0.057 |
| site | 2.160 | 2.116 | 2.116 | 2.116 | 2.115 | 2.111 | 2.111 | 2.109 | 2.108 | 2.107 | 2.105 | 0.055 |
| love | 2.956 | 2.953 | 2.952 | 2.950 | 2.948 | 2.947 | 2.945 | 2.945 | 2.945 | 2.944 | 2.944 | 0.012 |
The analysis shows that there exist many biased users on Twitter that can change the result of overall sentiment analysis of a particular data set. These biased users are present at different levels in the dataset among which the users with more tweets are the most important biased users and have much higher impact on the overall sentiment results. We analyze the bias of different levels of users with different angles and their impact on the sentiment analysis results. These biased users be extracted and omitted from the sentiment results by using the proposed method. A more specific dataset can have a higher impact of bias in the results of sentiments.
Conclusion
According to our findings, the spammers and social bots shape the sentiments of any dataset due to their excessive similar tweets which results in changing the overall sentiments of a particular dataset. These users can be easily identified and removed from any dataset before performing sentiment analysis. We identify the changes of bias in twitter and explained the reasons in detail. The results show that the biased users can change the course of any sentiment analysis and can have a very impact in the topic-based sentiment analysis. It also shows that the words used by biased users can help in further investigation of the impact of these biased users in the whole data set. Moreover, if we analyze the features of these biased users, we can identify the reasons of these biased tweets also it can help in distinguishing between the actual users and social bots among these biased users. In the future, we aim to use a topic specific dataset with more users and tweets so we can compute the sentiments and bias on the basis of topics. We also aim to extend our bias finding model to find the bias of the users with respect to each topic so their bias doesn't affect the sentiments of a particular topic.
___________
1 https://www.statista.com/statistics/282087/number-of-monthly-active-twitter-users/. Accessed May 2018.
2 https://www.kaggle.com/kazanova/sentiment140 retrieved on 01-04-2018
References
[1] H. U. Khan, “Mixed-sentiment Classification of Web Forum Posts Using Lexical and Non-lexical Features,” J Web Eng, vol. 16, no. 1-2, pp. 161-176, Mar. 2017.
[2] A. Pinto, H. G. Oliveira, A. Figueira, and A. O. Alves, “Predicting the Relevance of Social Media Posts Based on Linguistic Features and Journalistic Criteria,” New Gener. Comput., vol. 35, no. 4, pp. 451-472, Oct. 2017, doi: 10.1007/s00354-017-0015-1.
[3] E. Qualman, Socialnomics: How Social Media Transforms the Way We Live and Do Business. John Wiley & Sons, 2010.
[4] M. J. Culnan, P. J. McHugh, and J. I. Zubillaga, “How large US com-panies can use Twitter and other social media to gain business value,” MIS Q. Exec., vol. 9, no. 4, 2010.
[5] P. Barbera and G. Rivero, “Understanding the political representa- tiveness of Twitter users,” Soc. Sci. Comput. Rev., vol. 33, no. 6, pp. 712-729, 2015.
[6] A. Pak and P. Paroubek, “Twitter as a corpus for sentiment analysis and opinion mining,” in LREc, 2010, vol. 10.
[7] E. Kouloumpis, T. Wilson, and J. D. Moore, “Twitter sentiment analysis: The good the bad and the omg!,” Icwsm, vol. 11, no. 538-541, p. 164, 2011.
[8] J. S. Morgan, C. Lampe, and M. Z. Shafiq, “Is News Sharing on Twitter Ideologically Biased?,” in Proceedings of the 2013 Conference on Computer Supported Cooperative Work, New York, NY, USA, 2013, pp. 887-896, doi: 10.1145/2441776.2441877.
[9] S. Gonzalez-Bailon, N. Wang, A. Rivero, J. Borge-Holthoefer, and Y. Moreno, “Assessing the bias in communication networks sampled from twitter,” ArXiv Prepr. ArXiv12121684, 2012.
[10] H. Lu, J. Caverlee, and W. Niu, “BiasWatch: A Lightweight System for Discovering and Tracking Topic-Sensitive Opinion Bias in Social Media,” in Proceedings ofthe 24th ACM International on Conference on Information and Knowledge Management, New York, NY, USA, 2015, pp. 213-222, doi: 10.1145/2806416.2806573.
[11] K. Miwa and K. Ueda, “The influence of investor’s behavioral biases on the usefulness of the Dual Moving Average Crossovers,” New Gener. Comput., vol. 23, no. 1, pp. 67-75, Mar. 2005, doi: 10.1007/BF03037651.
[12] Y. Boshmaf, I. Muslukhov, K. Beznosov, and M. Ripeanu, “The social-bot network: when bots socialize for fame and money,” in Proceedings of the 27th Annual Computer Security Applications Conference, 2011, pp. 93-102.
[13] H. U. Khan and A. Daud, “Using Machine Learning Techniques for Subjectivity Analysis based on Lexical and Nonlexical Features,” Int. Arab J. Inf. Technol. IAJIT, vol. 14, no. 4, 2017.
[14] S. Haustein, T. D. Bowman, K. Holmberg, A. Tsou, C. R. Sugimoto, and V. Lariviere, “Tweets as impact indicators: Examining the implications of automated ‘bot’ accounts on Twitter,” J. Assoc. Inf. Sci. Technol., vol. 67, no. 1, pp. 232-238, Jan. 2016, doi: 10.1002/asi.23456.
[15] B. Mpnsted, P. Sapieyynski, E. Ferrara, and S. Lehmann, “Evidence of complex contagion of information in social media: An experiment using Twitter bots,” PLOS ONE, vol. 12, no. 9, p. e0184148, Sep. 2017, doi: 10.1371/journal.pone.0184148.
[16] S. Liu, Y. Wang, J. Zhang, C. Chen, and Y. Xiang, “Addressing the class imbalance problem in Twitter spam detection using ensemble learning,” Comput. Secur., vol. 69, pp. 35-49, Aug. 2017, doi: 10.1016/j.cose.2016.12.004.
[17] C. Chen et al., “Investigating the deceptive information in Twitter spam,” Future Gener. Comput. Syst., vol. 72, pp. 319-326, July 2017, doi: 10.1016/j.future.2016.05.036.
[18] F. Morstatter, H. Dani, J. Sampson, and H. Liu, “Can One Tamper with the Sample API?: Toward Neutralizing Bias from Spam and Bot Content,” in Proceedings of the 25th International Conference Companion on World Wide Web, Republic and Canton of Geneva, Switzerland, 2016, pp. 81-82, doi: 10.1145/2872518.2889372.
[19] K. Ravi and V. Ravi, “A survey on opinion mining and sentiment anal-ysis: tasks, approaches and applications,” Knowl.-Based Syst., vol. 89, pp. 14-46,2015.
[20] S. Asur and B. A. Huberman, “Predicting the Future with Social Media,” in Proceedings of the 2010 IEEE/WIC/ACM International Conference on Web Intelligence and Intelligent Agent Technology - Volume 01, Washington, DC, USA, 2010, pp. 492-499, doi: 10.1109/ WI-IAT.2010.63.
[21] G. Eysenbach, “Can Tweets Predict Citations? Metrics of Social Impact Based on Twitter and Correlation with Traditional Metrics of Scientific Impact,” J. Med. Internet Res., vol. 13, no. 4, p. e123, Dec. 2011, doi: 10.2196/jmir.2012.
[22] J. Ritterman, M. Osborne, and E. Klein, “Using prediction markets and Twitter to predict a swine flu pandemic,” in Ist International Workshop on Mining Social Media, 2009, vol. 9, pp. 9-17.
[23] X. Chen, Y. Cho, and S. Y. Jang, “Crime prediction using Twitter senti-ment and weather,” 2015, pp. 63-68, doi: 10.1109/SIEDS.2015.7117012.
[24] M. D. Conover, B. Goncalves, J. Ratkiewicz, A. Flammini, and F. Menczer, “Predicting the Political Alignment of Twitter Users,” 2011, pp. 192-199, doi: 10.1109/PASSAT/SocialCom.2011.34.
[25] J. E. Chung and E. Mustafaraj, “Can collective sentiment expressed on twitter predict political elections?,” in AAAI, 2011, vol. 11, pp. 1770-1771.
[26] L. Dang-Xuan, S. Stieglitz, J. Wladarsch, and C. Neuberger, “An Inves-tigation of Influentials and the Role of Sentiment in Political Communi- cation on Twitter During Election Periods,” Inf. Commun. Soc., vol. 16, no. 5, pp. 795-825, June 2013, doi: 10.1080/1369118X.2013.783608.
[27] A. Tumasjan, T. O. Sprenger, P. G. Sandner, and I. M. Welpe, “Predict- ing elections with twitter: What 140 characters reveal about political sentiment,” Icwsm, vol. 10, no. 1, pp. 178-185, 2010.
[28] A. Bermingham and A. Smeaton, “On using Twitter to monitor political sentiment and predict election results,” in Proceedings ofthe Workshop on Sentiment Analysis Where AI meets Psychology (SAAIP 2011), 2011,pp. 2-10.
[29] H. Wang, D. Can, A. Kazemzadeh, F. Bar, and S. Narayanan, “A System for Real-time Twitter Sentiment Analysis of 2012 U.S. Pres- idential Election Cycle,” in Proceedings of the ACL 2012 System Demonstrations, Stroudsburg, PA, USA, 2012, pp. 115-120.
[30] A. Bessi and E. Ferrara, “Social Bots Distort the 2016 US Presiden- tial Election Online Discussion,” Social Science Research Network, Rochester, NY, SSRN Scholarly Paper ID 2982233, Nov. 2016.
[31] W. He, S. Zha, and L. Li, “Social media competitive analysis and text mining: A case study in the pizza industry,” Int. J. Inf. Manag., vol. 33, no. 3, pp. 464-472, 2013.
[32] A. Mittal and A. Goel, Stock Prediction Using Twitter Sentiment Analysis.
[33] W. Chamlertwat, P. Bhattarakosol, T. Rungkasiri, and C. Haruechaiyasak, “Discovering Consumer Insight from Twitter via Sentiment Analysis,” J UCS, vol. 18, no. 8, pp. 973-992, 2012.
[34] T. K. Das, D. P. Acharjya, and M. R. Patra, “Opinion mining about a product by analyzing public tweets in Twitter,” in 2014 International Conference on Computer Communication and Informatics, 2014, pp. 1-4, doi: 10.1109/ICCCI.2014.6921727.
[35] X. Fang and J. Zhan, “Sentiment analysis using product review data,” J. Big Data, vol. 2, no. 1, p. 5, Dec. 2015, doi: 10.1186/s40537-015- 0015-2.
[36] M. M. Mostafa, “More than words: Social networks’ text mining for consumer brand sentiments,” Expert Syst. Appl., vol. 40, no. 10, pp. 4241-4251, Aug. 2013, doi: 10.1016/j.eswa.2013.01.019.
[37] H. A. Aldahawi and S. M. Allen, “Twitter Mining in the Oil Business: A Sentiment Analysis Approach,” in 2013 International Conference on Cloud and Green Computing, 2013, pp. 581-586, doi: 10.1109/CGC.2013.101.
[38] E. Guzman and W. Maalej, “How Do Users Like This Feature? A Fine Grained Sentiment Analysis of App Reviews,” in 2014 IEEE 22nd International Requirements Engineering Conference (RE), 2014, pp. 153-162, doi: 10.1109/RE.2014.6912257.
[39] D. Kang and Y. Park, “Review-based measurement of customer satis- faction in mobile service: Sentiment analysis and VIKOR approach,” Expert Syst. Appl., vol. 41, no. 4, Part 1, pp. 1041-1050, Mar. 2014, doi: 10.1016/j.eswa.2013.07.101.
[40] J. Si, A. Mukherjee, B. Liu, Q. Li, H. Li, and X. Deng, “Exploiting topic based twitter sentiment for stock prediction,” in Proceedings ofthe 51st Annual Meeting of the Association for Computational Linguistics (Volume 2: Short Papers), 2013, vol. 2, pp. 24-29.
[41] T. Rao and S. Srivastava, “Analyzing Stock Market Movements Using Twitter Sentiment Analysis,” in Proceedings of the 2012 International Conference on Advances in Social Networks Analysis and Mining (ASONAM 2012), Washington, DC, USA, 2012, pp. 119-123, doi: 10.1109/ASONAM.2012.30.
[42] J. Bollen, H. Mao, and X. Zeng, “Twitter mood predicts the stock market,” J. Comput. Sci., vol. 2, no. 1, pp. 1-8, Mar. 2011, doi: 10.1016/j.jocs.2010.12.007.
[43] J. Smailovic, M. Grcar, N. Lavrac, and M. Znidarsic, “Stream-based active learning for sentiment analysis in the financial domain,” Inf. Sci., vol. 285, pp. 181-203, Nov. 2014, doi: 10.1016/j.ins.2014.04.034.
[44] L. Bing, K. C. C. Chan, and C. Ou, “Public Sentiment Analysis in Twitter Data for Prediction of a Company’s Stock Price Movements,” in 2014 IEEE 11th International Conference on e-Business Engineering, 2014, pp. 232-239, doi: 10.1109/ICEBE.2014.47.
[45] N. Oliveira, P. Cortez, and N. Areal, “Some Experiments on Modeling Stock Market Behavior Using Investor Sentiment Analysis and Posting Volume from Twitter,” in Proceedings of the 3rd International Conference on Web Intelligence, Mining and Semantics, New York, NY, USA, 2013, pp. 31:1-31:8, doi: 10.1145/2479787.2479811.
[46] X. Li, H. Xie, L. Chen, J. Wang, and X. Deng, “News impact on stock price return via sentiment analysis,” Knowl.-Based Syst., vol. 69, pp. 14-23, Oct. 2014, doi: 10.1016/j.knosys.2014.04.022.
[47] U. R. Hodeghatta, “Sentiment Analysis of Hollywood Movies on Twit- ter,” in Proceedings of the 2013 IEEE/ACM International Conference on Advances in Social Networks Analysis and Mining, New York, NY, USA, 2013, pp. 1401-1404, doi: 10.1145/2492517.2500290.
[48] Abd. S. H. Basari, B. Hussin, I. G. P. Ananta, and J. Zeniarja, “Opin- ion Mining of Movie Review using Hybrid Method of Support Vector Machine and Partióle Swarm Optimization,” Procedía Eng., vol. 53, pp. 453-462, Jan. 2013, doi: 10.1016/j.proeng.2013.02.059.
[49] T. T. Thet, J.-C. Na, and C. S. G. Khoo, “Aspect-based sentiment analysis of movie reviews on discussion boards,” J. Inf. Scí., vol. 36, no. 6, pp. 823-848, Dec. 2010, doi: 10.1177/0165551510388123.
[50] A. Amolik, N. Jivane, M. Bhandari, and M. Venkatesan, “Twitter senti-ment analysis of movie reviews using machine learning techniques,” Int. J. Eng. Technol., vol. 7, no. 6, pp. 1-7, 2016.
Biographies

Ahsan Mahmood received the master's degree in computer science from the COMSATS University, Attock campus, Pakistan. His research interests include Data Mining, Social Media Analysis, Sentiment Analysis and Machine Learning.

Hikmat Ullah Khan received the master's degree in computer science and the Ph.D. degree in computer science from International Islamic University, Islamabad. He has been an Active Researcher for the last ten years. He is currently an Assistant Professor with the Department of Computer Science, COMSATS University Islamabad, Wah Cantt, Pakistan. He has authored a number of research articles in top peer-reviewed journals and international conferences. His research interests include social Web mining, semantic Web, data science, information retrieval, and scientometrics. He is an Editorial Board Member of a number of prestigious impact factor journals.

Muhammad Ramzan is currently pursuing the Ph.D. degree with the University of Management and Technology, Lahore, Pakistan. He is currently a Lecturer with the University of Sargodha, Pakistan. He has authored several research articles published in reputed peer-reviewed journals. His areas of research include algorithms, machine learning, software engineering, and computer vision.
Journal of Web Engineering, Vol. 19_1, 1–28.
doi: 10.13052/jwe1540-9589.1911
© 2020 River Publishers