A Metrics Framework for Evaluating Microservices Architecture Designs
O. Al-Debagy* and P. Martinek
Department of Electronics Technology, Budapest University of Technology and Economics, Hungary
E-mail: omeraldebagy@gmail.com; martinek@ett.bme.hu
* Corresponding Author
Received 13 September 2019; Accepted 09 April 2020; Publication 12 June 2020
Abstract
Microservices are becoming a more popular software architecture among companies and developers. Therefore, there is a need to develop methods for quantifying the process of measuring the quality of microservices design. This paper has created a novel set of metrics for microservices architecture applications. The proposed metrics are the Service Granularity Metric “SGM”, the Lack of Cohesion Metric “LCOM”, and the Number of Operations “NOO”. The proposed metrics measure the granularity, cohesion, and complexity of individual microservices through analyzing the application programming interface “API”. Using these metrics, it is possible to evaluate the overall quality of the design of microservices applications. The proposed metrics were measured on 5 applications with different sizes and business cases. This research found that the value for the SGM metric needs to be between 0.2 and 0.6. Besides, the value of LCOM metric for a microservice needs to be between 0 and 0.8 with less than ten operations per microservice. These findings can be applied in the decomposition process of monolithic applications as well.
Keywords: Microservices, software metrics, lack of cohesion, service granularity, service complexity.
1 Introduction
Nowadays, many companies are migrating to microservices architecture because of the advantages that this architecture is providing, such as ease of maintenance, flexibility in implementing different technologies, more scalability, and better IT governance [1]. Nevertheless, there is still no clear approach on how to evaluate the design of microservices applications in order to create exceptional designs [2]. Although other software architectures and approaches have different methods and metrics to evaluate their design, microservices architecture have no dedicated metrics; therefore, this research is presenting different software metrics in order to evaluate the design of microservices applications.
Software metrics are used to measure software quality, which is an essential method to make the quality of software quantifiable [3, 4]. Applications are becoming more complex and sophisticated. Besides, they need to be updated regularly due to the demands of customers. Hence, the need for software metrics is essential to estimate the cost of these developments and the later maintenance of them. There are different types of software metrics in the literature for different types of architectures and environments, such as cohesion, coupling, complexity, granularity, etc.
Newman mentioned in his book, titled “Building microservices: designing fine-grained systems”, that good service design should focus on high cohesion and loose coupling. So a good service needs to have several functions that are related to each other, and communicate with other functions as loosely as possible, based on Newman’s description of a good design [5]. Another aspect that can affect the performance of microservices is the size of the application or the size of these services, which can be referred to as granularity [6]. Therefore, cohesion and granularity metrics are considered in this paper.
Cohesion is “the degree of conceptual consistency within an object” [7]. In object-oriented programming, cohesion refers to the degree in which data and methods in a class are related to each other. Software with high cohesion tends to be more favored compared to software with low cohesion, because high cohesion software refers to qualities such as reliability, understandabil-ity, robustness, and reusability. Thus, microservices applications needs to be cohesive in order to provide good performance to the users.
Service granularity is the range of functionalities provided by a service [8]. Different services have different levels of granularity. Business logic and requirements can affect the granularity of service operations in a service-oriented architecture. Fine-grained services can increase the reusability of business logic significantly. Also, fine-grained services can improve cohesion, coupling, and better understanding of the design. Nevertheless, finegrained services lead to increased traffic on the network, and the processing of identifying and working with errors more challenging. However, these issues can be solved with a faster and more stable network [9].
As a result of the lack of empirical research on the evaluation metrics for microservices design, and the need for an approach to identify the goodness of a microservices application. Also, the topic of microservices is still young especially evaluation metrics for microservices [10]. Therefore, these points motivated this research work. This research presented a set of evaluation metrics to measure the quality of microservices design and validate the measurement of these metrics against several microservices applications design. The proposed metricsprovide guidelines for developers in the process of decomposing monolithic applications into microservices applications.
2 Literature Review
Elhag et al. [11] introduced a set of metrics for evaluating the design of service-oriented design. They introduced two types of metrics, the first type called basic metrics, and the second type is called derived metrics. The basic metrics include number of services, number of operations, provider, consumer, and importance of provider. Derived metrics includes coupling metric, cohesion metric, and complexity metric. The results of their paper show the significance of these metrics and how these metrics can be calculated. These metrics were evaluated theoretically but the paper lacks empirical evaluation.
In Perepletchikov et al. [12] research, the authors introduced the effects of cohesion metrics on maintainability prediction. The metrics that they presented were Service Interface Data Cohesion, which measures the cohesion of service by finding which operations are using the same input parameters. A service is considered highly cohesive when all the operations in a service share the same input parameters. The second metric is Service Interface Usage Cohesion, which works by finding the number of clients that are using specific operations in the service. The service is considered highly cohesive if all the service operations get invoked by all the clients or service consumers. The third metric of Perepletchikov et al. paper [12] is Service Sequential Usage Cohesion which is similar to the previously mentioned metrics but it takes the dependency between the service operations into consideration, for example, the service is considered cohesive if the output of one operation is the input of another operation. The fourth metric is Strict Service Implementation Cohesion, which measures the cohesiveness of a service based on the exposure of its operations through the interface. Thus, it is presenting the relatedness between implementation elements. The fifth metric is Loose Service Implementation Cohesion, which is similar to Service Sequential Usage Cohesion, except it also considers the indirect connection between elements in the measurement. The last metric is Total Interface Cohesion of a Service, which is the normalized sum of all the previously mentioned metrics, which it represents the total cohesiveness of a service. They used property-based software engineering measurement framework proposed by Briand et al. [13] to validate their metrics, which consist of several mathematical properties to define complexity, cohesion, coupling and size of software. These metrics are similar to the cohesion metrics that are proposed by this paper because both of them are derived from metrics that are used for object-oriented programming. Perepletchikov et al. [12] research was not validated empirically which can be considered a limitation.
The process of application decomposition through measuring cohesion between the services interface is presented in Athanasopoulos et al. [14]. The first metric is Message Level Cohesion, which measures the similarities between the messages that are used by operations, so two operations are related if the input and output messages of these operations are similar. The other metric is Conversation Level Cohesion, which measures the cohesion between operations on the premises that the output of one operation is similar to the input of the other operation. Thus, two operations are similar if the input of one of them is similar to the output of another operation. The next metric is Domain Level Cohesion, which measures cohesion between operations if these operations have similar functionalities. In other words, two operations are considered related to each other if the names of these operations share same domain-level terms. In their paper, Athanasopoulos et al. [13] found a decomposition method for decomposing application based on the cohesion level of the services interface, and their method of measuring the cohesion between these services are interesting to the work of this research. Because they used similar methodology to the proposed method of this research paper, this method is analyzing the interface of services in order to find the quality of application design. But Athanasopoulos et al’s metrics are used for web services while this research’s metrics are proposed for microservices architecture. Furthermore, this research provides other metrics for microser-vices architecture, such as granularity and complexity, that Athanasopoulos et al. did not provide.
In research done by Heinrich and Zimmermann [15], they propose four different granularity metrics in order to decide if services are fine-grained or coarse-grained. Their research focused on a service-oriented architecture, while this research paper focuses on microservices architecture. The first metric is Width metric, which works based on the number of direct and indirect functions that a service is providing. The value of this metric is between 1 and 0, where a value close to 0 refers to coarse-grained service granularity, while a value close to 1 refers to a fine-grained service granularity. Secondly, the Depth metric is instinctively interpretable and uses the decomposition layer where the services can be found, and this feature makes these metrics different than Width metric. Also, its value is between 0 and 1, where 0 refers to coarse-grained services and one refers to fine-grained services. The third metric is a combination of the previous two metrics, Width and Depth. This combination improves the measurement of these metrics because it combines the advantages of them. The last metric is Size, where each function is calculated independently using its lines of code. Again, similar to previous researches, this research is focusing on one aspect of service-oriented applications rather than more than one. Also, they did not provide proper validation for their metrics.
A research done by Alahmari et al. [16] presents a framework to evaluate service granularity in a service-oriented architecture. This framework consists of several metrics to measure the granularity of services. The metrics for data granularity score which consists of assigning a weight for different data types in parameters; for example, simple data type parameter has 1 as a weight, user-defined data type has 5, and complex data types have 10 as a weight. The value of this metric is between 0 and 1. The closer to 1 it is, the more coarse-grained the services are. Another metric from this framework is Functional Granularity Score, which works by assigning different weights for different types of operations; for example, assigning 1 as a weight if the service operation has only CRUD “create, read, update, and delete” operations, assigning 5 if the operation perform business logic, and assigning 10 as a weight if the operation performs business logic and has CRUD operations. Finally, Service Operations Granularity “SOG” metric is the product of multiplying ODG “Operational Data Granularity” and OFG “Operational Functional Granularity” metrics of each operation, which is the metric that gives the measurement of the granularity between services. In order to get the granularity of the whole application, they calculated the average of SOG scores of the services. This research paper is implemented a similar version of Alahmari et al. metrics with some modifications in order to be suitable for microservices architecture design. Their case study was rather small consisting of one application with 14 operations.
An important measurement for assessing the complexity of any software is the number of methods that it has. Weighted Methods per Class “WMC” is a metric used for object-oriented programming in order to find a number of methods used by a specific class. The hypothesis of this metric is that a class with a higher number of methods is more prone to errors compared to classes with fewer methods [17]. In their research they used the complexity of the methods, which they used the number of methods as the complexity metric for classes [18]. Therefore, the number of operations per microservice has been considered as a complexity metric for the microservices application.
The Lack of Cohesion metric measures the cohesiveness of a class in an object-oriented environment by finding the similarity between methods and fields within a class [19]. The Lack of cohesion method by Chidamber and Kemereris defined as the number of methods in a class that does not have any common fields between each other minus the number of methods in the class that has at least one common field [20]. A revised version of the Lack of Cohesion was introduced by Henderson-Sellers [13] in order to normalize it. A revised version of Henderson-Sellers’s lack of cohesion metric is used in this paper, in order to be suitable for microservices design.
In a research [22] done by Coscia et al.used metrics to calculate the quality of software design using WSDL documents of Web Services. Furthermore, they presented a statistical correlation analysis showing the correlation between object-oriented metrics and WSDL metrics. Also, they used 11 different metrics for calculating service implementations. For example, they used WMC and LCOM, which are similar to some metrics that are presented in this research.
Taibi and Systa [23] proposed a decomposition method using a data driven approach based on process mining through utilizing log files as a data source. Their decomposition method consisted of 6 steps. The first step is execution analysis path. The next step is the frequency analysis of the execution path. The third step is removing circular dependencies. The fourth step is identifying decomposition options. The fifth step is ranking the decomposition options based on metrics. The final step is selecting the decomposition option. They used coupling and the number of classes as metrics for step 5. They proposed a coupling metric to validate the proposed microservices by their decomposition method. Moreover, evaluating microservices with more metrics, such as cohesion and granularity, can provide more information regarding the application, which this point can be considered a limitation to the research of Taibi and Systa [23].
Jin et al. [24] proposed new cohesion and coupling metrics to evaluate the design of microservices. These metrics evaluate the design of microservices through analyzing the interface and classes of the source code. They introduced two metrics for calculating cohesion at domain level and message level. Also, three coupling metrics were defined through identifying the interaction between the microservices. Their approach for calculating the cohesion metric is different than the lack of cohesion metric that was proposed in this paper, because they used source code as base for their metric, while our proposed LCOM uses APIs.
A complexity metric for microservices applications was presented by Santos and Silva [25]. This metric was used to evaluate the proposed microservices while migrating from monolithic applications. They calculated the complexity of each functionality in the application. The proposed metrics measures the complexity through the cost of the decomposition process. So, two metrics were proposed for complexity, first, complexity of a functionality, and second, complexity of a decomposition. In order to evaluate their metrics, they used correlation with other metrics, similar to the approach that we used to this research paper.
A literature review [10] was done by Bogner et al., which investigates different metrics for measuring maintainability used in service-oriented architecture and their applicability in a microservices architecture. They characterized the researches that they found into 4 different categories which were size, complexity, coupling, and cohesion. In their research they found only one metric that is related to size, which is Weighted Service Interface Count “WSIC” which represents the number of available operations through the service API. Then they discussed the applicability of these metrics on microservices applications. Though they did not apply any of the obtained metrics on any specific microservices application.
Comparing the presented metrics of this research with the metrics that are available in the literature, it is apparent that there is a small number of researchers working on metrics that are dealing with microservices architecture. Furthermore, the scope of the proposed metrics is different than the available metrics in the literature. For example, this research provided a metrics framework that focus on granularity, cohesion, and complexity, while other papers are focusing on each metric alone or different combinations of other metrics.
The mentioned papers in the literature review fall into three groups based on the approaches they used to measure their metrics. The first group is the researches that used service interfaces to obtain their metrics measurements. This group focuses on measuring the metrics without accessing the source code, and this group includes [12, 14, 16], and [22]. A second group is the researches that used source code as their medium to obtain the metrics measurements, and this group includes these researches [23–25]. The third group consists of only single research [15], which utilized a graph definition to measure their defined metrics. Lastly, there are two other researches [10, 11], which did not fall into any of the mentioned groups, because they used theoretical approaches of evaluation instead of empirical methods. The approach that our research used falls under the first group because it uses API to measure the proposed cohesion, complexity, and granularity metrics for microservices applications.
Table 1 presents a comparison of the metrics presented in the literature review section. This table consists of the authors of the papers and the metrics that these papers focused on such as cohesion, complexity, coupling, or granularity. Also, the architecture of the architectural style that the listed metrics targets like Service Oriented Architecture “SOA”, microservices, or others. Additionally, the approach that the research used to obtain the metrics.
3 Proposed Microservices Metrics
This section of the paper presents the metrics for measuring the cohesiveness, granularity, and complexity of the services in a microservices application by obtaining operations of the services from the application programming interface “API” and extracting several information from these operations such as input parameters, output responses, and type of operations. Using the extracted information from the API, several metrics were created to measure the quality of a microservices application, and these metrics were Lack of Cohesion Metric “LCOM”, Service Granularity Metric “SGM”, and Number of Operations “NOO”.
3.1 The Lack of Cohesion Metric “LCOM”
LCOM measures the cohesiveness or, in other words, the similarity between the operations in specific service and if these operations are related to each other. In this research, the LCOM metric is based on Henderson-Sellers’s lack of cohesion metric for object-oriented programming. It consists of finding how many times a specific parameter has been used in a specific microservice, divided by the product of the number of operations multiplied by the number of unique parameters, see Equation 1 below.
| (1) |
where MF is the occurrence of a parameter in a specific microservice, M is the number of operations in a specific microservice, and F is the number of unique parameters in a microservice.
Furthermore, finding the average of LCOM in order to get the lack of cohesion for the whole microservices application, and the value of LCOM must be between zero and unity. The closer to unity, the more the applications lack cohesion, which leads to more complexity and in return may lead to more errors in the application. Therefore, zero is considered the perfect score for this metric which means the microservice has operations that are entirely related to each other and fully cohesive. Equation 2 gives the LCOM average for the entire microservices application.
| (2) |
Table 1 Presented publications
| Papers | Focus | Architecture | Approach |
| Elhag et al. [11] | coupling, cohesion and complexity | OSA | Theoretical |
| Perepletchikov et al. [12] | cohesion | SOA | Service Interface |
| Athanasopoulos et al. [14] | cohesion | Web Services | Service Interface |
| Heinrich and Zimmermann [15] | granularity | SOA | Graphs |
| Alahmari et al. [16] | granularity | SOA | Service Interface |
| OrdialesCoscia et al. [22] | cohesion- and complexity | Web Services | Service Interface |
| Bogner et al. [10] | size, complexity, coupling, and cohesion | Microservices | Theoretical |
| Taibi and Systa [23] | coupling | Microservices | Source Code |
| Jin et al. [24] | cohesion and coupling | Microservices | Source Code |
| Santos and Silva [25] | complexity | Microservices | Source Code |
| This research | Cohesion, complexity, and granularity. | Microservices | API |
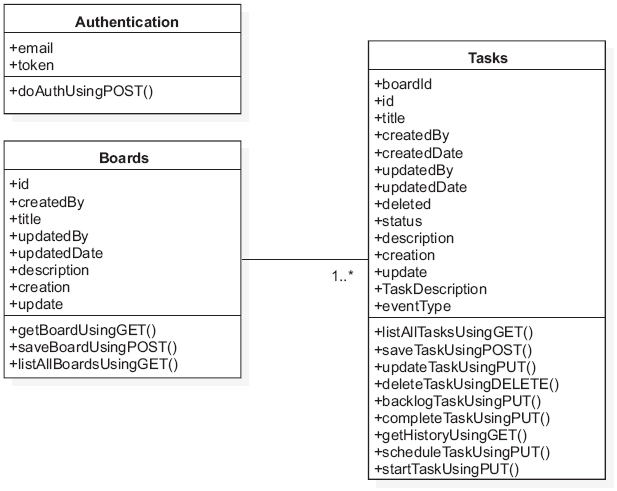
Figure 1 Kanban boards application architectural diagram.
where NS is the number of microservices in the application. This metric can show the overall goodness of the application, and n is the number of operations in the microservice.
An API for a small microservices application (Table 2) has been used to show the mechanism of these metrics in detail [26]. The application consists of three microservices and 13 operations. The name of the application is the Kanban Board, which is a sample application written in Java; it allows users to create Kanban boards and tasks. For further testing more applications were used in the next section of the research.
Also, Figure 1 shows an architectural view of Kanban Boards application, which is the application that is used to illustrate the mechanism of how the metrics are being calculated.
Table 2 Microservices example
| Microservice Name | Method Name | Description | Input parameters | Output Parameters |
| Boards | getBoardUsingGET | Request Board using GET method | id | createdBy, createdDate, id, title, updatedBy, updatedDate, description |
| saveBoardUsingPOST | Save Board to the database using POST method. | title, creation, update, description | createdBy, createdDate, id, updatedBy, updatedDate | |
| listAllBoardsUsingGET | Request all boards using GET method | createdBy, createdDate, id, title, updatedBy, updatedDate, description | ||
| Tasks | startTaskUsingPUT | Make the task active using PUT method | id, boardId | |
| scheduleTaskUsingPUT | Schedule a task using PUT method | id, boardId | ||
| getHistoryUsingGET | Retreive all previous tasks using GET method | id | eventType, boardId, createdBy, createdDate, description, deleted, status, title, updatedBy, updatedDate | |
| completeTaskUsingPUT | Assign a task completed using PUT method | id, boardId | ||
| backlogTaskUsingPUT | Backlog task using PUT method | id | ||
| deleteTaskUsingDELETE | Delete a task using DELETE method | id | ||
| updateTaskUsingPUT | Update a task using PUT method | Id, TaskDescription, title | ||
| saveTaskUsingPOST | Save a task using POST method | boardId, creation, update, deleted, status, title, TaskDescription | createdBy, createdDate, description, id, updatedBy, updatedDate | |
| listAllTasksUsingGET | Request all tasks using GET method | boardId | id, title, createdBy, createdDate, updatedBy, updatedDate, deleted, status, description | |
| Authentication | doAuthUsingPOST | Login using POST method | token |
For example, LCOM for Boards microservice was 0.11, which means this microservice has a cohesive relationship between its operations. It was calculated as follows:
where 24 refers to the total number of all parameters, 3 is the number of operations inside the microservice, and 9 is the total number of unique parameters without repetition. The LCOM value for the other microservices is zero for Authentication microservice and 0.64 for Tasks microservice. In order to get the overall LCOM value for the whole application, we need to calculate the average of LCOM, was calculated like this:
The ALCOM value of 0.25 signifies that the application has a good cohesion among its microservices as well as a high cohesion between its operations, which means easier maintainability and increased reusability.
3.2 The Service Granularity Metric “SGM”
SGM metric consists of two different measurement metrics in order to measure the service granularity of a microservices application. These two metrics are Data Granularity of a Service “DGS” and Functional Granularity of a Service “FGS”.
First, DGS takes into consideration the size of the input and output data of a specific microservice and calculates DGS for each operation in the microservice. The measurement of “DGS” checks if the operations are using excessive data. Fine-grained and coarse-grained parameters define the whole idea of DGS metric. DGS is defined as follows:
| (3) |
where Input Parameters “IPR” represents the number of input parameters in an operation, FP is the total number of input parameters in a microservice, Output Parameters “OPR” is the number of output parameters in an operation, and CP is the total number of output parameters in a microservice. If the value of DGS close to 1 it indicates coarse-grained data in the microservice. While the value of DGS is close to 0 indicates fine-granular data.
The DGS metric was calculated for the Kanban Board application using the same data available in Table 2. For example, DGS value for getBoard-UsingGET operations was 0.57, which indicates that the microservice has a right granularity level because it is not too fine-grained or too coarse-grained. In order to get the service granularity metric of the microservice, we need to calculate the DGS metric for every operation in the microservices application. The DGS value for getBoardUsingGET operation is calculated as follows:
The Functional Granularity of a Service “FGS” metric measures the functional granularity of operations in a microservice. Each operation has a different level of capability or a different level of logic. The FGS assigns different weights to each CRUD function (create, read, update, and delete). These weights depend on the level of data manipulation that the operation accomplishes; for instance, a create operation has a higher weight than the other operations because it creates new records in the database. Therefore, create operations have a weight of 4, update operations have a weight of 3, delete operations have a weight of 2 and read operations have a weight of 1. In order to measure the functionality granularity of each operation in a microservice, the FGS metric is defined as follows:
| (4) |
where OT is the weight for a specific operation in a microservice, and O is the summation of all the weights in a specific microservice. For example, calculating FGS for getBoardUsingGET operation, which is a read operation, results in a 0.17 score for the FGS metric. This value is the result of dividing the weight of this read operation, which is 1 by the total weights of all the operations in the microservice which is equal to 6, which is the addition of three different operations, two of them are read operations and one is a create operation. This FGS score was calculated as follows:
Finally, Service Granularity Metric “SGM” measures the overall granularity of operation based on DGS and FGS metrics for every operation in the microservices application. SGM was defined as it is presented in Equation 5.
| (5) |
The SGM metric for Boards microservice of Kanban Board was calculated as follows:
where the value of the SGM metric for Boards microservice indicates a good score, because the microservice is not too fine-grained or too coarse-grained, which means this microservice has a good design.
In order to get the granularity for the whole microservices application, an average of SGM of all the microservices is considered where SGM is greater than zero and number of microservices are greater than zero as well, so the Average Service Granularity Metric is defined as follows, where NS is the number of microservices:
| (6) |
where the value of ASGM for the Kanban Boards application,which is presented in Table 2, can be calculated as follows:
which shows the overall granularity score for the Kanban Boards application, which is 0.31, so in this case, it means this application has a good granularity score.
3.3 Proposed Number of Operations Per Microservice Metric “NOO”
The number of operations per service is the number of member operations related to one microservice (see Eq. 7). Similar to the WMC metric [18], which considers the number of member methods related to a specific class as a complexity metric, higher number of methods leads to higher complexity. In the case of microservices, number of operations related to a specific microservice is the complexity indicator for the microservices application.
| (7) |
where M is the number of operations per service. The higher the number of this metric, the more error the application may produce.
In Table 2, considering Boards microservice as an example, the NOO value for this microservice is going to be 3 because it has 3 operations, which they are getBoardUsingGET, saveBoardUsingPOST, and listAllBoardsUs-ingGET. On the other hand, the Tasks’ microservice NOO value is 9 because it has 9 operations. This means that Tasks microservice is more complicated than Boards microservice, which means this can lead Tasks microservice to produce more errors than Boards microservice.
4 Results and Discussion
In this section of the paper, we present the acquired results from calculating the metrics scores on five different applications. Two of these applications are considered small, one of them is medium-sized, and the other two are large industrial applications. First the Kanban Board application [26]. The application consisted of three microservices and 13 operations. The application is a sample application written in Java; it allows users to create Kanban boards and tasks. Second, The Money Application [27], which is a simple money transfer application gives the ability to its users to create and view banking accounts and transfer money between them. Third, Galileo is “an analytics platform for APIs, Microservices, and Serverless Software” [28]. Fourth, PayPal [29] is a platform that enables users to facilitate payments between customers using online transfer.
Fifth, Amazon Web Services [30] is a cloud services provider platform offers multiple services for its users, such as content delivery networks, database storage, computational power, and others. The data for the experiments were collected from the APIs of the previously mentioned applications. These data were the operations of each microservice, the type of these operations were POST, PUT, DELETE, or GET, the number of parameters of these operations, and the number of microservices for each application.
A descriptive statistics table of the metrics for all the tested applications is presented in Table 3, which shows some interesting points regarding the metrics. For example, LCOM values are affected by the number of operations and the number of microservices in the application, so it means that this metric is affected by the size of the application or the complexity. For instance, maximum values for LCOM metric in the small and medium-sized applications are ranged from 0.48 to 0.68, while the maximum values of this metric in the big applications ranged from 0.88 to 0.89. This can show some relation between NOO and LCOM metric, which means big applications tend to be less cohesive than smaller applications. On the contrary, for the SGM metric, the maximum values for this metric range between 0.25 to 0.76 without any clear pattern. This can mean that there is an effect of the number of parameters that the operations of the microservice have and the type of these operations on the value of SGM.

Figure 2 Comparison between ALCOM and ASGM of all the applications.
Furthermore, some observations regarding the descriptive summary of all applications in Table 3 were the followings:
- – The highest value of metric NOO is 24, which means that the largest number of operations per microservice is 24.
- – LCOM with the lowest value of 0, which may refer to a microservice with only one operation. Therefore, it has a high cohesion because it has a single operation in the microservice.
The final results of these metrics are ANOO, ALCOM, and ASGM, which are showing the overall value of these metrics for the whole applications. Table 4 presents these metrics for all the tested applications, where we noticed that ALCOM ranged from 0.25 to 0.53. For ASGM, the range of these metrics starts from 0.35 and ends by 0.58. From Table 4, we can see that the size of the application has an effect on the cohesion between the microservices of the application. The higher the number of microservices, the less cohesive the application will be.
Figure 2 presents a comparison between ASGM and ALCOM of all the five applications, which can show that ALCOM increased when the size of the applications increased, while ASGM decreased while the size of the application increased. Hence, there was a clear relationship between the size of the application and its cohesiveness, while there was no clear connection between the size and granularity of the application.
Table 3 Descriptive summary of all the applications and calculated values for all microservices of all tested applications
| Kanban | Money | Galileo | PayPal | AWS | All | |||||||||||||
| NOO | LCOM | SGM | NOO | LCOM | SGM | NOO | LCOM | SGM | NOO | LCOM | SGM | NOO | LCOM | SGM | NOO | LCOM | SGM | |
| Mean | 4.33 | 0.25 | 0.31 | 2.75 | 0.3 | 0.55 | 4.5 | 0.38 | 0.42 | 7.13 | 0.57 | 0.34 | 6.35 | 0.53 | 0.39 | 5 | 0.54 | 0.33 |
| Median | 3 | 0.11 | 0.25 | 2.5 | 0.36 | 0.55 | 4 | 0.41 | 0.35 | 5 | 0.52 | 0.34 | 5.5 | 0.58 | 0.34 | 6 | 0.5 | 0.38 |
| Minimum | 1 | 0 | 0.02 | 1 | 0 | 0.25 | 1 | 0 | 0.25 | 1 | 0 | 0.09 | 1 | 0 | 0.08 | 1 | 0 | 0.02 |
| Maximum | 9 | 0.64 | 0.49 | 5 | 0.48 | 0.86 | 8 | 0.68 | 0.67 | 21 | 0.88 | 0.52 | 24 | 0.89 | 0.73 | 24 | 0.89 | 0.76 |
Table 4 All the metrics values of overall metrics
| ALCOM | ASGM | ANOO | # of microservice | |
| Kanban | 0.25 | 0.43 | 4.33 | 3 |
| Money | 0.3 | 0.58 | 2.75 | 4 |
| Galileo | 0.38 | 0.39 | 4.5 | 8 |
| PayPal | 0.57 | 0.35 | 7.13 | 15 |
| AWS | 0.53 | 0.39 | 6.35 | 52 |
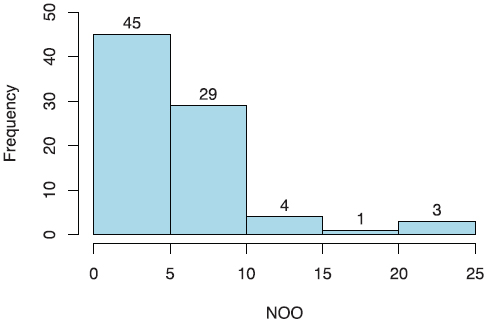
Figure 3 Histogram of all NOO values.
Figure 3 shows that most microservices have a small number of operations ranges between 1–10. Most microservices seem to be simple in terms of the number of operations, which means it will provide specific abstraction and functionality. The largest microservice has 24 operations, which is a part of the AWS application, and it is the largest application in terms of size that have been used in this research paper. It has 0.84 LCOM value and 0.08 SGM value, which means too fine-grained and not cohesive design.
A microservice with a high LCOM value tends to have more diverse functionality compared to a microservices with a low LCOM. A microservice with high LCOM value mostly refers to a microservice that is trying to accomplish many different objectives. Therefore, they are prone to be less predictable than microservices with lower LCOM values. These types of microservices can produce more errors and can be more difficult in testing, so it is better to divide them into multiple, more specific microservices. According to Chidamber and Kemerer [31], “Low cohesion increases complexity, thereby increasing the likelihood of errors during the development process”. The LCOM metric can be utilized by developers as a reasonably simple way to check whether the cohesion principle is followed in the design of an application and recommend changes, if needed, at an earlier stage in the design phase.
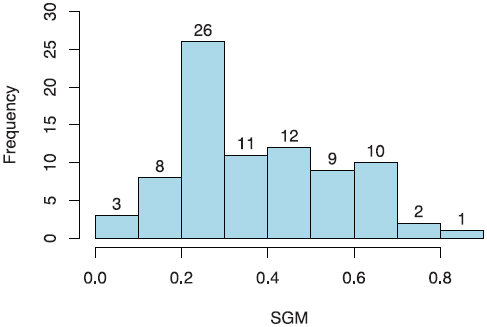
Figure 4 Histogram of all SGM values.
In Figure 4, a histogram shows the values of the SGM metric of all the tested microservices applications. Most of the microservices have an SGM value between 0.2 to 0.29. This is because most of the tested microservices have been designed according to well-known industrial applications such as Amazon and PayPal. Also, microservices with a single operation have a 0.25 SGM value, so if these microservices are not included in the results they will give different results.
5 Analysis
After showing all the acquired results of the tested applications and how the metrics are affected by different characteristics of these applications, we need to analyse the results of these tests. First, a scatter plot presenting the values of metrics LCOM and SGM for all the microservices found in the five applications to identify the correlation between these metrics and the number of operations per microservice. In Figure 5, it is clear that there is a correlation between the metric NOO and the other two metrics LCOM and SGM. In Table 5, a correlation matrix for all the microservices has been calculated using the correlation coefficient and it shows that there is a positive relation between NOO and LCOM, which means that the higher the number of operations in a microservice, the higher the value of LCOM metric. Hence, the more complex the application is, the less cohesive it will be. Therefore, there is a negative relation between cohesiveness and complexity. On the other hand, the relation between NOO and SGM is negative which means the higher the number of operations in a microservice is, the lower the value of SGM will become. Lastly, the correlation between LCOM and SGM is negative which means the higher value of LCOM the lower the value of SGM for a microservice. Therefore, granularity and cohesiveness are related to each other, see Table 5.
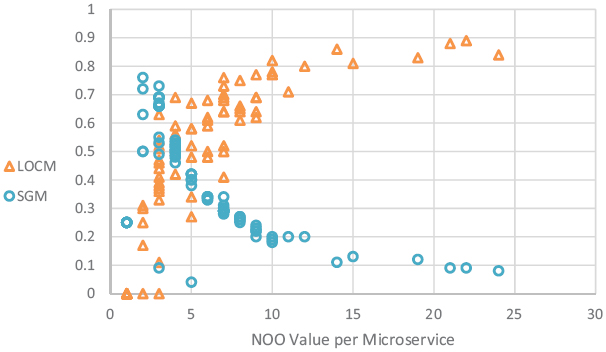
Figure 5 All metric values for all microservices.
Table 5 Correlation matrix
| NOO | LCOM | SGM | |
| NOO | 1 | ||
| LCOM | 0.74 | 1 | |
| SGM | −0.65 | −0.37 | 1 |
In another experiment, removing the microservices with a single operation from the measured cases shows a different correlation between the metrics, for example, the negative relation between SGM and LCOM was more apparent compared to the results that include all the tested microser-vices. Table 6 shows the correlation between all the microservices without including the results of microservices with a single operation because these types of microservices can be considered as outliers.
Table 6 Correlation matrix of all metric values without single operation microservices
| NOO | LCOM | SGM | |
| NOO | 1 | ||
| LCOM | 0.72517413 | 1 | |
| SGM | −0.814979 | −0.7490485 | 1 |
Table 7 Correlation matrix for all the microservices applications
| ANOO | ALCOM | ASGM | |
| ANOO | 1 | ||
| ALCOM | 0.89 | 1 | |
| ASGM | −0.69 | −0.30 | 1 |
Additionally, another correlation matrix among the values of the overall microservices applications of this paper is presented in Table 7. It shows that the correlation between the overall metrics is similar to the correlation between the metrics of the individual microservices in each application.
In order to find the optimal scale for these metrics, density distribution was used with the values of all metrics reading from every 82 microservices of 5 different applications. For example, LCOM metrics range between 0 to 0.8, 17 microservices were with metrics values between 0.5 to 0.59, 18 microservices were calculated with 0.6 to 0.69 and 10 microservices with values between 0 to 0.09, as it is shown in Figure 6. Based on that, a microservice with 0.8 and higher LCOM and consisting of more than 10 operations needs to be divided into more microservices because this type of microservices probably tends to be more error-prone.
The optimal scale for the SGM metric was also defined. A density distribution was applied using all the readings from 82 different microservices. 28 microservices were between 0.2 to 0.29 for the SGM metric, 11 for both values between 0.4 to 0.49 and 0.5 to 0.59, and values between 0.3 to 0.39 were found in 10 microservices, as it is shown in Figure 7. Therefore, the optimal range for this metric ranges from 0.2 to 0.6 for the SGM metric.
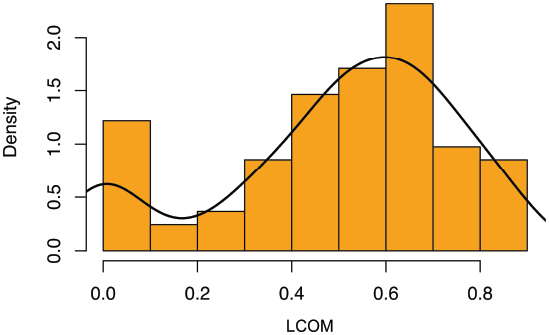
Figure 6 Density distribution of LCOM.
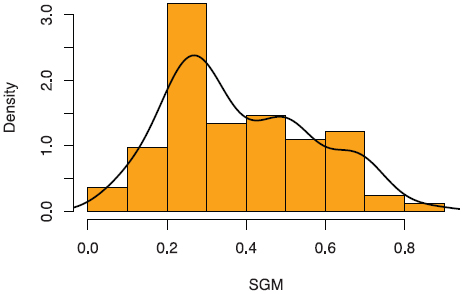
Figure 7 Density distribution of SGM.
6 Validation
This section includes the validation process of these metrics using Weyuker’s properties [32]. These properties are widely used and well-known in terms of validating software metrics [20, 33–36]. Many researchers use these properties to validate object-oriented software metrics. In this research paper, there is a version of the same properties but applied to microservices instead of classes. These properties are:
- – Property 1: there are microservices P and Q, also metric m for which m(P) ≠ m(Q). This means it is not possible for every microservice to have the same value for a metric.
- – Property 2: there should be a finite number of microservices having an identical metric score. If c is equal to zero or a positive number, so there are finite microservices P for which m(P) = c.
- – Property 3: there can be two different microservices with the same metric value such as m(P) = m(Q)
- – Property 4: if there are two microservices with the same functionality, that does not mean they have the same metric values, for which m(P) ≠ m(Q)
- – Property 5: for any microservice P and Q, we must have m(P) ≤ m(P;Q) and m(Q) ≤ m(Q;P), this means that the combination of two microservices cannot have less metric value than one microservice.
- – Property 6: for microservices P, Q, and R, if m(P) = m(Q) that does not mean m(P; R) = m(Q; R). This means that the interaction between microservices can be different depending on the functionality of these microservices.
- – Property 7: “A measure is sensitive to the permutation of classes. This property requires that permutation of elements within the item being measured can change the metric value.” [32] This property can be useful in traditional software design.
- – Property 8: renaming a microservice will not affect the metric values.
- – Property 9: if two microservices are combined there is a possibility that their metric value will increase, for which, m(P) + m(Q) < m(P;Q).
The 1st, 2nd, 3rd, 4th, 6th, and 8th properties are satisfied by all the metrics measures because these properties are general in nature; therefore, these properties are satisfied by many metrics. For example, property 1 states that not all microservices metrics can have the same value, which is already true by the results that were obtained. For property 2, there should be a fixed number of microservices in an application, which is the general case. For property 3, it is reasonable to have two different microservices with the same value metric, because large systems have a lot of microservices deployed. So, it is reasonable to assume that there might be two microservices with similar operations and parameters. For property 4, it is possible to have two microservices with same functionality but different metric values.
For property 6, if two microservices have the same metric value, that does not mean that these two microservices will have the same metric value if there will be a microservice combined with them.
For the ninth property, using the operations in Table 1, for example, authentication microservice have only one operation with 1 NOO, 0 LCOM, and 0.25 SGM, after adding another operation to the microservice the metric values become 2 NOO, 0.44 LCOM, and 0.6 SGM. Therefore, the ninth property is satisfied because combining more operations will increase the value of the metrics.
For the fifth property, we can use the previous example of the ninth property. Adding a different operation to the authentication microservice gives different metrics values, which are 2 NOO, 0.5 LCOM, and 0.44 SGM. These values are higher than the values of the microservice without combining any other operation to the microservice, and these values are different from the combination of other operations with the authentication microservice. Therefore, the fifth property is satisfied by all the metrics too.
Property 7 is not satisfied with the proposed metrics. Because this property is related to traditional software design methods, so it is not applicable in a microservices architecture. This exception has been found in other research papers [20, 33–36].
7 Conclusion
This research has created and developed a new set of software metrics for microservices architecture. It proposes software metrics to measure the granularity, cohesion, and complexity of individual microservices based on the application programming interface and evaluates different levels of granularity, cohesion, and complexity using a quantified scale. Using this quantification allows software developers to evaluate the overall quality metrics in microservices application. Also, the relations between the proposed metrics have been investigated and it was shown that there was a clear negative relationship between cohesion and complexity. Also, there is another relation between LCOM and SGM. It appears to be a negative relation. The granularity metric depends on the number of operations and the number of attributes in these operations as well as the type of these operations. The complexity of the microservices applications in this research paper depends on the number of operations per microservice. Finally, the proposed metrics were validated using Weyuker’s properties, which are well-known properties for validating software metrics in object-oriented programs but in this research paper these properties were modified to apply for microservices applications. The proposed metrics satisfied all the properties except the 7th property which could not be applied in a microservices environment.
In conclusion, it was defined that the value of the LCOM metric for a microservice needs to be between 0 and 0.8 with less than 10 operations per microservice. If the value of LCOM is higher than 0.8 and NOO value is higher than 10, this microservice needs to be decomposed into multiple microservices. Also, the value for SGM metric needs to be between 0.2 and 0.6, because we do not need too fine-grained or too coarse-grained microser-vices that leads to exhausting the resources of the system. Too fine-grained microservices can be identified when having a high value of NOO, usually higher than 10, and having a low value of SGM, usually lower than 0.2.
References
[1] R. Chen, S. Li, and Z. Li, ‘From Monolith to Microservices: A Dataflow-Driven Approach’, in 2017 24th Asia-Pacific Software Engineering Conference (APSEC), Dec. 2017, pp. 466–475, doi: 10.1109/APSEC.2017.53.
[2] P. D. Francesco, I. Malavolta, and P. Lago, ‘Research on Architecting Microservices: Trends, Focus, and Potential for Industrial Adoption’, in 2017 IEEE International Conference on Software Architecture (ICSA), Apr. 2017, pp. 21–30, doi: 10.1109/ICSA.2017.24.
[3] D. Kansal, T. Aher, and R. K. Joshi, ‘Sensitivity and Monotonicity in Class Cohesion Metrics’, in Proceedings of the 12th Innovations on Software Engineering Conference (formerly known as India Software Engineering Conference) – ISEC’19, Pune, India, 2019, pp. 1–5, doi: 10.1145/3299771.3299794.
[4] A. AbuHassan and M. Alshayeb, ‘A metrics suite for UML model stability’, Softw. Syst. Model., vol. 18, no. 1, pp. 557–583, Feb. 2019, doi: 10.1007/s10270-016-0573-6.
[5] S. Newman, Building microservices: designing fine-grained systems, First Edition. Beijing Sebastopol, CA: O’Reilly Media, 2015.
[6] D. Shadija, M. Rezai, and R. Hill, ‘Microservices: Granularity vs. Performance’, in Companion Proceedings of the10th International Conference on Utility and Cloud Computing - UCC ’17 Companion, Austin, Texas, USA, 2017, pp. 215–220, doi: 10.1145/3147234.3148093.
[7] N. Kaur, A. Negi, and H. Singh, ‘Object Oriented Dynamic Coupling and Cohesion Metrics: A Review’, in Proceedings of 2nd International Conference on Communication, Computing and Networking, 2019, pp. 861–869.
[8] M. Glöckner, A. Ludwig, and B. Franczyk, ‘How low Should You Go? – Conceptualization of the Service Granularity Framework’, in ECIS, 2016.
[9] M. P. Papazoglou and W.-J. V. D. Heuvel, ‘Service-Oriented Design and Development Methodology’, Int J Web Eng Technol, vol. 2, no. 4, pp. 412–442, Jul. 2006, doi: 10.1504/IJWET.2006.010423.
[10] J. Bogner, S. Wagner, and A. Zimmermann, ‘Automatically measuring the maintainability of service- and microservice-based systems: a literature review’, in Proceedings of the 27th International Workshop on Software Measurement and 12th International Conference on Software Process and Product Measurement on - IWSM Mensura ’17, Gothenburg, Sweden, 2017, pp. 107–115, doi: 10.1145/3143434.3143443.
[11] A. A. M. Elhag and R. Mohamad, ‘Metrics for evaluating the quality of service-oriented design’, in 2014 8th. Malaysian Software Engineering Conference (MySEC), Sep. 2014, pp. 154–159, doi: 10.1109/MySec.2014.6986006.
[12] M. Perepletchikov, C. Ryan, and K. Frampton, ‘Cohesion Metrics for Predicting Maintainability of Service-Oriented Software’, in Seventh International Conference on Quality Software (QSIC 2007), Oct. 2007, pp. 328–335, doi: 10.1109/QSIC.2007.4385516.
[13] L. C. Briand, S. Morasca, V. R. Basili, Inputr, E-E, and Outputr, ‘Property-based Software Engineering Measurement 2. Basic Definitions Definition 1: Representation of Systems and Modules’, 1996.
[14] D. Athanasopoulos, A. V. Zarras, G. Miskos, V. Issarny, and P. Vas-siliadis, ‘Cohesion-Driven Decomposition of Service Interfaces without Access to Source Code’, IEEE Trans. Serv. Comput., vol. 8, no. 4, pp. 550–562, Jul. 2015, doi: 10.1109/TSC.2014.2310195.
[15] B. Heinrich and S. Zimmermann, ‘GRANULARITY METRICS FOR IT SERVICES’, p. 19.
[16] S. Alahmari, E. Zaluska, and D. C. D. Roure, ‘A Metrics Framework for Evaluating SOA Service Granularity’, in 2011 IEEE International Conference on Services Computing, Jul. 2011, pp. 512–519, doi: 10.1109/SCC.2011.98.
[17] T. Gyimothy, R. Ferenc, and I. Siket, ‘Empirical validation of object-oriented metrics on open source software for fault prediction’, IEEE Trans. Softw. Eng., vol. 31, no. 10, pp. 897–910, Oct. 2005, doi: 10.1109/TSE.2005.112.
[18] K. E. Bennin, J. Keung, P. Phannachitta, A. Monden, and S. Mensah, ‘MAHAKIL: Diversity Based Oversampling Approach to Alleviate the Class Imbalance Issue in Software Defect Prediction’, IEEE Trans. Softw. Eng., vol. 44, no. 6, pp. 534–550, Jun. 2018, doi: 10.1109/TSE.2017.2731766.
[19] A. Ampatzoglou et al., ‘Applying the Single Responsibility Principle in Industry: Modularity Benefits and Trade-offs’, in Proceedings of the Evaluation and Assessment on Software Engineering - EASE ’19, Copenhagen, Denmark, 2019, pp. 347–352, doi: 10.1145/3319008.3320125.
[20] S. R. Chidamber and C. F. Kemerer, ‘A metrics suite for object oriented design’, IEEE Trans. Softw. Eng., vol. 20, no. 6, pp. 476–493, Jun. 1994, doi: 10.1109/32.295895.
[21] B. Henderson-Sellers, Object-oriented Metrics: Measures of Complexity. Upper Saddle River, NJ, USA: Prentice-Hall, Inc., 1996.
[22] J. L. Ordiales Coscia, M. Crasso, C. Mateos, and A. Zunino, ‘Estimating Web Service interface quality through conventional object-oriented metrics’, CLEI Electron. J., vol. 16, no. 1, Apr. 2013, doi: 10.19153/cleiej.16.1.4.
[23] D. Taibi and K. Systä, ‘From Monolithic Systems to Microservices: A Decomposition Framework based on Process Mining’:, in Proceedings of the 9th International Conference on Cloud Computing and Services Science, Heraklion, Crete, Greece, 2019, pp. 153–164, doi: 10.5220/0007755901530164.
[24] W. Jin, T. Liu, Q. Zheng, D. Cui, and Y. Cai, ‘Functionality-Oriented Microservice Extraction Based on Execution Trace Clustering’, in 2018 IEEE International Conference on Web Services (ICWS), Jul. 2018, pp. 211–218, doi: 10.1109/ICWS.2018.00034.
[25] N. A. V. Santos and A. R. Silva, ‘A Complexity Metric for Microservices Architecture Migration’, in 2020 IEEE International Conference on Software Architecture (ICSA), Mar. 2020, pp. 169–178.
[26] C. Richardson, ‘Multi-user Kanban board built using Eventuate, DDD, microservices, event sourcing, CQRS, and Spring Boot: eventuate-examples/es-kanban-board’, Jan. 25, 2019. https://github.com/eventuate-examples/es-kanban-board (accessed Jan. 25, 2019).
[27] C. Richardson, ‘Example code for my building and deploying microser-vices with event sourcing, CQRS and Docker presentation: cer/event-sourcing-examples’, Jan. 25, 2019. https://github.com/cer/event-sourcing-examples (accessed Jan. 25, 2019).
[28] C. Johnson, ‘Galileo’, ProgrammableWeb, Oct. 12, 2017. https://www.programmableweb.com/api/galileo-rest-api-v200 (accessed Dec. 29, 2019).
[29] ‘Get Started – PayPal Developer’. https://developer.paypal.com/docs/api/overview/ (accessed Jul. 26, 2019).[30] ‘Amazon API Gateway’, Amazon Web Services, Inc. https://aws.amazon.com/api-gateway/ (accessed Jul. 26, 2019).
[30] S. R. Chidamber and C. F. Kemerer, ‘Towards a metrics suite for object oriented design’, ACM SIGPLAN Not., vol. 26, no. 11, pp. 197–211, Nov. 1991, doi: 10.1145/118014.117970.
[31] K. P. Srinivasan and T. Devi, ‘Software Metrics Validation Methodologies in Software Engineering’, Int. J. Softw. Eng. Appl., vol. 5, no. 6, pp. 87–102, Nov. 2014, doi: 10.5121/ijsea.2014.5606.
[32] Y. Xiang, W. Pan, H. Jiang, Y. Zhu, and H. Li, ‘Measuring Software Modularity Based on Software Networks’, Entropy, vol. 21, no. 4, p. 344, Apr. 2019, doi: 10.3390/e21040344.
[33] W. Harrison, ‘An entropy-based measure of software complexity’, IEEE Trans. Softw. Eng., vol. 18, no. 11, pp. 1025–1029, Nov. 1992, doi: 10.1109/32.177371.
[34] Gursaran and G. Roy, ‘On the applicability of Weyuker Property 9 to object-oriented structural inheritance complexity metrics’, IEEE Trans. Softw. Eng., vol. 27, no. 4, pp. 381–384, Apr. 2001, doi: 10.1109/32.917526.
[35] J. C. Cherniavsky and C. H. Smith, ‘On Weyuker’s axioms for software complexity measures’, IEEE Trans. Softw. Eng., vol. 17, no. 6, pp. 636–638, Jun. 1991, doi: 10.1109/32.87287.
Biographies

O. Al-Debagy started pursuing his PhD degree in 2017 at Budapest University of Technology and Economics. He obtained his BSc in Information Technology from University of Kurdistan – Hewler in 2012. Then he got his MSc in Information Systems Engineering from Cyprus International University in 2015. He has an extended experience in web development and technologies. Also, he was an assistant lecturer at the Lebanese French University from 2015 until 2016. Furthermore, he worked as a web developer for USAID/Iraq Governance Strengthening Project from 2016 to 2017. Nowadays he is finishing his PhD research in microservices decomposition methods and techniques.

P. Martinek received his B.Sc, M.Sc. and PhD degrees in Computer Engineering from Budapest University of Technology and Economics, Hungary. Dr. Martinek is an associate professor at the Department of Electronics Technology at BME since 2012. He is the recipient of the 2010 IBM Faculty award. His main research area is Enterprise Application Integration (EAI), but he also studies production scheduling and optimization of manufacturing processes by machine learning methods.
Journal of Web Engineering, Vol. 19_3-4, 341–370.
doi: 10.13052/jwe1540-9589.19341
© 2020 River Publishers