Smart Grid Technology Acceptance Barriers: Indian Consumers Perspective
Archana
Indian Institute of Technology Delhi, India
E-mail: tulips_0005@yahoo.co.in
Received 24 February 2022; Accepted 26 July 2022; Publication 28 December 2022
Abstract
The several challenges confronted by the energy sector in India have impelled to adopt advanced technologies to make the grid more effective, sustainable, and secure. In this context, this study proposes a hierarchical model with identified barriers to smart grid acceptance by consumers in India. Seventeen barriers to consumers’ acceptance of smart grid technology were identified through a literature survey. Data were collected from 221 respondents through a questionnaire survey, and variables were measured on a 5-point Likert scale. EFA was used for data validation and extraction of the hidden construct. Six hidden constructs were identified, and a “hierarchical model” was developed by applying the Fuzzy-TISM methodology. The result highlights that barriers like lack of government policies and lack of public resources and monetary benefits are prominent factors that affect consumers’ involvement in the successful implementation of smart grid technology.
Keywords: Smart power grid, Fuzzy-TISM, exploratory factor analysis, power sector.
List of Abbreviations
| AT&D | Aggregate transmission and distribution loss |
| EFA | Exploratory Factor Analysis |
| GoI | Government of India |
| IoT | Internet of Things |
| ICT | Information and communication technology |
| ISGTF | India Smart Grid Task Force |
| MoP | Ministry of Power |
| NSGM | National Smart Grid Mission |
| T&D | Transmission and distribution |
| TAM | technology acceptance model |
| TISM | Total interpretive structural modelling |
| ISGF | India Smart Grid Forum |
| SCADA | Supervisory control and data acquisition |
1 Introduction
In the view of digitalisation and integration of information and communication systems with the electric grid, the smart grid has become the facilitator of an efficient, secure and sustainable electric system. The enhanced economic growth and rapid increase in population have fuelled the electric energy demand globally (Archana, 2022b). Fossil fuels which fulfil most of the world’s energy demand, are becoming limited (Büscher and Sumpf, 2015). With the rising cost of fossil fuels and ever-increasing pollution, governments across the globe are trying to expand their energy resources and strengthen their energy liberty by increasing the penetration of renewable energy (Archana, 2022a). Popular renewable sources like solar and wind energy are intermittent in nature, and the current operational electric grids are not fully equipped to control intermittency. On the other hand, the smart grid is integrated with various sensors, smart devices and energy storage systems that can handle intermittency better (Seung-Yoon and Calin, 2012). Equipped with various energy management tools, the smart grid enables the efficient use of electric energy and promotes energy-efficient behaviour among consumers (S.-H. Chen et al., 2012). In the last few years population in India, coupled with industrial development, has risen to electricity demand many folds. The T&D losses, frequent blackouts, market competition, etc., in India’s electrical industry, are enormous due to various inefficiencies and operational issues (Jadhav and Dharme, 2012). Therefore, there is an urgent need to modernise the transmission and distribution network of the electricity grid. A smart grid is an advanced electricity network equipped with communication systems that can monitor the flow of electricity from points of generation to points of consumption (Ponce et al., 2016). It can regulate power flow or reduce demand to match generation in real-time (Bhatt et al., 2021). It promises to transform the electric grid into a transparent, environmentally-friendly, and sustainable system.
Background and purpose of the study: Technology adoption is an emergent process which denotes the use of new technology in an environment. The change in a user’s attitude, perceptions, and behaviour that prompt them to attempt new practices or innovations is known as acceptance. Adoption, on the other hand, is the stage of the investigation, analysis, and decision-making for a new system. Firstly, barriers to accepting smart grids from a consumer’s perspective have been analysed. The analysis of these barriers gives useful insights into the adoption of a smart grid. The Fuzzy-TISM methodology provides inter-relationship amongst the barriers and presents a hierarchical model for “smart grid technology adoption”.
Despite numerous benefits and growing demand for renewable energy, the awareness about the smart grid in India is less, indicating significant resistance among consumers towards adopting smart grid technology. Many studies have indicated that the practical implementation of the new technology is challenging as it directly affects users’ behaviour (Archana, 2022c, 2022a). This calls for a study that could pave the way for developing a holistic typological framework explaining consumers’ adoption behaviour and risk management associated with smart grid technology (Milchram et al., 2018). The purpose of the current research is multi-fold:
• To understand the role of consumers in smart grid technology development.
• To discuss the key barriers to consumers’ adoption of smart grid technology in India.
• To determine inter-relationship amongst the barriers and propose a hierarchical model.
2 Methodology
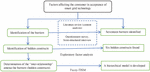
This section summarises the methodology adopted in the current study. The research methodology used in the current study is outlined in Figure 1.
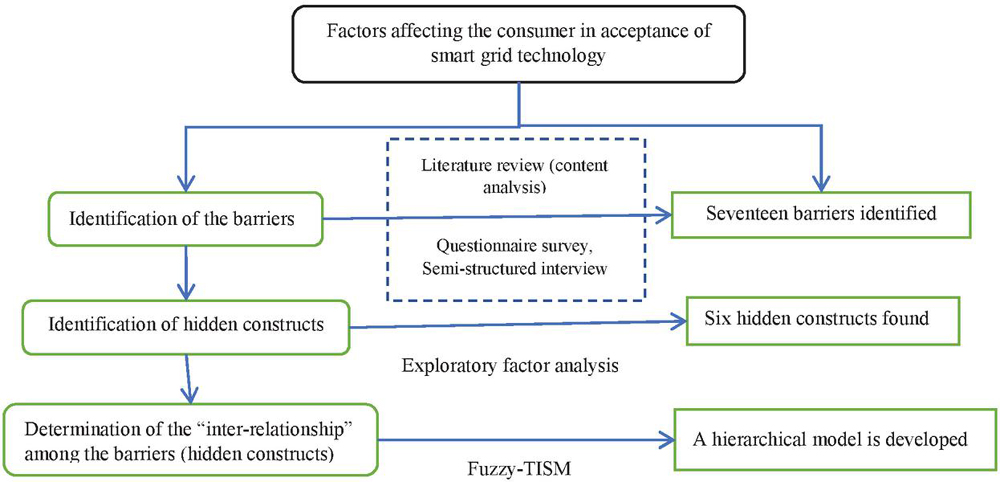
Figure 1 Systematic representation of the research methodology.
2.1 Identification of the Barriers
From the literature, “fifty barriers” were identified, which was later revised after a semi-structured interview with four experts working in the energy sector by Archana (2022). The list was modified in this work as few barriers seemed to be less significant in the course of time. Table 1 presents the list of 17 barriers which were selected for further study.
Table 1 List smart grid technology acceptance barriers in India
| Barrier Code | Variables |
| V1 | “Lack of knowledge about smart grid benefit” |
| V2 | “Lack of support for open standards” |
| V3 | “Long payback period” |
| V4 | “Comfort reduction due to consumption shifting or demand side management” |
| V5 | “Fear of increase in price” |
| V6 | “Lack of appropriate awareness among stakeholders” |
| V7 | “Unaware of environmental issues.” |
| V8 | “Vulnerable to cyber-attacks.” |
| V9 | “Health risk due to electromagnetic radiation” |
| V10 | “Lack of environmental credits” |
| V11 | “High investment and maintenance cost” |
| V12 | “Negative effect of dynamic pricing” |
| V13 | “Shorter lifetime of smart appliances” |
| V14 | “Lack of stakeholder’s involvement and support” |
| V15 | “High replacement cost” |
| V16 | “Inadequate government policies and support” |
| V17 | “Lack of participation from lower-income groups and people with less affinity for computer and IT systems” |
2.2 Questionnaire Development
The questionnaire comprised of four major sections was developed for data collection. The purpose of the questionnaire and a short description of the topic were described in the first section. In the second section, respondents’ general information, while the third section dwells upon about the seventeen barriers on a 5-point Likert scale (where 1 and 5 were coded as?” unimportant” and “extremely important”, respectively). The fourth section was used to get users’ suggestions and comments.
2.3 Data Collection
The study was performed by renowned academics and corporate leaders in the energy sector. The questionnaire was distributed to 245 experts in the smart grid domain from academia, industry, and the government. After deleting the partial responses, 221 responses were found to be full and were analysed further. There were 147 industrial representatives, 38 government officials, and 36 academicians out of 221 responders. The rule of thumb states that the sample size should be at least five times the total number of variables (Shaukat et al., 2016) or a minimum hundred (Hair et al., 1995). So, a sample size of 221 seems appropriate for further analysis.
3 Data Analysis and Interpretation
3.1 EFA Analysis
Exploratory factor analysis (EFA) is a statistical approach used to determine the latent relationship between the variables under consideration (DeCoster, 1998). EFA was applied to the seventeen-variable dataset using IBM SPSS 23.0. Before applying EFA, data were checked for: sample adequacy (estimated from the KMO value, ideal 0.6–0.7), inter-correlation among variables (Bartlett’s test of sphericity), significance level (p 0.05), Chi-Square value, and Cronbach’s alpha value (0.7) (Hair et al., 1995; Tabachnick and Fidell, 2001). Table 2 depicts the results. All variables have a commonality value larger than 0.5. Hence all items are accurately reflected by extracted components. Principal component analysis (PCA) with varimax rotation was used, which resulted in six constructs. These six hidden factors were labelled as “Lack of consumer’s knowledge and awareness about smart grid technology”, “Risk associated with smart grid technology”, “Lack of public resources and motivation for monetary saving”, and “Lack of consumer’s environmental concern”, “Lack of government policies and support” and “Consumer’s non-willingness to change” (refer to Table 3, these hidden constructs represent the similar barriers grouped together).
Table 2 Data reliability test
| Kaiser-Meyer-Olkin Measure of Sampling Adequacy | 0.735 | |
| Bartlett’s Test of Sphericity | Approx. Chi-Square | 5064.229 |
| Df | 136 | |
| Sig. | 0.000 | |
| Reliability Statistics | Cronbach’s Alpha | 0.835 |
Table 3 List of barriers to smart grid technology acceptance in India
| Sr. No. | Barrier Code | Barrier |
| 1. | E1 | “Lack of consumer’s knowledge and awareness about smart grid technology” |
| 2. | E2 | “Risk associated with smart grid technology” |
| 3. | E3 | “Lack of public resources and motivation for monetary saving.” |
| 4. | E4 | “Lack of consumer’s environmental concern” |
| 5. | E5 | “Lack of government policies and regulations” |
| 6. | E6 | “Consumers’ non-willingness to change.” |
These barriers are discussed below:
1. “Lack of consumer knowledge and awareness about smart grid technology”: Cconsumer’s play an active role in smart grid (Wolsink, 2012). With a smart meter, they can know their real-time energy consumption (Büscher and Sumpf, 2015), which helps identify their energy usage behaviour (Shalu Agrawal et al., 2020). Consumers can help manage energy by reducing electricity usage during peak usage times (Radenkoviæ et al., 2020). Also, consumers of smart grid technology are not only the end-users but also the producers of renewable energy (Ponce et al., 2016). The extra power generated from renewable sources like rooftop photovoltaic cells, wind turbines, or pumped hydroelectric power can be fed back to the grid. This feature makes consumers an important stakeholder called ‘prosumers’ (Good et al., 2017), which will play an important role in driving the electricity market. Pilot projects show that a larger segment of Indians, especially the lower-income consumers, are still unaware of the smart grid technology and its various programs (NSGM, 2019). Hence, making people aware is essential for smart grid technology’s success.
2. “Risk associated with smart grid technology”: Smart grid consists of various software, hardware and communication technologies like advanced metering infrastructure, SCADA system, geographical information system, energy storage system, outage management system, power quality management system, wide-area monitoring system etc. (El-Hawary, 2014). With the integration of smart devices, a large amount of data is generated, which (Guo et al., 2015) has created a threat among consumers to any cyber-attack. Also, personal data may be used to get insight into activities in a household that are considered private. Hence it is necessary to protect the consumer’s data from unauthorised use (Delgado-Gomes et al., 2015). Besides, several consumers and health practitioners have raised concerns about the consumers’ health risks due to the emission of electromagnetic radiation from the smart meter. According to the American cancer society, the risk of cancer or other health issues is extremely low, but systematic research is needed (Guo et al., 2015). Such issues may create panic amongst consumers, leading to resistance to smart grid technology (Büscher and Sumpf, 2015).
3. “Lack of government policies and regulations”: Complexity in the smart grid coupled with the absence of proper regulatory structure in India, few pilot projects were cancelled, and few were delayed. The implementing agencies also faced a few challenges while executing the pilot projects. Issues like lack of clarity of the funding sources, lack of service providers, lack of skilled workforce, lack of interoperability etc., were also observed (NSGM, 2019). The electricity sector is highly regulated by the government. Hence, the government holds considerable responsibility for successfully implementing the smart grid. The government, in association with the industry, can tackle the various challenges and provide customer support.
4. “Lack of consumer’s environmental concerns”: Last few decades have witnessed environmental disasters like acidic rain, pollution, ozone layer depletion, and issues related to global warming (Hille et al., 2020). The use of fossil fuels is one of the primary causes of air pollution. Due to the burning of coal and fossil fuel, gases like sulphur dioxide, nitrogen oxide, and nitrogen dioxide are also produced, which causes the greenhouse effect, acidic rain, smog etc. (Colak et al., 2016). Though there are laws for pollution control, they have not been proved effective due to improper enforcement and a lack of consumer awareness about the environmental problem (Kumar. J and Majid, 2020). Also, there is a lack of incentives to evoke a positive behavioural change.
5. “Lack of public resources and motivation for monetary saving”: Economic benefit plays a vital role in the implementation and success of any technology. High initial investment poses a major concern for Indian consumers. Hence significant investment from the government is essential as government policies and regulatory reforms dominate the electricity industry. The smart meter is the most important component that the government has promoted with the intent to lower the electricity bill. But smart meters are costly, and the lack of a uniform standard for the smart meter was also observed during pilot project implementation (NSGM, 2019). Developed nations already have a reliable infrastructure; therefore, they are further working on smart metering, renewable generation, and forecasting tools. However, developing countries like India with poor infrastructure must simultaneously strengthen electricity networks and build additional layers of ICT development to make the grid smarter. Though the government is financing the development of smart grids, it is also responsible for providing a stable and transparent environment.
6. “Consumers’ non-willingness to change”: Participation in various demand response programs offers various incentives and flexible pricing (Radenkoviæ et al., 2020). The advantages due to the smart grid implementation come after a prolonged time, so many end-users are reluctant to change their electricity behaviour and go for dynamic pricing and integration of renewable (Li et al., 2017). Also, aged people, patients and consumers with less affinity for computers choose flat pricing.
3.2 Fuzzy Total Interpretive Structural Modelling (Fuzzy-TISM)
“TISM” is a qualitative modelling technique that (Nasim, 2011; Sushil, 2012) gives direct as well as transitive relations and gives an in-depth understanding (Sushil, 2012; Sushil, 2014). This technique has been applied in different fields like the healthcare sector (V. et al., 2019), manufacturing system (Sindhwani and Malhotra, 2017), and education sector (Prasad and Suri, 2011), market management (Hasan et al., 2019) etc. Fuzzy TISM is an extension of TISM. Integration of fuzzy sets helps in understanding the level of influences of one variable over other, which was analysed in binary form earlier. As customer behaviour is difficult to express in binary form, the use of fuzzy theory provides wider flexibility. In fuzzification, the crisp value is transformed into linguistic variables. The linguistic values are based on the fuzzy triangular numbers for the linguistic variables. They are categorised into five linguistic variables: ’ Very Low’, ‘Low’, ‘Medium’, ‘High’ and ‘Very High’. The linguistic terms with fuzzy notations are shown in Table 4.
Table 4 Linguistic terms with fuzzy values and notations
| Linguistic Terms | Consequence | Notations | Membership Functions |
| Very Low | Very unlikely | V.L. | (0.0,0.0,0.25) |
| Low | Unlikely | L. | (0.0,0.25,0.5) |
| Medium | Medium | M. | (0.25,0.5,0.75) |
| High | Likely | H. | (0.5,0.75,1.0) |
| Very High | Very likely | V.H. | (0.75,1.0,1.0) |
3.3 Steps of Fuzzy-TISM Methodology
Step 1: “Find the variables in the area of research”.
Step 2: “Express the contextual relationship between the identified variables”.
Step 3: “Create a structural Self Interaction Matrix (SSIM) based on expert opinion”.
Step 4: “Aggregate SSIM by considering the mode operation on various responses”.
Step 5: “Calculate the final fuzzy reachability matrix”.
The final fuzzy reachability matrix is represented as
| (1) |
Step 6: “Assessment of driving and dependence power of various variables”.
Step 7: “Level partitioning from reachability matrix”.
Step 8: “Create TISM digraph and defuzzified TISM model”.
3.4 Fuzzy-TISM Model
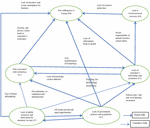
Using the “Fuzzy-TISM” methodology, the present work has created a hierarchical model containing the six identified barriers. The contextual relationship between the variables in this study is “variable A enhances/influences variable B”. “Structural self-interaction matrix” is prepared based on expert opinions. Further, “aggregated fuzzy SSIM”, “fuzzy reachability matrix”, “final fuzzy reachability matrix”, “structural self-interaction matrix”, and “transitivity in SSIM” are calculated. “Defuzzified reachability matrix” is generated based on the aggregated fuzzy reachability matrix. To prepare the “defuzzified reachability matrix”, linguistic terms such as “Very High”, “High”, and “Medium” are assigned as ‘1’, and the variables with “Low”, “Very Low”, and “No Effect” linguistic terms are assigned as ‘0’. After that, level partitioning is performed, which gives four levels. Subsequently, a digraph is made using the “final reachability matrix”, and finally, the Fuzzy-TISM model is developed (Figure 2), which is constructed based on an interaction matrix. In this model, only important links are displayed.
4 Discussion
The developed “Fuzzy-TISM model” is an extended work which was initially analysed by (Archana, 2022c) where the author applied “TISM methodology” and also performed “MICMAC analysis”. In the year 2020, the impact of the Covid-19 pandemic was significant as it was a total shutdown, and many projects were affected a lot. When unlock started, there were restrictions, but work on different projects again started with time. Visualising this, some of the barriers from the list were modified by taking expert opinion. Another modification was the use of fuzzy-TISM methodology, an advanced version of TISM. The use of fuzzy numbers gives flexibility to the experts in giving their opinion. The modified list provides more hidden constructs and divides them in a better way. The “fuzzy-TISM-based model” indicated that barriers to “Consumer’s non-willingness to change (E6)” and “Lack of consumer’s environmental concern (E4)” are at the top level of the TISM model (see Figure 2), i.e., at level 1, which means they have the highest dependence power. According to numerous technology acceptance theories, the intention to accept and embrace technology is the result of a user’s attitude, which is influenced by their personal characteristics and the knowledge they gain from their community (Ajzen, 1991; Davis, 1985, 1989; Huijts et al., 2012). “Consumer’s non-willingness to change (E6)” is influenced directly by “Lack of consumers knowledge and awareness (E1)”, “Risk associated with smart grid technology (E2)”, “Lack of public resources and motivation for monetary saving (E3)”, “Lack of consumer’s environmental concern (E4)”, and “Lack of government policies and regulations (E5)”. This model helps to validate the TAM in a better way as barriers in level one E6 and E4 denote the intention, E3 and E5 are external factors, E2 is related to “perceived usefulness”, and E1 is related to “perceived ease of use”. The use of fuzzy-TISM makes the hierarchy clear to compare with TAM as compared to previous work (Archana, 2022c). Also, the fuzzy-TISM model has been developed among the latent factors which makes the model simpler and easy to understand.
These factors explain that technology, government policies, and consumer awareness are important factors in forming consumers’ favourable attitudes and intention to adopt new technology. Hence, the government needs to formulate policies with an aim to reach the general consumers and understand their concerns/inhibitions with respect to smart grid technology. This will enable the government not only to understand the real issues behind such a low adoption rate of smart grid technology in India but also to develop marketing strategies to percolate into the masses and alleviate their inhibitions. Barriers “Lack of public resources and motivation for monetary saving (E3)” and “Lack of government policies and regulations (E5)” were found to have the lowest dependence power and maximum driving power and are placed at the lowest level of the model. These barriers serve as a driving force and significantly influence all other factors in adopting new technology.
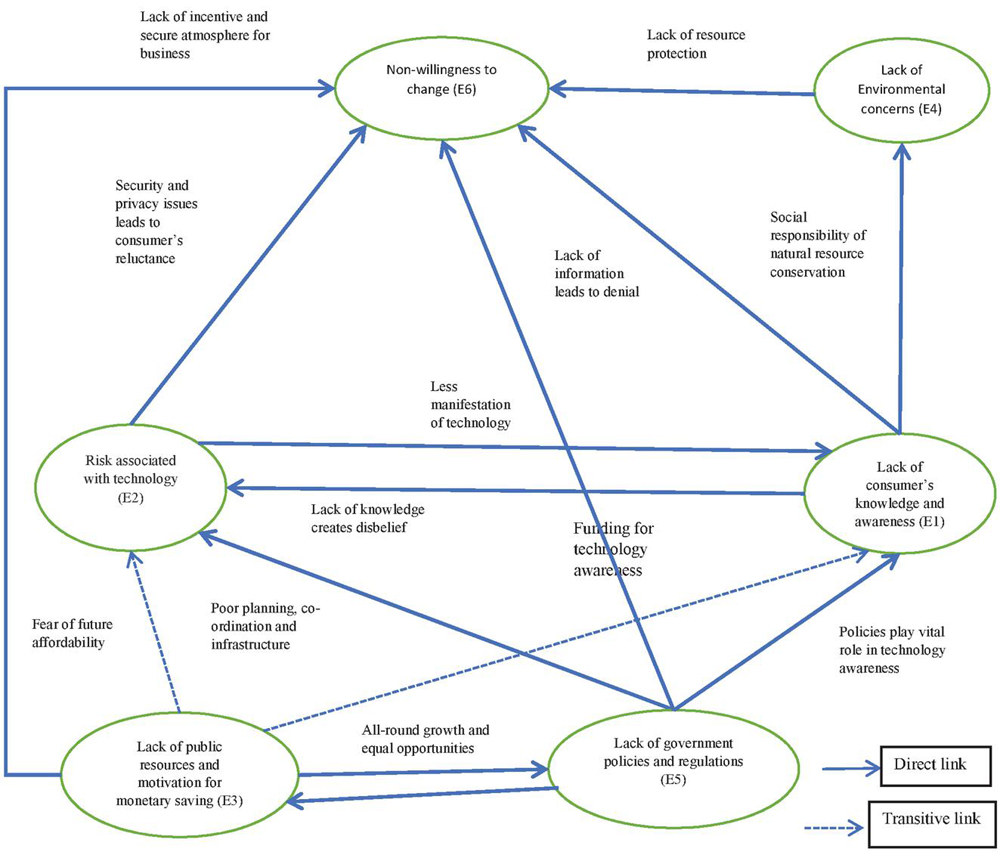
Figure 2 Fussy-TISM based hierarchical model.
Smart power grid technology needs more research to lower the risk due to high investment, dynamic pricing, health issues due to smart meter radiation, cybersecurity, data privacy etc. Dynamic pricing results in rescheduling of work, which consumers do not like, particularly the elderly and the sick. Consumers are also concerned about the health impact due to electromagnetic radiation from the smart meter. Though people use mobile phones and wi-fi, which has emf radiation, they still fear smart meters due to continuous radiation. Another indirect risk associated with smart grid technology is “data privacy” and “cybersecurity” issues. Smart grid systems need to be secured to prevent malicious attacks and unauthorised access to consumers’ personal data. As consumers’ data reveal important information about their behaviour, it is essential to secure the system. The Integration of ICT has made the grid vulnerable to cyber-attacks, which can cause issues like instability in the network or hacking the network.
5 Managerial Implications
This research focuses on investigations of significant barriers related to smart grid technology implementation and presents many management inputs in the energy sector. It primarily helps executives and officials in planning for the successful implementation of smart grid technology at the individual level. Firstly, this discussion will persuade and inspire the researchers to work in a similar domain and eventually attract an extensive consumer base. Secondly, open standards policies will assist in technological innovations and increase performance and efficiency. Also, training and awareness programs are necessary to educate the consumers and concerned public servants about various smart grid programs and their benefits (NSGM, 2018). Third, executives can make emphasis barriers like “high cost for smart appliances”, “negative effect of dynamic pricing”, “health issues due to emf radiation”, and “fear of future affordability”, which is prominently affecting consumer acceptance. Fourth, though the data transfer from smart meters takes place with encrypted protocols, they have not been tested properly (Jokar et al., 2016). Hence, managers and the government need to ensure the security of the data. Fifth, the introduction of dynamic pricing has also affected the consumer’s daily routine as they need to reschedule their work (Wolsink, 2012). Hence it is required to develop a proper dynamic pricing model. Lastly, many issues were observed during the implementation of smart grid pilot projects, such as the problem of increased bills (NSGM, 2018), creating a fear amongst consumers that utilities can have more control over electricity usage due to smart devices. Addressing such issues through consumer engagement programs would be crucial for a smooth implementation of smart metering infrastructure in the country.
6 Conclusions and Limitations
The present work has discussed and presented the key barriers which can affect the acceptance of smart grids in India extensively. The fuzzy-TISM methodology has been used on the six latent factors derived from EFA to know the inter-relationships among the barriers, and a hierarchical model was proposed. This work is an extension of previous work, and the use of fuzzy logic and modelling latent factors made the model simpler. Also, the proposed model was verified by a panel of experts working in the power sector. This work highlights the importance of further research on consumer behaviour. With the involvement of consumers in the energy sector, they need to be aware of the different programs and benefits of smart grid technology. The developed TISM model also brings out the need for government policies and stakeholders’ support for the success of the smart grid technology. This study was limited to barrier identification, which was considered important from the customer perspective and ignored barriers faced by industries and government institutions.
Funding Information
This research did not receive any specific grant from the funding agencies in the public, commercial, or not-for-profit sectors.
Conflict of Interest
None.
Appendix
Appendix A
Table A: Sample questionnaire
| Code | Barriers | Degree of Relative Importance | ||||
| 1 | 2 | 3 | 4 | 5 | ||
| B1 | Inadequate government policies and support | |||||
| B2 | High replacement cost | |||||
| B16 | Lack of inclusiveness | |||||
| B17 | Jurisdictional issues | |||||
Table B: Sample data collected by questionnaire survey
| Variables | 1 | 2 | 3 | 4 | 15 | 16 | 17 | ||
| Respondents | |||||||||
| 1 | 3 | 1 | 3 | 2 | 1 | 4 | 2 | 1 | 3 |
| 2 | 2 | 1 | 2 | 3 | 2 | 4 | 2 | 3 | 4 |
| 3 | 4 | 3 | 1 | 3 | 2 | 3 | 1 | 3 | 3 |
| 4 | 3 | 2 | 3 | 3 | 2 | 3 | 3 | 2 | 2 |
| 4 | 4 | 1 | 2 | 2 | 4 | 3 | 4 | 4 | |
| 210 | 3 | 3 | 2 | 4 | 3 | 1 | 3 | 1 | 5 |
| 211 | 1 | 4 | 2 | 3 | 2 | 1 | 2 | 4 | 3 |
Appendix B
Table C: Result of EFA for seventeen variables
| Cumulative | |||||||
| Sr. | Barrier | Factor | Cronbach’s | Percentage | Factor | ||
| No. | Code | Variables | Loading | s Alpha | Eigenvalue | of Variance | Name |
| 1. | V1 | “Lack of knowledge about smart grid benefit” | 0.898 | 0.967 | 5.474 | 22.169 | Lack of consumer’s knowledge and awareness about smart grid technology |
| 2. | V5 | “Fear of increase in price” | 0.947 | ||||
| 3. | V6 | “Lack of appropriate awareness among stakeholders” | 0.953 | ||||
| 4. | V17 | “Lack of participation from lower income group and people with less affinity for computer and IT systems” | 0.896 | ||||
| 5. | V8 | “Vulnerable to cyber attacks” | 0.910 | 0.948 | 3.561 | 42.584 | Risk associated with smart grid technology |
| 6. | V9 | “Health risk due to electromagnetic radiation” | 0.950 | ||||
| 7. | V13 | “Shorter lifetime of smart appliances” | 0.903 | ||||
| 8. | V12 | “Negative effect of dynamic pricing” | 0.946 | ||||
| 9. | V2 | “Lack of supports for open standards” | 0.965 | 0.914 | 2.498 | 57.818 | Lack of public resources and motivation for monetary saving |
| 10. | V11 | “High investment and maintenance cost” | 0.964 | ||||
| 11. | V15 | “High replacement cost” | 0.830 | ||||
| 12. | V7 | “Unaware of environmental issues” | 0.936 | 0.948 | 1.615 | 69.464 | Lack of consumer’s environmental concern |
| 13. | V10 | “Lack of environmental credits” | 0.931 | ||||
| 14. | V16 | “Inadequate government policies and support” | 0.856 | 0.931 | 1.205 | 80.005 | Lack of government policies and regulations |
| 15. | V14 | “Lack of stakeholder’s involvement and support” | 0.920 | ||||
| 16. | V4 | “Comfort reduction due to consumption shifting or demand side management” | 0.921 | 0.859 | 1.014 | 90.395 | Consumer’s non-willingness to change |
| 17. | V3 | “Long payback period” | 0.870 |
Appendix C
Structural self-interaction matrix
The contextual relationship between two sub-variables, i and j, are represented by four alphabets, ‘V’, ‘A’, ‘X’, ‘O’ (Sushil, 2012). They are represented as follows:
V – variable i leads to variable j.
A – variable j leads to the variable i.
X – variable i and variable j both leads to each other.
O – variables i and j are unrelated.
The four scenarios that arise out of the above concept are given as:
If the (i, j) entry in the SSIM is a V, the (i, j) entry in the reachability matrix becomes 1, and the (j, i) entry becomes 0.
If the (i, j) entry in the SSIM is an A, the (i, j) entry in the reachability matrix becomes 0, and the (j, i) entry becomes 1.
If the (i, j) entry in the SSIM is an X, both the (i, j) entry and the (j, i) entry of the reachability matrix become 1.
If the (i, j) entry of the SSIM is an O, then both the (i, j) and (j, i) entries of the reachability matrix become 0.
This relationship is shown in Table D.
Table D: Symbols for analysis of relationship in SSIM
| Notations | (i, j) | (j, i) |
| V | 1 | 0 |
| A | 0 | 1 |
| X | 1 | 1 |
| O | 0 | 0 |
These relationships are obtained from experts. The SSIM format is translated to reachability matrix by transforming the information in each entry of SSIM by ‘0’ and ‘1’. In fuzzy representation, assessments are linguistic values that are based on triangular fuzzy numbers for linguistic variables. So if the entry (i, j) in SSIM is V(H), then it is denoted as (0.5, 0.75, 1), and the entry (j, i) is denoted as (0, 0, 0.25), which are the fuzzy representations. All the fuzzy triangular linguistic terms for the final reachability matrix are shown in Table E.
Table E: Fuzzy triangular linguistic terms for final reachability matrix
| Notations in SSIM | Entry (i,j) | Entry (j,i) |
| V (VH) | (0.75, 1.0, 1.0) | (0, 0, 0.25) |
| V (H) | (0.5, 0.75, 1.0) | (0, 0, 0.25) |
| V (L) | (0.25, 0.5, 0.75) | (0, 0, 0.25) |
| V (VL) | (0, 0.25, 0.5) | (0, 0, 0.25) |
| A (VH) | (0, 0, 0.25) | (0.75, 1, 1) |
| A (H) | (0, 0, 0.25) | (0.5, 0.75, 1) |
| A (L) | (0, 0, 0.25) | (0.25, 0.5, 0.75) |
| A (VL) | (0, 0, 0.25) | (0, 0,.25, 0.5 |
| X (VH) | (0.75, 1, 1) | (0.75, 1, 1) |
| X (H) | (0.5, 0.75, 1) | (0.5, 0.75, 1) |
| X (L) | (0.25, 0.5, 0.75) | (0.25, 0.5, 0.75) |
| X (VL) | (0, 0.25, 0.5) | (0, 0.25, 0.5) |
| X (VH, H) | (0.75, 1, 1) | (0.5, 0.75, 1) |
| X (VH, L) | (0.75, 1, 1) | (0.25, 0.5, 0.75) |
| X (VH, VL) | (0.75, 1, 1) | (0, 0.25, 0.5) |
| X (H, VH) | (0.5, 0.75, 1) | (0.75, 1, 1) |
| X (H, L) | (0.5, 0.75, 1) | (0.25, 0.5, 0.75) |
| X (H, VL) | (0.5, 0.75, 1) | (0, 0.25, 0.5) |
| X (L, VH) | (0.25, 0.5, 0.75) | (0.75, 1, 1) |
| X (L, H) | (0.25, 0.5, 0.75) | (0.5, 0.75, 1) |
| X (L, VL) | (0.25, 0.5, 0.75) | (0, 0.25, 0.5) |
| X (VL, VH) | (0, 0.25, 0.5) | (0.75, 1, 1) |
| X (VL, H) | (0, 0.25, 0.5) | (0.5, 0.75, 1) |
| X (VL, L) | (0, 0.25, 0.5) | (0.25, 0.5, 0.75) |
| O (NO) | (0, 0, 0.25) | (0, 0, 0.25) |
References
Agrawal, S., Mani, S., Karthik, G., and Jain, A. (2020). What Smart Meters Can Tell Us Insights on Electricty Supply and Use in Mathura and Bareilly Households. February, 1–78.
Ajzen, I. (1991). The theory of planned behavior. Organizational Behavior and Human Decision Processes, 50(2), 179–211. https://doi.org/https://doi.org/10.1016/0749-5978(91)90020-T
Archana. (2022a). Customer acceptance of smart grid technology: a bibliometric literature review. International Journal of Productivity and Quality Management. https://doi.org/10.1504/IJPQM.2021.10046414
Archana. (2022b). Fuzzy cognitive map based modelling for smart grid implementation in India. International Journal of Services and Operations Management. https://doi.org/10.1504/IJSOM.2022.10047102
Archana. (2022c). Modelling Barriers for Smart Grid Technology Acceptance in India. Process Integration and Optimization for Sustainability. https://doi.org/10.1007/s41660-022-00255-1
Bhatt, J., Jani, O., and Harish, V. (2021). Optimal Wireless Technology Selection Approach for Sustainable Indian Smart Grid. Strategic Planning for Energy and the Environment, 255–278.
Büscher, C., and Sumpf, P. (2015). “Trust” and “confidence” as socio-technical problems in the transformation of energy systems. Energy, Sustainability and Society, 5(1), 1–13. https://doi.org/10.1186/s13705-015-0063-7
Chen, S.-H., Huang, M.-H., Chen, D.-Z., and Lin, S.-Z. (2012). Detecting the temporal gaps of technology fronts: A case study of smart grid field. Technological Forecasting and Social Change, 79(9), 1705–1719. https://doi.org/https://doi.org/10.1016/j.techfore.2012.06.005
Chen, Z., Wu, L., and Fu, Y. (2012). Real-Time Price-Based Demand Response Management for Residential Appliances via Stochastic Optimization and Robust Optimization. IEEE Transactions on Smart Grid, 3(4), 1822–1831. https://doi.org/10.1109/TSG.2012.2212729
Colak, I., Sagiroglu, S., Fulli, G., Yesilbudak, M., and Covrig, C.-F. (2016). A survey on the critical issues in smart grid technologies. Renewable and Sustainable Energy Reviews, 54, 396–405. https://doi.org/10.1016/j.rser.2015.10.036
Davis, F. D. (1985). A technology acceptance model for empirically testing new end-user information systems: Theory and results. Massachusetts Institute of Technology.
Davis, F. D. (1989). Perceived usefulness, perceived ease of use, and user acceptance of information technology. MIS Quarterly, 319–340.
DeCoster, J. (1998). Overview of Factor Analysis. http://www.stat-help.com/notes.html\%0D
Delgado-Gomes, V., Martins, J. F., Lima, C., and Borza, P. N. (2015). Smart grid security issues. 2015 9th International Conference on Compatibility and Power Electronics (CPE), 534–538. https://doi.org/10.1109/CPE.2015.7231132
Dhir, S., Rajan, R., Ongsakul, V., Owusu, R. A., and Ahmed, Z. U. (2021). Critical success factors determining performance of cross-border acquisition: Evidence from the African telecom market. Thunderbird International Business Review, 63(1), 43–61. https://doi.org/https://doi.org/10.1002/tie.22156
El-Hawary, M. E. (2014). The smart grid - State-of-the-art and future trends. Electric Power Components and Systems, 42(3–4), 239–250. https://doi.org/10.1080/15325008.2013.868558
Good, N., Martínez Ceseña, E. A., and Mancarella, P. (2017). Ten questions concerning smart districts. Building and Environment, 118, 362–376. https://doi.org/10.1016/j.buildenv.2017.03.037
Guo, C., Bond, C. A., and Narayanan, A. (2015). The adoption of new smart-grid technologies: incentives, outcomes, and opportunities. Rand Corporation.
Hair, J. F., Anderson, R. E., Tatham, R. L., and Black, W. C. (1995). Multivariate data analysis New York. NY: Macmillan.
Hasan, Z., Dhir, S., and Dhir, S. (2019). Modified total interpretive structural modelling (TISM) of asymmetric motives and its drivers in Indian bilateral CBJV. Benchmarking: An International Journal, 26(2), 614–637. https://doi.org/10.1108/BIJ-01-2018-0020
Hille, E., Althammer, W., and Diederich, H. (2020). Environmental regulation and innovation in renewable energy technologies: Does the policy instrument matter? Technological Forecasting and Social Change, 153, 119921. https://doi.org/https://doi.org/10.1016/j.techfore.2020.119921
Huijts, N. M. A., Molin, E. J. E., and Steg, L. (2012). Psychological factors influencing sustainable energy technology acceptance: A review-based comprehensive framework. Renewable and Sustainable Energy Reviews, 16(1), 525–531.
Jadhav, G. N., and Dharme, A. A. (2012). Technical challenges for development of smart grid in India. IEEE-International Conference On Advances In Engineering, Science And Management (ICAESM-2012), 784–788.
Julsrud, D. T. E., and Krogstad, D. J. R. (2020). Is there enough trust for the smart city? exploring acceptance for use of mobile phone data in oslo and tallinn. Technological Forecasting and Social Change, 161, 120314. https://doi.org/https://doi.org/10.1016/j.techfore.2020.120314
Kumar. J, C. R., and Majid, M. A. (2020). Renewable energy for sustainable development in India: current status, future prospects, challenges, employment, and investment opportunities. Energy, Sustainability and Society, 10(1), 2. https://doi.org/10.1186/s13705-019-0232-1
Li, R., Dane, G., Finck, C., and Zeiler, W. (2017). Are building users prepared for energy flexible buildings? – A large-scale survey in the Netherlands. Applied Energy, 203, 623–634. https://doi.org/10.1016/j.apenergy.2017.06.067
Milchram, C., Van de Kaa, G., Doorn, N., and Künneke, R. (2018). Moral values as factors for social acceptance of smart grid technologies. Sustainability, 10(8), 2703.
Nasim, S. (2011). Total Interpretive Structural Modeling of Continuity and Change Forces in e-Government. Journal of Enterprise Transformation, 1(2), 147–168. https://doi.org/10.1080/19488289.2011.579229
Netemeyer, R. G., Bearden, W. O., and Sharma, S. (2003). Scaling procedures: Issues and applications. Sage Publications.
NSGM. (2019). Impact Assessment of Smart Grid Pilot Projects Deployed in India.
Perri, C., Giglio, C., and Corvello, V. (2020). Smart users for smart technologies: Investigating the intention to adopt smart energy consumption behaviors. Technological Forecasting and Social Change, 155, 119991. https://doi.org/https://doi.org/10.1016/j.techfore.2020.119991
Ponce, P., Polasko, K., and Molina, A. (2016). End user perceptions toward smart grid technology: Acceptance, adoption, risks, and trust. Renewable and Sustainable Energy Reviews, 60, 587–598. https://doi.org/10.1016/j.rser.2016.01.101
Prasad, U. C., and Suri, R. K. (2011). Modeling of Continuity and Change Forces in Private Higher Technical Education Using Total Interpretive Structural Modeling (TISM). Global Journal of Flexible Systems Management, 12(3), 31–39. https://doi.org/10.1007/BF03396605
Radenković, M., Bogdanoviæ, Z., Despotović-Zrakić, M., Labus, A., and Lazareviæ, S. (2020). Assessing consumer readiness for participation in IoT-based demand response business models. Technological Forecasting and Social Change, 150, 119715. https://doi.org/https://doi.org/10.1016/j.techfore.2019.119715
Seung-Yoon, L., and Calin, I. (2012). Letter from the Chair About the Global Smart Grid Federation. 43. https://www.smartgrid.gov/files/Global\_Smart\_Grid\_Federation\_Report.pdf
Shaukat, S. S., Rao, T. A., and Khan, M. A. (2016). Impact of sample size on principal component analysis ordination of an environmental data set: effects on eigenstructure. Ekológia (Bratislava), 35(2), 173–190.
Sindhwani, R., and Malhotra, V. (2017). A framework to enhance agile manufacturing system. Benchmarking: An International Journal, 24(2), 467–487. https://doi.org/10.1108/BIJ-09-2015-0092
Sushil. (2012). Interpreting the interpretive structural model. Global Journal of Flexible Systems Management, 13(2), 87–106.
Sushil, P. (2014). Managing Wastivity for Sustainability. Global Journal of Flexible Systems Management, 16, 1–2. https://doi.org/10.1007/s40171-014-0086-5
Tabachnick, B. G., and Fidell, L. S. (2001). Principal components and factor analysis. Using Multivariate Statistics, 4(1), 582–633.
Taber, K. S. (2018). The Use of Cronbach’s Alpha When Developing and Reporting Research Instruments in Science Education. Research in Science Education, 48(6), 1273–1296. https://doi.org/10.1007/s11165-016-9602-2
V., V., M., S., and Dutta, P. (2019). Modelling the readiness factors for agility in healthcare organization: a TISM approach. Benchmarking: An International Journal, 26(7), 2372–2400. https://doi.org/10.1108/BIJ-06-2018-0172
Wolsink, M. (2012). The research agenda on social acceptance of distributed generation in smart grids: Renewable as common pool resources. Renewable and Sustainable Energy Reviews, 16(1), 822–835. https://doi.org/10.1016/j.rser.2011.09.006
Biography

Archana is currently a research scholar at Indian Institute of Technology Delhi, India. Her areas of interest include data science, innovation management and sustainability. Her research focuses on new technological fields, which can support better societal transformation and sustainability.
Strategic Planning for Energy and the Environment, Vol. 42_1, 79–100.
doi: 10.13052/spee1048-5236.4215
© 2022 River Publishers