Technical Convergence and the Adaptive Resilience of Regional Economies
Luo Jia
Hunan Key Laboratory of Macroeconomic Big Data Mining and its Application, School of Business, Hunan Normal University, Changsha, Hunan 410081, P.R. China
E-mail: paulinluo@126.com
Received 10 December 2021; Accepted 04 February 2022; Publication 28 December 2022
Abstract
This article investigates the impact of various regional technical profiles on local economies’ resistance to external shocks. It uses panel assessments of level information from 2015 to 2020 to conduct an empirical investigation of the causes of resilience. It begins by developing a calculable broad balance prototype that integrates key features of financing and the time-path of the financial system. Using a dynamic, calculable broad balance prototype recuperates with and without vibrant business adaptability. An adaptive resilience of the regional economic model (ARREM) is suggested in this paper. That integrates key features of financing and vestiges the economic growth time-path as it recuperates with and without vibrant economic adaptability. The findings show that areas with technically integrated – rather than just diverse – knowledge sets are better suited to weather adversity and exhibit adaptive resiliency.
Furthermore, even while businesses’ net entrance doesn’t contribute considerably to durability, the domestic economy is more flexible if they develop in industries with the best development prospects. The iterative simulation results of the ARREM are examined in terms of correlation and regression. An increase in the number of iterations is made from a lower level to a higher level by 10 iterations. Because of this, the proposed ARREM’s simulation results improve with increasing iteration size.
Keywords: Convergence, regional economy, adaptive resilience, local economy.
1 Introduction to Adaptive Resilience
The notion of adaptive resiliency has grown in popularity in the research due to the rebound from the Grand Crisis [1]. Adaptive resiliency refers to an area’s ability to process the consequences of recessionary pressures and its scientific and technological material’s ability to adapt and innovate to external shocks [2, 3]. Asian economies evolve at different rates, and inter-regional disparities can become quite pronounced [4]. While some places seem to be far more adaptive and capable of absorbing disturbances, others seem to be declining [6]. What explains the differences in regional productivity after an emergency? The emergence of new enterprises, creativity, readiness to change, the variety of area market economies, and skilled workforce are all elements that contribute to adaptable resiliency [7, 8].
Diversification is a very significant driver of resilience, according to related research, since diversity can minimize the incidence of sector-specific disruptions and the short-term effect of a disaster on labour [9]. Variety in joint – ventures or technologies might potentially result in beneficial spill-overs. When earnings growth is compatible with the recent skillset and information, recombine procedures include effectively “inputs”, the generation and utilization of societal benefits are more effective. Long-term education investments, innovative capacity development, information infrastructure modernization, and the building of a business-friendly climate have all been found to be important components of a successful shift to a knowledge economy [10]. Health care, food stamps, unemployment benefits, housing help, and childcare support are only some of the services provided by social welfare systems to people and families. A good or service’s social benefit is the totality of its benefits to society as a whole. The term “social benefit” encompasses both the direct and indirect effects of production and consumption on the environment. Even when a product offers substantial external benefits, it is more beneficial to society as a whole than it is to the consumer.
An overall computational paradigm for resilience should address modelling difficulties that are fundamentally complicated and distinctive. Financial, social, and environmental issues are examples of 3d aspects that contribute to building resilience [11, 12]. A system’s total resilience can be mathematically expressed as a collection of interconnected resiliency factors. While concepts of resiliency as a collection of interconnected processes exist, little effort has been made to incorporate them into computer simulations without simple assumptions [13].
Secondly, there could be conflicting theories or beliefs about the importance of interacting components based on facts or an appropriate social theory [14]. Furthermore, elements that influence spreadability alternates between two active phases over time and modify how they connect [15]. Finally, unpredictability in personal and social actions, and insufficient social knowledge, offer challenges. As a result, it proposes that an operating system established and mathematically represents different resiliency measures related to specific assumptions, then uses them to build an entire resiliency value [16].
It hypothesizes and evaluates what type of technical diversification causes adaptation resiliency in this research. To this understanding, few studies have attempted to quantify, quantify, and describe local adaptation resiliency, which is frequently seen as a hidden property of a local market structure [17]. It fills this void by conducting econometric analysis on a dataset of 135 English areas from 2015 to 2020. It incorporates information from the UK National Bureau of Statistics with data from the European Patent Office system to classify patients into eight technical categories and 125 sub-classes, as defined by the United nations Patent Classification System [18, 19].
The importance of technical coherence is revealed by econometric research. It utilizes the data on creator region and 3-digit technique codes to make unique diversity indices because it looks at the influence of different forms of scientific diversification on resiliency. It also implies that high-tech industries’ development areas are more robust, whereas the impact of new enterprises entering the market is minor.
The main contributions to this article are as follows:
• With and without dynamic business adaptability, a broad balance prototype with dynamic calculations is used to recover.
• Adaptive regional economic model resilience is proposed in this research (ARREM).
• As a result of these findings, it appears that areas with integrated rather than just diversified knowledge sets are better equipped to withstand adverse events and demonstrate adaptive resilience
• A landuse based regional economic analysis model is proposed.
The remainder of the paper is given below: Section 2 indicates the survey of the adaptive resilience models. The proposed adaptive resilience of the regional economic model (ARREM) is designed and implemented in Section 3. Section 4 illustrates the software analysis and performance evaluation, and Section 5 discusses the conclusion and limitations.
2 Survey to the Adaptive Resilience Models
The term “resilience” was used in various settings and implications. Engineers, ecologists, and adaptive scientists have looked at resilience from different angles [20]. Earlier research on ‘engineering resilience’ centred on a program’s ability to maintain largely the same purpose, framework, individuality, and feedback loops while facing challenges. ‘Ecological strength’ refers to a controller to ‘absorb disruption and reorganize while facing challenges to retain primarily the same purpose, framework, individuality, and feedback loops [21]. That had resulted in considerable theoretical ambiguity, making it difficult to operationalize for repeated experiments.
In connection to a region’s capacity to restructure economic systems to absorb the consequences of a disruptive event, a more contemporary definition of the notion known as ‘adaptive resiliency’ had been presented. Adversity can be overcome through adaptive resilience, which means recovering, adapting, and prospering. When faced with difficulties or shifting conditions, it increases one’s ability to be productive, resourceful, and innovative in their work. It is not just the presence of disturbances that determines a system’s resilience; it is also the system itself. When it comes to resilience, it appears to be more closely linked to a quality of vulnerability known as adaptive capacity, often known as the capacity for dealing with stress or the ability to respond [22]. The ability of local economies to rebound from an unanticipated downturn, rearrange productive things, and generate new development routes is called resiliency. As per this research, resilience was more than just returning to a steady equilibrium position; it also entailed adapting to changing environments via creativity.
In developmental words, adaption was a path-dependent circumstance that puts by the areas’ inherent pre-shock features and the local system’s capacity to synthesize information to preserve service-made production and employment development trajectories through time [23]. The first hypothesis was that its diversity of economic activity shapes a region’s ability to handle the negative consequences of a recession.
Darayi et al. mentioned a financial system must boost a wide range over a moment to create constructive improvements [24]. It restricted wage stagnation due to a mixture of innovative products and technological advances in manufacturing, a juncture already created by Meuwissen et al. [24]. They suggested that the interaction of cross-sectoral understanding encouraged external costs that nurtured innovation and stimulated localized multiply. According to the researchers, a cross-sectoral understanding promoted external costs fueled innovation and drove local prosperity. Energy can be stored without permanent deformation in resilient materials. The energy is released as soon as it’s removed, so there’s no persistent deformation. This is a desirable quality in a spring-like substance. A high level of diversity should encourage the creation of ripple effects and provide chances for group ideas to be pursued. Manyena et al. claimed that larger diversity could prevent local labour marketplaces from destabilizing events, workers laid off could be acquired [25].
Chacon-Hurtado et al. stressed the significance of diversity in improving the regional economy’s adaptation strategies. They added that a domestic economy with more variation must reduce the risks associated with exogenous risk and favour adaption [26]. Endogenous supplies of fresh information and specific judgments about using this information, according to Tsiapa et al., were co-determinants of local resiliency [27]. Since it reduced innovation development and utilization obstacles, the degree of technical consistency of an area’s product offerings might favour spillovers. Gherhes et al. recently demonstrated that linked technical variation affects the information communication technology (ICT) sector’s adaptation resiliency in Denmark after the dot.com bubble crashed [28].
Many studies in ecology had attempted to address this difficulty when modelling resilience after the work highlighted that unpredictability is a fundamental part of modelling resilience. Aigwi et al. used surveys to model fishery resiliency and use hierarchical clustering to minimize dimensionality, identifying four primary domain-dependent elements [29]. To verify their theory, they quickly followed with a test case. Replies to questionnaire queries were used as the underlying data for determining if a partner was resistant. The study did not attempt to generalize beyond the design of resiliency policies.
Deep learning and analytical measures have also been used in the environmental field. For instance, Koliou et al. used machine learning to evaluate the relationship between shared pool asset lists of important factors from inventory levels [30]. Even so, this article only recognized how variables might be linked, and any claims made by the scheme are hard to comprehend and have poor reliability. Ringwood et al. employed generalized linear models across data series to evaluate the resiliency of wastewater in a similar study [31]. These methods were effective for identifying significant elements and their interrelationships.
It defined intellectual capital as the area’s ability to detect, integrate, and use data from the world, adapting Xie et al.’s methodology to a regional setting [32]. It considered the impact of the region’s knowledge transfer, occupational specialization, and cluster economy while emphasizing technical diversity, cohesion, high-tech activity, and entrepreneurship. It also took into account the proportional amount of jobs in various occupations.
Agglomeration impacts might offer better facilities for creating knowledge, absorbing, and interchange. It has been shown to influence resiliency in research [33]. It discovered that resiliency models emphasize either one. The method was different because it simulated how variables interact using accessible (theoretical and practical) information. It used a technique called fusion to bring their viewpoints together. These techniques’ factors were also used to create parameters in the suggested framework. The objective was to anticipate still when a network was resilient and comprehend and describe why it was resilient. So a better adaptive resilience model is needed. Regional resilience still relies heavily on a dualistic approach to thinking.
Cosens et al. [34] open the volume on Practical Panarchy: Connecting Law, Resilience, and Adaptive Water Governance of Regional Scale Social-Ecological Systems. There are three parts to this three-part volume, which opens with a definition of the language and theoretical concepts used to describe the bridging framework between ecological resilience and governance, as well as legislation.
This way of thinking is rooted in a misunderstanding of history’s dynamic nature. Initial definitions for “adaptation” and “adaptability” served the inflexible and static argument that “once locked-in, never get out” was made. As a result, there is a disparity in the definitions of adaptability and regional economic resilience. On the adaptability side, regional economic resilience is defined as the ability to adapt to changes in the external environment.
3 Proposed Adaptive Resilience of the Regional Economic Model
Among the most difficult fields for computing resiliency modelling is social systems. It uses a set of resiliency measures to measure spreadability. There is a functional resiliency translation from a collection of social-economic factor variables to a continuous scale from zero to 1, with 0 indicating the least durable and 1 indicating the most resistant. Each resiliency function takes a different approach to describe a society’s resilience. It combines numerous resiliency operations into a single tent function to represent a society’s largest portion by considering the interplay of predictor factors in each component of resiliency.
Societal structures, as complicated systems, are made up of individuals with different behavioural traits that engage with one another and react to changes in the climate. As a result, it’s feasible that many resiliency functionalities are working within the networks and that the interplay among these activities determines the structures’ largest portion. What has to be expressed in these separate resiliency values, and, more importantly, how to assemble these operations to build an umbrella resiliency functional, now become main research topics.
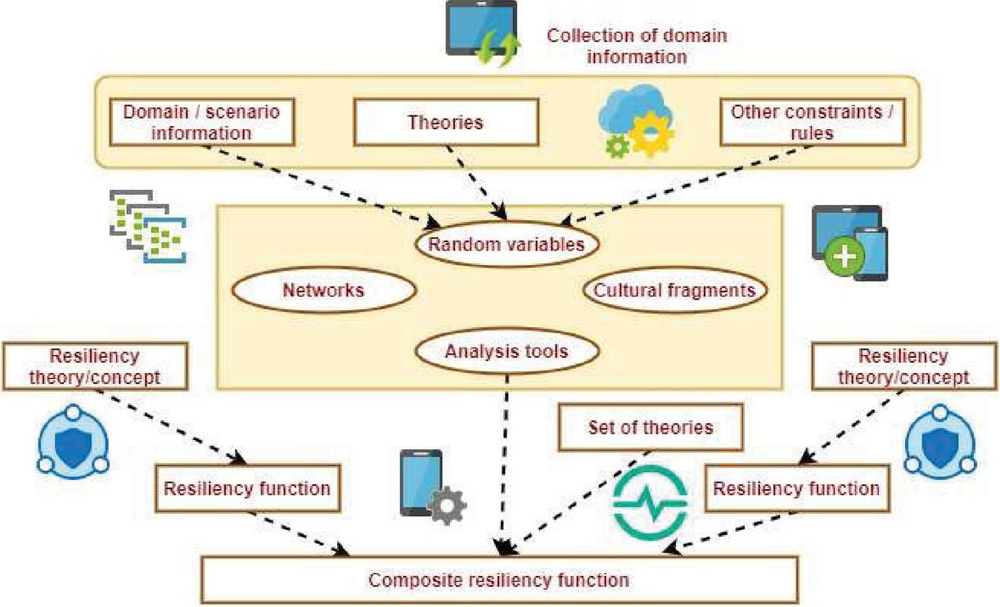
Figure 1 The architectural design of the suggested ARREM.
The architectural design of the suggested ARREM is depicted in Figure 1. The suggested ARREM has three models: domain information, resilience functions, a set of theories, random variables, and cultural fragments. It is critical to overcoming numerous modelling obstacles to represent social resiliency for complicated real-world circumstances. The following are some of them. As a result of these activities and interactions, systemic resiliency is strengthened or weakened. Data and system environments must be preserved even if the production system is down. Even if the system presently hosting these objects goes down, a failover will ensure that they are still available to users.
In contrast to the two interactions above, this type of relationship involves that local playerwho intentionally mobilizes resources to support adaptability. Generally speaking, there are two primary methods of practice. In other words, both internal and external adaptation is possible when using adaptation to enable change. In the first mechanism, existing industrial assets are repurposed into new ones.
(1) Factors that affect many domains: Case research has demonstrated that socioeconomic system resilience is influenced by a wide number of three-dimensional 3d elements, many of whose consequences and interconnections are unknown. A group could comprehend their effects, introducing bias to the modelling process.
(2) Many Resilience Works: Current computer models for community resilience are limited, and they do not adequately explain all elements of adaptive capacity. Furthermore, building an overall resilience mechanism from the bottom up is not practical due to various underlying components and interconnections. As a result, a modelling approach is sought to combine separate resilience factors into a broader resiliency function. Because extensive quantitative approaches aren’t always accessible, modellers rely on subjective or anecdotal data.
(3) Incomplete Data: Socially constructed data on situations is frequently lacking, with information on crucial aspects to the resiliency being tested missing. It’s also possible that the social group being studied is not available for prolonged field research. Estimations of factors should serve in such circumstances.
This paradigm’s basic idea is to combine numerous resilience operations into a single umbrella resiliency function using theoretical constructs. The paradigm describes resilience data using a series of analytical and statistical methodologies, and it provides a modelling methodology that addresses these issues in this section. In addition, the plan comprises formalism for designing resiliency functions and instructions for composing an overarching resiliency function using theoretical constructs. The rest of this section describes the model approach and the approach for calculating resilience levels. Systemic resiliency can be developed or diminished due to various activities and interactions. Increased data and system settings must be created if larger iterations will help the regional economy’s adaptive resilience model outperform other traditional techniques.
3.1 Independent Variables
It looks at the impact of diverse technology characteristics on local economies’ ability to withstand external shocks. More specifically, it wants to know how different technical diversity levels and types affect resilience. As a result, it includes three types of signals in the prediction: area entropy, unconnected variation, and link variety. Each of the dataset’s 125 invention categories is classified into one of eight technical subfields. It was first used to examine the distribution of diverse economic activities among sectors, businesses, and geographic areas. This index serves as a preliminary indicator of technological diversification in a given region.
It was first used to investigate how various economic operations were spread among sectors, businesses, and geographies. This index is used as a preliminary indication of technical diversification in a certain region. Down this line of investigation, every one of the 125 invention categories in the dataset is categorized through one of the eight technical areas. The likelihood of the invention in occurring is calculated in Equation (1)
| (1) |
The category index is denoted . As a result, the between-group volatility, also known as Unconnected Variety (UV), is determined in Equation (2)
| (2) |
The category index is represented . According to the entropy reduction theory, the relationship between Unconnected Diversity and local complete Knowledge Entropy is denoted in Equation (3)
| (3) |
The unconnected variety is denoted UV, and the knowledge entropy is denoted , and the index value is denoted .
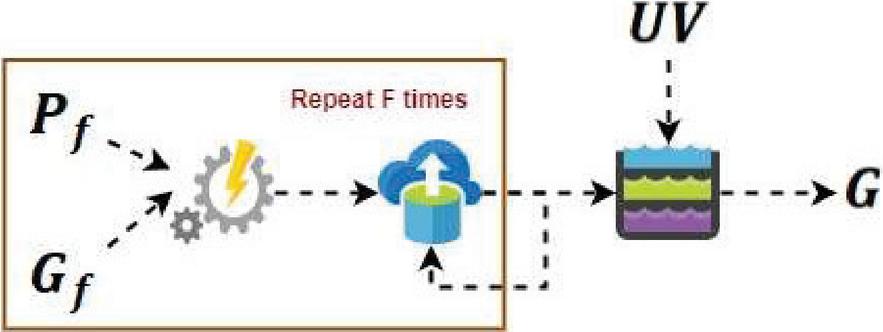
Figure 2 The pictorial representation of G.
The pictorial representation of G is represented in Figure 2. It uses unconnected variety, knowledge entropy, and index value to calculate G. Information gain is measured using Gini index and entropy, both of which are shown graphically in Figure 2. A node’s impurity is quantified by G and entropy, two different quantities. A node with more than one class is impure, whereas a node with one class is pure. In statistics, entropy is similar to thermodynamics, which means disorder. The second component is Related Variation (RV) or within-group volatility. The related variation and group function are denoted in Equations (4) and (5).
| (4) | ||
| (5) |
The knowledge entropy is denoted , and the index value is denoted . The mean index value is denoted . The comparative dynamics of linked and unconnected variety significantly impact the overall entropy metric. The impact of overall entropy on resiliency, defined as yearly fluctuation in job growth, is projected to be unfavourable if unrelated technical diversity dominates. Suppose linked technical variation plays a prominent role. In that case, the score favourable regional adaptation supports spillover effects that flow more effectively into information undertaken in a series. Economic resilience is the ability of a regional economy to absorb the consequences of recessionary pressures and the ability of its industrial and technological structure to adapt and innovate in the face of exogenous shocks. The resilience of the economy. Regional economic growth is increasingly connected to the ability of an area to prevent, withstand, and quickly recover from large disruptions. The Coherent Index () is a ‘randomization measure’ that balances the given data of with the anticipated value on the assumption that technology diversity is represented in Equation (6)
| (6) |
when is the hypothetical randomized sample’s median , and the deviation is denoted . The output of the function is denoted . The median value is expressed in Equation (7)
| (7) |
The length of the x and y dimension is denoted and . The average length is denoted L. The deviation is and it is expressed in Equation (8)
| (8) |
Wherein N is the maximum number of NUTS III areas in the study and L is the maximum number of NUTS III areas. The mean value is denoted . The length of the x and y dimension is denoted and . It next computes the Total Average Connectedness of tech y about other n innovations existing inside the area l at time t is expressed in Equation (9)
| (9) |
The level with which innovation y is connected to all other innovations within the area l (at time t), balanced by the patent application of new tech n in the specified NUTS, III area at period t is denoted as . Finally, the weighting factor of the is given as the Area Technical Coherent (C) of area l at period t. The coherent function is denoted in Equation (10)
| (10) |
wherein is the maximum number of copyrights in the area l. The weighting factor is denoted . The balanced function is denoted .
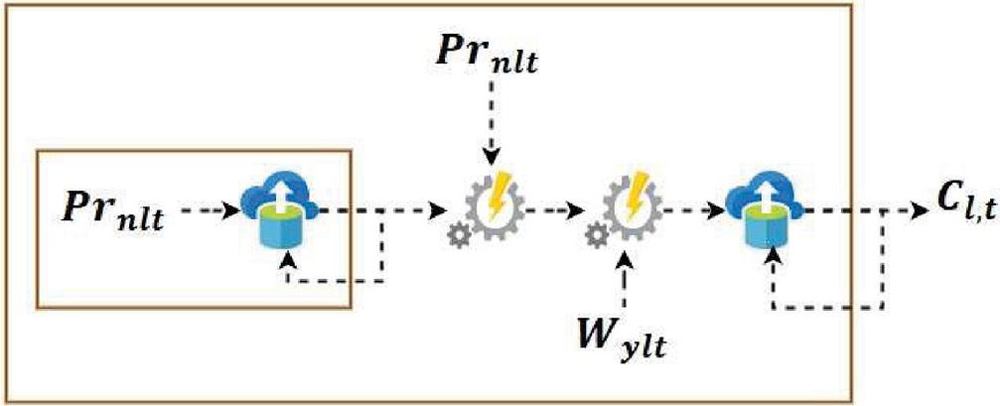
Figure 3 The pictorial representation of .
The pictorial representation of . This metric depicts how complimentary the various types of patents that make up an area’s technical skillset are to each other, as denoted in Figure 3. It uses a weighting function and a balanced function, and the cumulative sum function is used for the result calculation. It predicts this indicator to be linked positively to local resiliency because, as previously said, technical closeness is thought to play a crucial role in inducing recombinant product development within areas. As a result, the coherence measure is particularly well suited to the study goals.
In establishing national agricultural policy, societal government (G) is considered as reflecting concerns in a series of choices. This statistic measures the total amount of agriculture industry organizations, non-governmental organizations, coalitions, and committees in a given nation and examines their development over time. The greater the value of players in the benchmark year, the greater the value of G, and the greater the concerns are reflected, resulting in a more robust agriculture industry.
Financial accessibility in farming is the last socioeconomic resilience criterion on the shortlist. According to economic relations, a command economy has no interaction with other countries and does not engage in any transaction. However, based on the nation’s constraints on free markets, there are differing levels of accessibility. The proportion of gross domestic product (GDP) that trade flows constitute is a typical fundamental measure of an economic growth openness.
3.2 Resilience Functions
The methodology facilitates numerous resiliency functions due to varying assumptions over which elements and relationships affect the program’s resistance. The suggested methodology also allows the formulation and refinement of resiliency functions using various strategies, spanning from a weighted sum to more advanced statistical tools. One potential architecture for resiliency services gives metrics to research the program’s resiliency, like comparison and descriptive research. The resilience computation algorithm is given below.
Resilience computation
Input: , output
for every factor
if constraints check is true
else
end if
end for
if
Resilience value
else
Nonresilience
end if
It uses the research methods to describe a resilience purpose , , within which L is a collection, E is its correlating set of proof variable synsets, is the collection of aim varying synsets (considerations pertinent to the adaptability feature), and is a set of restriction features in this layout utilized in the experiments. The proof parameter new structures set E contains trusted data, reducing the number of alternative states in L.
The goal integration variables that it picked available data, initial estimates, suggestions and are thought to influence resiliency. Similar restriction variable theories have been applied in the nonlinear dynamics field, built on the idea of resiliency basins or water sources, which are deemed resilient components. , , where is the restriction functional for an output variable . The comparative relevance of the target attribute is represented by . There may be conflicting thoughts or beliefs about the relevance of interconnected components based on facts or a relevant social theory. While functionalism sees society as a complicated system, Symbolic Interactionism sees society as an artificial construct, relying on human interpretations, which is the major distinction between the two approaches to society.
It is argued that the value of the constraint is fulfilled. If all elements in a system fulfil their corresponding restrictions, it is termed robust in terms of a resiliency function. As previously said, the design illustrated above is only one of the options available inside the system. Several complicated resilience measures are developed within the societal resiliency model, especially those that integrate other data categories like elements that change over time. All economies go through periods of growth and recession. These changes result from changes in employment, productivity, and the total demand and supply for the nation’s commodities and services. Economic expansion and contraction are short-term consequences of these shifts.
3.3 Landuse Scenarios
The system created six weighing pairings for the five sections: one with proportional allocation, one with one heavyweight (one per target), and four with low weight training. It re-generated landuse situations three times by valuing pairings and studied every iteration since random search techniques provide various results in every run (Table 1).
The effectiveness of the three landuse categories under potential climatic change was calculated by examining values produced from existing landuse arrangements (e.g., productive rice capacity, Current goal) with results calculated from all of the alternative geographical situations . The productivity and learning rate are denoted in Equations (11) and (12)
| (11) | ||
| (12) |
The sensitivity is denoted , the current goal is denoted , and the learning rate is denoted .
3.3.1 Optimization model
Optimization techniques may propose better methods than present landuse trends by examining many possibilities. It was run using a custom crossover to minimize spatial dispersion. It used a 25 percent randomized planting of land uses and a 75 percent selection from current land uses to start every run. Then, within every run, the ‘variant’ and selection tests were done 20000–40000 instances until the quality of every scenario indicated converged.
The crossover function adjusted 0.08 percent of every landuse situation under ‘variation.’ The championship approach was used to pick landuse situations with improved fitness after integrating updated and prior scenarios in selection. In the perspective of weight and fulfilment of goals, and the path of reduction, fitness showed how one situation placed compared to others; it chose landuse situations with lower societal costs as expressed in Equation (13)
| (13) |
where C is the number of situations, N counts the set of optimizing goals (except for ‘convert reduction’), and denote the values of goals in Table 1, and ‘Greatest’ and ‘Poorest’ denote the finest and poorest outcomes of all the optimized scenarios. The productivity is denoted P, and the biasing condition is denoted B.
3.3.2 Analysis of landuse scenarios
The following studies were carried out following 15 optimum landuse situations based on the six weighted choices. To begin, it chose three example situations that demonstrated the best catastrophe mitigation, crop yields, and variety richness results. It analyzed how various scenarios reduce global warming consequences or how much farmland use modification was necessary. Secondly, it looked at the trade-offs between situations and goals by linking the results of every Pareto situation to lines with different slopes and orientations depending on the weighting combinations.
Third, it used spatial patterns to create landuse situations that quantified ideal land-use areas with common themes. For instance, if the occurrence of landuse A in a specific region was greater than 50%, that region was allocated to A, with the same colour series displayed in deeper colours as the incidence grew. ‘Neutral’ was awarded to areas that did not predominate a certain landuse, as seen in white.
3.4 Econometric Analysis and Findings
The regression model is used to study the impact of different technology characteristics on resiliency while evaluating the ‘within’ and ‘among’ variance of micro-regions. Additional fixed-effects analyses completely validate the findings by accounting for any extraneous variables.
It uses a systematic process in the esteems: first, it approximates a theory to describe local variations in jobs within and throughout areas. It communicates the regression model for the economic crisis (characterized as 0 until the year 2015) to see how the geographic technical structure moderated the downturn’s impact.
The coefficients of the factors entropy and UV are negligible, according to the findings of the foundation calculations. As a result, contrary to earlier research, all diversity metrics seem not to influence job development. Regional Technical Coherent (C) indicates a good coefficient in all calculations. This finding shows that diversification into technologically consistent invention categories is key in job growth.
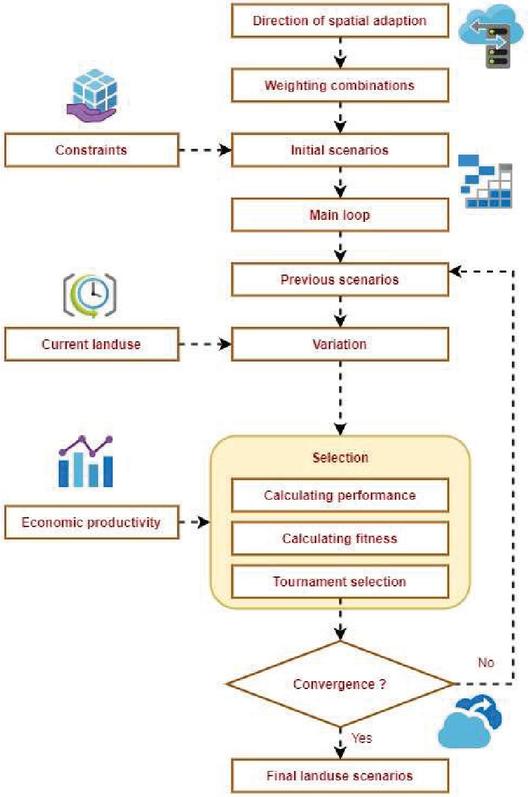
Figure 4 The flowchart of the suggested ARREM.
The flowchart of the suggested ARREM is denoted in Figure 4. The spatial adaptation model is used for weight updating, resilience model, constraints, current landuse, and economic productivity. The selected resilience and fitness model is chosen to converge the final results. As land-use patterns change, optimizing tactics may offer more effective solutions than those now in use. The introduction of new technology, capital, and industries from outside the region may be the primary adaptation method in some areas. Institutional obstacles or resistance to modernizing old industries could be to blame, as could a desire to diversify area economies to make up for fading industries. Both of these possibilities are plausible. An adaptable society can bring new industries outside the region without harming the region’s primary industries, which is a win-win situation for the entire country.
They also demonstrate that, in keeping with prior research, the drop in overall employment is significantly negative in all calculations, implying that higher proportions of low-skilled workers reduce the regional economy’s ability to enhance their professional profile. Intriguingly, the indices for new company creation (parameter Entry) are negligible (minus). Ultimately, these findings show that the downturn (Crisis) had a significant negative impact on job development, as projected.
The interacting model’s findings indicate that all diversity strategies have an unfavourable but small coefficient. As a result, it discovers that portfolio diversity has little impact on adaptable resiliency. In all esteems, Cohesion (C) and Patent rights in high-tech industries have positively significant coefficient, indicating that the supplies of adaptability are discovered in the geographic country’s economic, technical cohesion, and alignment toward advancement in industries with the amazing innovations possibilities. Patent rights in high-tech industries have a positive coefficient compared to your proposed system advantages in terms of economic, technological, and political cohesiveness and alignment towards advancement.
The findings imply that new enterprises haven’t any influence on regional resilience, opposite to our assumptions. In addition, the factor Entry does have a non-significant impact on resiliency. Trademarks in the NUTS III area are clustered in a few invention classes if the index price is small. On the other hand, a larger score implies that the allocation of local patents across various classes is more varied. The findings back up the assumptions and prior findings.
3.5 Contributions of the Framework
The platform’s capacity to represent every one of the assumptions about the program’s resiliency as one or even more resiliency functions is critical. For example, a specific resiliency assumption correlates to a fraction of the components described in the above cultural pieces and builds a particular resiliency function. The methodology also creates a massive or overarching resiliency functional from specific resiliency functions. The data on how elements from various resilience measures combine isn’t accessible in some circumstances.
Individual resiliency processes engage when one or maybe more resiliency processes predominate, and since they only get a minimal impact, according to sociological theories. However, it is important to highlight that the basic modelling approach is independent of any specific sociological theory or information retrieval. Depending on the situation to be modelled, important social concepts are chosen. The system used social standards and risk assessment theories to guide the program in this trial’s setting.
This first attempt concentrates on crucial characteristics of social capacity building and sociological theories to connect the personal resiliency processes. It created resiliency algorithms for both fisheries and pirates to achieve this. Selected social concepts about social standards and risk assessment were then used to construct an entire resiliency metric. The experimental results used sociocultural modelling methodologies already studied as a portion of our older projects with computerized cultural modelling.
4 Software Analysis and Evaluation
This section integrates workforce and industry composition data in NUTS III areas in the United Kingdom with copyright data. It looked at patents filed by scientists from various NUTS III UK areas. Accordingly, the data comes from the web page and the European Patent Office’s PATSTAT dataset.
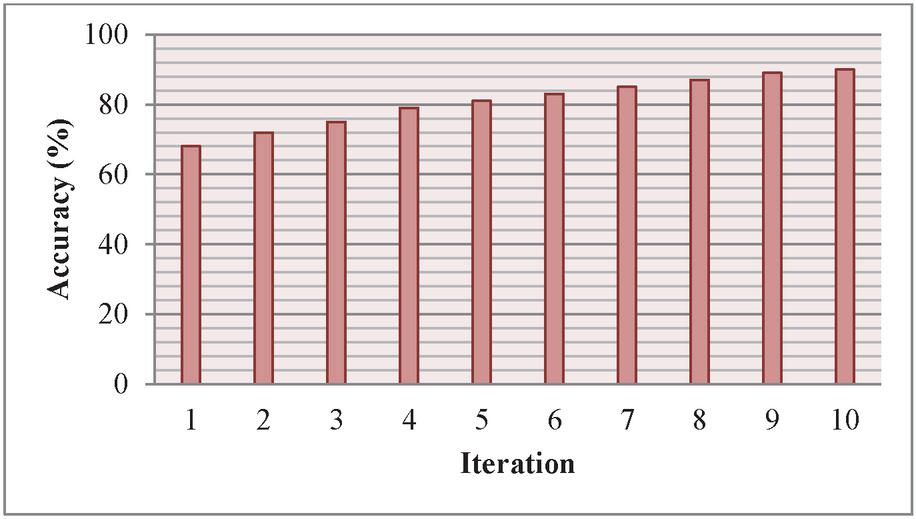
Figure 5(a): Accuracy analysis of the suggested ARREM.
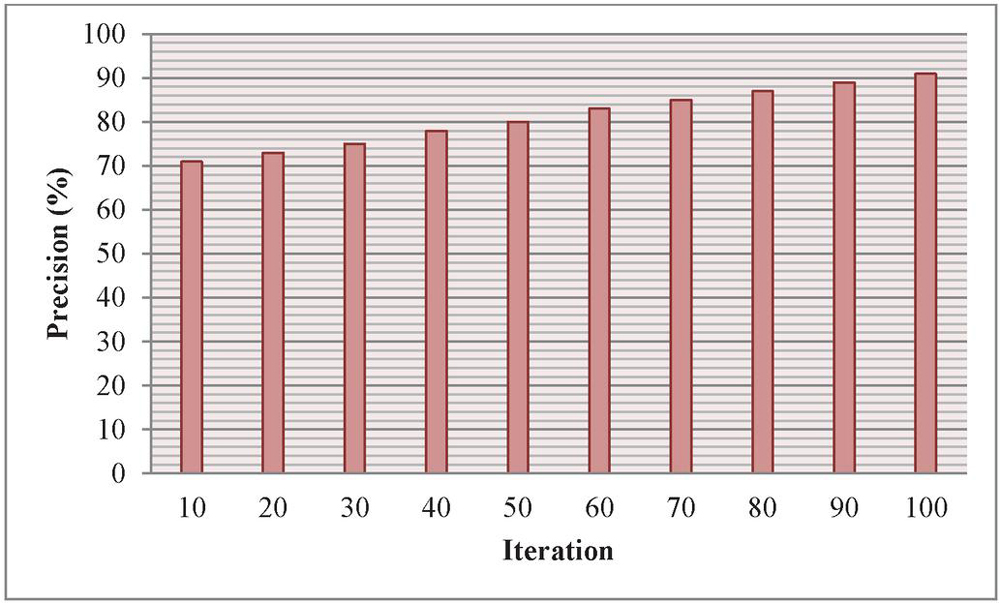
Figure 5(b): Precision analysis of the suggested ARREM.
This section includes copyright data and statistics on the employment and industrial composition in the Nuts III region. Researchers in several NUTS III UK regions looked at patents filed by their colleagues. Panel analyses of UK NUTS-III-level data for 2004–12 give an empirical analysis of the factors influencing resilience. According to the findings, regions with well-coordinated technological knowledge bases are better prepared to deal with an unexpected economic slump and demonstrate adaptive resilience. In addition, local economies are more resilient if they innovate in sectors with the greatest development potential, even if new enterprises do not appear to have a large impact on resilience. Figures 5(a) and 5(b) show the accuracy and precision analysis of the suggested ARREM. The simulation analysis of the suggested ARREM is analyzed by varying the iteration size from a minimum level to maximum level with a step size of 10 iterations. As the iteration size increases, the adaptive resilience model of the regional economy also increases. The simulation findings show that the effectiveness of the suggested ARREM. The higher accuracy and precision show the higher utilization of the suggested ARREM under the given simulation environment.
Table 1 Error analysis of the suggested ARREM
| Iteration | RMSE (%) | MAPE (%) |
| 10 | 36 | 39 |
| 20 | 32 | 37 |
| 30 | 29 | 35 |
| 40 | 27 | 32 |
| 50 | 24 | 30 |
| 60 | 22 | 28 |
| 70 | 21 | 26 |
| 80 | 19 | 24 |
| 90 | 17 | 23 |
| 100 | 16 | 21 |
Table 1 indicates the error analysis of the suggested ARREM. The root means squared error (RMSE) and means absolute peak error (MAPE) of the suggested ARREM are analyzed under the given simulation environment. The simulation evaluation is carried out by varying the iteration from a minimum size to a maximum size with a step size of 10 iterations. The suggested ARREM with adaptive resilience with regional economy exhibits higher simulation outcomes—the lower error results in higher simulation outcomes of the suggested ARREM.
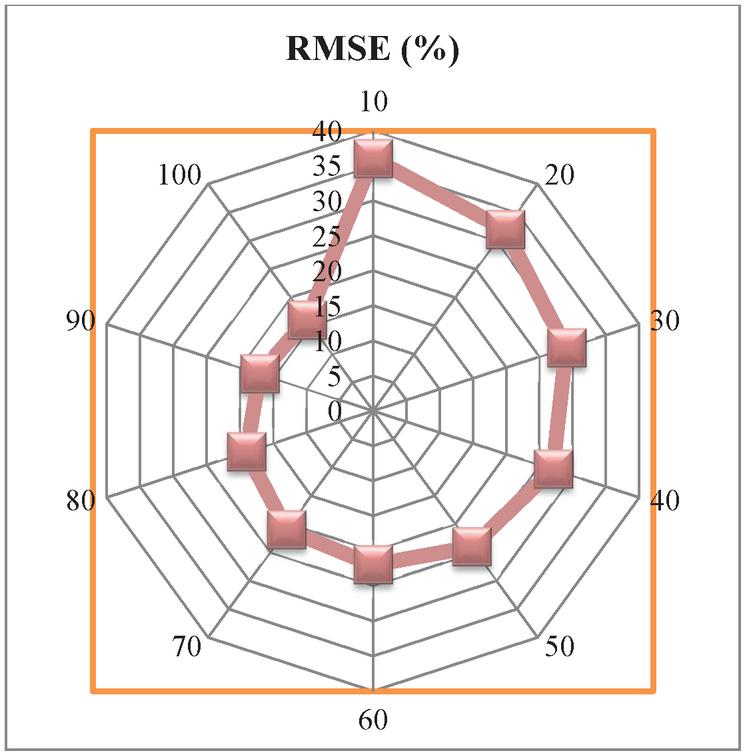
Figure 6(a): Root mean squared error analysis of the suggested ARREM.
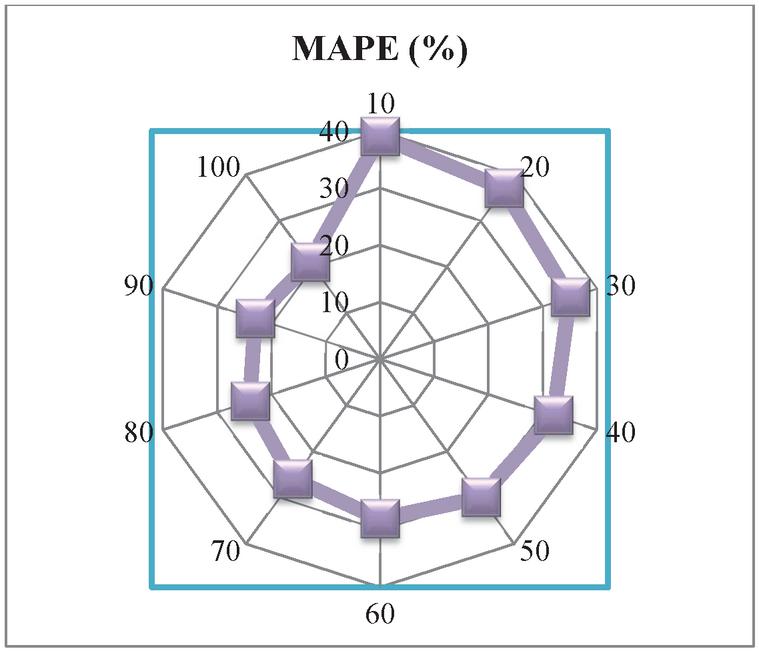
Figure 6(b): Mean absolute peak error analysis of the suggested ARREM.
Figures 6(a) and 6(b) show the root mean squared error and mean absolute peak error analysis of the suggested ARREM. The simulation outcomes of the suggested ARREM are done by considering the given dataset and by varying the iteration size from a minimum size to a maximum size with a step size of 10 iterations. As the iteration size increases, the suggested ARREM has higher simulation outcomes with a higher learning rate. The lower error in the suggested ARREM is achieved by considering the adaptive resilience model.
Table 2 Simulation outcome analysis of the suggested ARREM
| Iteration | Correlation (%) | Regression (%) |
| 10 | 57 | 59 |
| 20 | 59 | 62 |
| 30 | 61 | 64 |
| 40 | 63 | 68 |
| 50 | 65 | 70 |
| 60 | 68 | 73 |
| 70 | 70 | 75 |
| 80 | 72 | 79 |
| 90 | 75 | 81 |
| 100 | 78 | 83 |
The simulation outcome analysis of the suggested ARREM is depicted in Table 2. The simulation outcomes in terms of correlation and regression of the suggested ARREM are analyzed concerning the iteration. The iteration size is increased from a lower level to a higher level with a step size of 10 iterations. As the iteration size increases, the respective simulation outcomes of the suggested ARREM also increase. The suggested ARREM with adaptive resilience model for regional economy helps the system produce better simulation results.
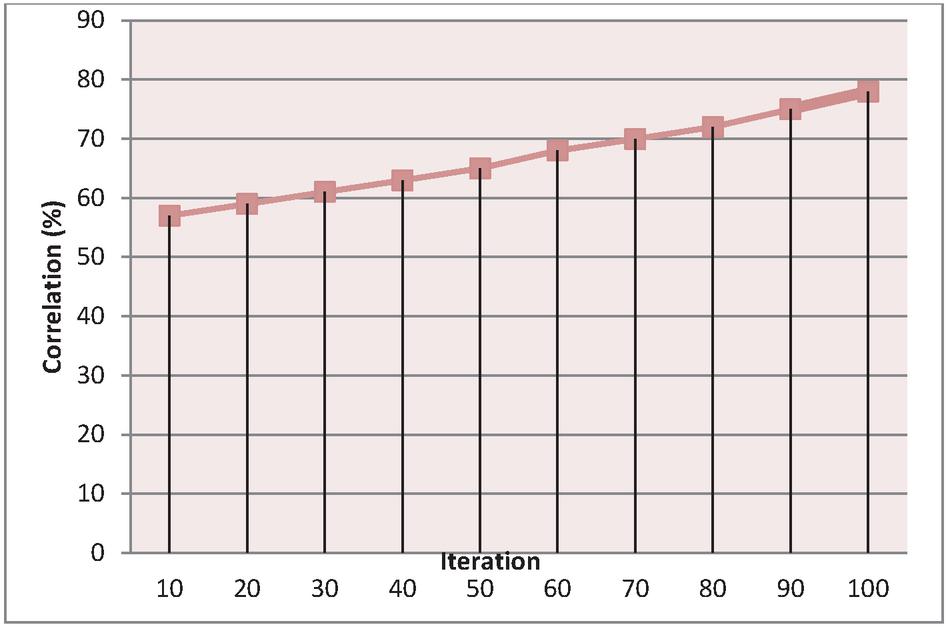
Figure 7(a): Correlation analysis of the suggested ARREM.
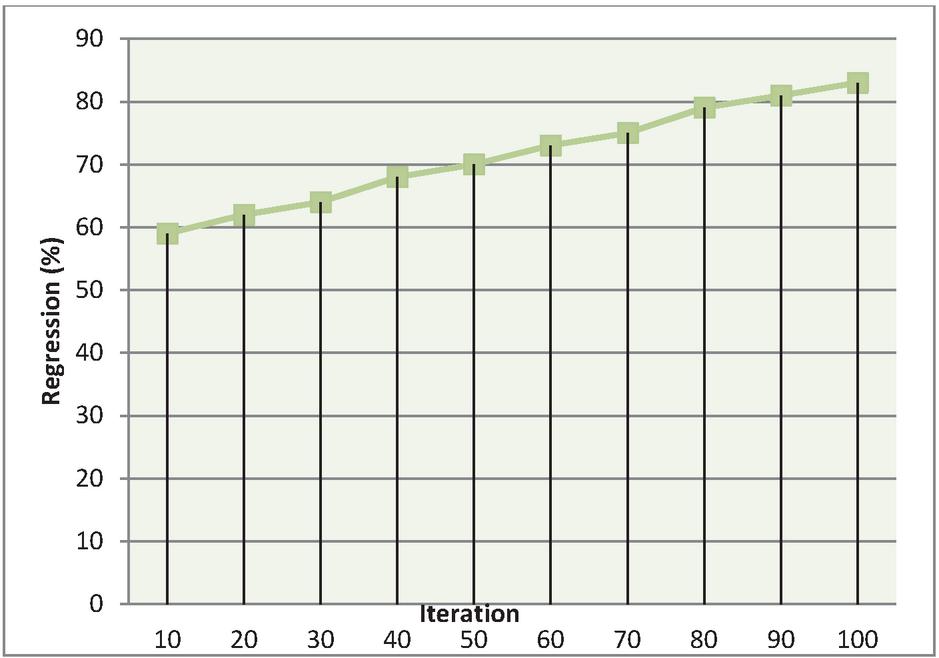
Figure 7(b): Regression analysis of the suggested ARREM.
The correlation and regression analysis of the suggested ARREM are denoted in Figures 7(a) and 7(b). The suggested ARREM is analyzed with the given simulation environment and the dataset. As the iteration increases, the respective simulation findings such as correlation and regression of the suggested ARREM increase. The suggested ARREM exhibits higher simulation outcomes with the help of the adaptive resilience model. The suggested ARREM with simplified computation model and mathematical function ensured the higher effectiveness.
The suggested ARREM is designed, developed, analyzed, and implemented in this section. The software analysis of the suggested ARREM is analyzed such as accuracy, precision, RMSE, MAPE, regression, and correlation. The simulation findings show the higher effectiveness of the suggested ARREM under the entire simulation environment.
5 Conclusion and Future Scope
The variables determining the resiliency of UK NUTS III local economies to the Global Recession were examined in this work. The research makes a unique addition by concentrating on the effect of various regional technical profiles in determining local economies’ ability to withstand exogenous shocks. The descriptive data indicated that responding to the disaster was highly disparate across UK locations. It hypothesized that one of the main reasons was the technical diversity of local initiatives. Using panel assessments of the impact of the UK downturn in 2015, it tried to explore the causes of local adaptable resiliency.
An adaptive resilience of the regional economic model (ARREM) is suggested in this paper. It also showed that no other indicators of regional diversity have a substantial impact on resiliency. That is presumably because knowledge synthesis is more efficient if there are significant functional linkages across innovations or when there’s still technical variation. High technical diversity within the area might certainly equate to higher cognitive separation among market participants, impeding the recombinant design process and creating novel remedies to the imminent threat of collapse. It also discovered that new businesses did not substantially impact adaptive resiliency.
The suggested model suggests that the production system’s ability to produce new initiatives is less significant than its spirit of innovation in the context of regional growth. If the formation of new enterprises is based on a superior technical foundation, entrepreneurship could impact local economies’ flexibility. It performed another estimate to explicitly assess the joint impact of the entrance, knowledge depth, and the disaster variable (a three-way contact), but the findings were not statically important. Modelling information interrelations might be useful in this line of study, and it could help expand the understanding of resiliency in a multi-level (firm-region) context in the future.
References
[1] Rocchetta, S., and Mina, A. (2019). Technological coherence and the adaptive resilience of regional economies. Regional Studies, 53(10), 1421–1434.
[2] Manogaran, G., Shakeel, P. M., Burhanuddin, M. A., Baskar, S., Saravanan, V., Crespo, R. G., and Martínez, O. S. (2021). ADC-CF: Adaptive Deep Concatenation Coder Framework for Visual Question Answering. Pattern Recognition Letters.
[3] Nguyen, T. G., Phan, T. V., Hoang, D. T., Nguyen, T. N., and So-In, C. (2020, December). Efficient SDN-Based Traffic Monitoring in IoT Networks with Double Deep Q-Network. In International Conference on Computational Data and Social Networks (pp. 26–38). Springer, Cham.
[4] Rauf, H. T., Gao, J., Almadhor, A., Arif, M., and Nafis, M. T. (2021). Enhanced bat algorithm for COVID-19 short-term forecasting using optimized LSTM. Soft Computing, 25(20), 12989–12999.
[5] Su, J., Chu, X., and Kadry, S. (2020). Internet-of-Things-Assisted Smart System 4.0 Framework Using Simulated Routing Procedures. Sustainability, 12(15), 6119.
[6] Amudha, G. (2021). Dilated Transaction Access and Retrieval: Improving the Information Retrieval of Blockchain-Assimilated Internet of Things Transactions. Wireless Personal Communications, 1–21.
[7] Manickam, A., Soundrapandiyan, R., Satapathy, S. C., Samuel, R., Krishnamoorthy, S., Kiruthika, U., and Haldar, R. (2021). Local Directional Extrema Number Pattern: A New Feature Descriptor for Computed Tomography Image Retrieval. Arabian Journal for Science and Engineering, 1–23.
[8] Abd El-Latif, A. A., Yan, X., Li, L., Wang, N., Peng, J. L., and Niu, X. (2013). A new meaningful secret sharing scheme based on random grids, error diffusion and chaotic encryption. Optics & Laser Technology, 54, 389–400.
[9] Gomathi, P., Baskar, S., and Shakeel, P. M. (2021). Concurrent service access and management framework for user-centric future internet of things in smart cities. Complex & Intelligent Systems, 7(4), 1723–1732
[10] Zughoul, O., Zaidan, A. A., Zaidan, B. B., Albahri, O. S., Alazab, M., Amomeni, U., … and Amomeni, B. (2021). Novel triplex procedure for ranking the ability of software engineering students based on two levels of AHP and group TOPSIS techniques. International Journal of Information Technology & Decision Making (IJITDM), 20(01), 67–135.
[11] Preeth, S. S. L., Dhanalakshmi, R., Kumar, R., and Shakeel, P. M. (2018). An adaptive fuzzy rule based energy efficient clustering and immune-inspired routing protocol for WSN-assisted IoT system. Journal of Ambient Intelligence and Humanized Computing, 1–13.
[12] Amudha, G., Jayasri, T., Saipriya, K., Shivani, A., and Praneetha, C. H. (2019) Behavioural Based Online Comment Spammers in Social Media. International Journal of Innovative Technology and Exploring Engineering (IJITEE), Volume-9, 175–179
[13] Yan, X., Wang, S., Abd El-Latif, A. A., and Niu, X. (2015). Visual secret sharing based on random grids with abilities of AND and XOR lossless recovery. Multimedia Tools and Applications, 74(9), 3231–3252.
[14] Gao, J., Wang, H., and Shen, H. (2020, May). Smartly handling renewable energy instability in supporting a cloud datacenter. In 2020 IEEE international parallel and distributed processing symposium (IPDPS) (pp. 769–778). IEEE.
[15] Bhat, A. H., Nguyen, T. N., Cengiz, K., and Prabhu, P. (2021). An accurate and exact clustering algorithm for next generation sequencing metagenomic sequences. Mathematical Methods in the Applied Sciences.
[16] Xu, X., Li, D., Sun, M., Yang, S., Yu, S., Manogaran, G., … and Mavromoustakis, C. X. (2019). Research on key technologies of smart campus teaching platform based on 5G network. IEEE Access, 7, 20664–20675.
[17] Srivastava, A. K., Grotjahn, R., Ullrich, P. A., and Sadegh, M. (2021). Pooling data improves multimodelIDF estimates over median-based IDF estimates: Analysis over Susquehanna and Florida. Journal of Hydrometeorology.
[18] Zhang, R., and Jackson Samuel, R. D. (2020). Fuzzy efficient energy smart home management system for renewable energy resources. Sustainability, 12(8), 3115.
[19] Bui, H. T., Jones, T. E., Weaver, D. B., and Le, A. (2020). The adaptive resilience of living cultural heritage in a tourism destination. Journal of Sustainable Tourism, 28(7), 1022–1040.
[20] Tian, C. S., Fang, Y. P., Yang, L. E., and Zhang, C. J. (2019). Spatial-temporal analysis of community resilience to multi-hazards in the Anning River basin, Southwest China. International Journal of Disaster Risk Reduction, 39, 101144.
[21] Yang, D., Gao, X., Xu, L., and Guo, Q. (2018). Constraint-adaptation challenges and resilience transitions of the industry – an environmental system in a resource-dependent city. Resources, Conservation and Recycling, 134, 196–205.
[22] Cradock-Henry, N. A., Frame, B., Preston, B. L., Reisinger, A., and Rothman, D. S. (2018). Dynamic adaptive pathways in downscaled climate change scenarios. Climatic change, 150(3), 333–341.
[23] Foster, G. (2020). Circular economy strategies for adaptive reuse of cultural heritage buildings to reduce environmental impacts. Resources, Conservation and Recycling, 152, 104507.
[24] Darayi, M., Barker, K., and Nicholson, C. D. (2019). A multi-industry economic impact perspective on adaptive capacity planning in a freight transportation network. International Journal of Production Economics, 208, 356–368.
[25] Meuwissen, M. P., Feindt, P. H., Spiegel, A., Termeer, C. J., Mathijs, E., de Mey, Y., … and Reidsma, P. (2019). A framework to assess the resilience of farming systems. Agricultural Systems, 176, 102656.
[26] Manyena, B., Machingura, F., and O’Keefe, P. (2019). Disaster Resilience Integrated Framework for Transformation (DRIFT): A new approach to theorizing and operationalizing resilience. World Development, 123, 104587.
[27] Chacon-Hurtado, D., Kumar, I., Gkritza, K., Fricker, J. D., and Beaulieu, L. J. (2020). The role of transportation accessibility in regional economic resilience. Journal of Transport Geography, 84, 102695.
[28] Tsiapa, M., Kallioras, D., and Tzeremes, N. G. (2018). The role of path-dependence in the resilience of EU regions. European Planning Studies, 26(6), 1099–1120.
[29] Gherhes, C., Vorley, T., and Williams, N. (2018). Entrepreneurship and local economic resilience: the impact of institutional hysteresis in peripheral places. Small Business Economics, 51(3), 577–590.
[30] Aigwi, I. E., Egbelakin, T., Ingham, J., Phipps, R., Rotimi, J., and Filippova, O. (2019). A performance-based framework to prioritize underutilized historical buildings for adaptive reuse interventions in New Zealand. Sustainable Cities and Society, 48, 101547.
[31] Koliou, M., van de Lindt, J. W., McAllister, T. P., Ellingwood, B. R., Dillard, M., and Cutler, H. (2020). State of the research in community resilience: Progress and challenges. Sustainable and resilient infrastructure, 5(3), 131–151.
[32] Ringwood, L., Watson, P., and Lewin, P. (2019). A quantitative method for measuring regional economic resilience to the great recession. Growth and Change, 50(1), 381–402.
[33] Xie, W., Rose, A., Li, S., He, J., Li, N., and Ali, T. (2018). Dynamic economic resilience and economic recovery from disasters: A quantitative assessment. Risk analysis, 38(6), 1306–1318.
[34] Cosens, B., and Gunderson, L. (2018). An introduction to practical panarchy: linking law, resilience, and adaptive water governance of regional scale social-ecological systems. In Practical Panarchy for Adaptive Water Governance (pp. 1–16). Springer, Cham.
[35] Shakeel, P. M., Baskar, S., Fouad, H., Manogaran, G., Saravanan, V., and Montenegro-Marin, C. E. (2021). Internet of things forensic data analysis using machine learning to identify roots of data scavenging. Future Generation Computer Systems, 115, 756–768.
[36] Vijayalakshmi, S., Anpalagan, A., Kothari, D. P., Woungang, I., and Obaidat, M. S. (2014). An analytical study of resource division and its impact on power and performance of multi-core processors. The Journal of Supercomputing, 68(3), 1265–1279.
Biography

Jia Luo was born in Guang Dong Province, GD, CHN in 1977. She received the M.S. degree in 2004 and the Ph.D. degree in 2010 in finance from Hunan University, Hunan, China.
From 2005 to 2010, she was a doctoral candidate and teaching assistant with the Finance and Statistics College, Hunan University, Hunan, China. Since 2010, she has been a teacher in the Business School, Hunan Normal University, Hunan province. She is the author of one book, more than 11 articles. Her major fields of study are Financial regulation and supervision, Synergetic system, Macroeconomic Big Data Mining and its Application.
Strategic Planning for Energy and the Environment, Vol. 42_1, 211–238.
doi: 10.13052/spee1048-5236.42111
© 2022 River Publishers