Environment Pollution Analysis on Smart Cities Using Wireless Sensor Networks
Qing Song Zhang
School of Artificial Intelligence, Chongqing Creation Vocational College, Chongqing, 402160, China
E-mail: QingSongZhang2021@126.com
Received 08 January 2022; Accepted 17 February 2022; Publication 28 December 2022
Abstract
One of the numerous independent sensing devices in this sector, WSNs can monitor physical and environmental parameters and thousands of applications in other disciplines. A large environmental change has numerous harmful repercussions on human beings, such as air pollution. Using a cloud that communicates through wireless sensor networks (WSNs), environmental factors such as pollution can be monitored with greater precision. If cities are considered smart, they will have to address air pollution, a significant environmental problem in cities. It negatively impacts human health, discouraging individuals from relocating to cities, resulting in a lack of economic development. This means that WSN nodes could monitor the pollution levels in and around the city and along major thoroughfares. In this paper, wireless sensor network-based environmental pollution analysis (WSN-EPA) has been suggested to reduce air pollution in a smart city. WSN nodes have been installed to continuously monitor the city’s air quality levels and the movement of public transit vehicles. Passenger vehicles and public transit buses return to their original locations after passing through stationary nodes across the city with data on air pollution particles, such as gases, smoke, and other pollutants, collected by sensors onboard. Nodes on public transportation, buildings, and automobiles wirelessly gather data from stationary nodes. Once the nodes returned to the pollution monitoring system, the data would be processed. The findings show that the suggested system is a visually effective environmental monitoring system.
Keywords: Air pollution, water pollution, noise pollution, smart city, environment monitoring system, cloud, wireless sensor network.
1 Overview of Environment Pollution Analysis in the Smart City
City resources can be better managed in smart cities using contemporary sensors, information, and communication technology [1]. Residents and companies will benefit from various services ranging from health care to environmental sustainability, law enforcement, and community development [2]. In smart cities, sensor networks play a critical role because the data they collect is essential to the services they provide [3]. Using low power consumption and low maintenance costs, wireless sensor networks (WSNs), which can be established with very inexpensive and compact sensors, are particularly useful because they can be deployed in many different places [4]. Using WSNs in smart cities can reduce pollution, improve waste management, monitor the structural health of buildings, optimize traffic flow, monitor parking, and monitor the environment [5]. Building systems that can combine data from various sources, such as a multi-sensor network, is becoming more popular [6]. One of the most critical considerations in ensuring the long-term viability and sustainability of the world’s economy is preserving the environment [7]. Essential services such as water and electricity, as well as government services such as garbage collection and recycling, should be provided in an efficient manner in a smart city. (ii) a system for matching supply and demand of surface transportation services to ensure traffic delays roads and short wait time is the major resource.
The well-being of humankind and the progress of any nation depends on a pollution-free and hazardous-free environment [8]. Any country’s citizens need constant surveillance to ensure their well-being [9]. Environment monitoring (EM) includes disaster preparation and management, pollution control, and effective problem-solving in the face of harmful situations outside of one’s control [10]. EM investigations include water contamination, air pollution, harmful radiation, weather fluctuations, and earthquakes [11]. To maintain the environment for a healthy society and a healthy planet, the job of EM is to address the many elements that create pollution, some of which are artificial and others of which are natural [12]. Sensors, information, and communication technology can better manage city resources in smart cities. From health care to environmental stewardship to law enforcement to neighborhood revitalization, a wide range of services will be available to residents and businesses.
Environmental monitoring (EM) has become a smart environment monitoring (SEM) system as technology, notably WSN, has evolved, enabling EM systems to monitor environmental parameters with more accuracy and to reduce pollution and other undesired environmental consequences [13, 14]. Traditional techniques of creating and planning urban settings are being replaced by the design of smart cities [15]. As part of the planning process for smart cities, wireless networks are used to monitor the amount of vehicle pollution in the city [16]. Wireless sensor networks (WSNs) are sophisticated sensors that use the cloud to monitor and regulate them [17]. It has been shown that using cloud-connected devices in WSNs can enhance waste management, vehicle identificationtemperature control, and pollution avoidance [18, 19]. Recently, a number of SME technologies have been reported in the literature, including satellite imaging, remote sensing, mobile health monitoring systems, and WNS-based environment systems [20]. While EM systems have been around for some time, they have evolved into smart environment monitoring (SEM) systems that can monitor environmental parameters with greater accuracy even while reducing pollution and other undesirable environmental consequences. Instead of using traditional urban design and construction methods, smart cities are taking their place.
A wide range of environmental parameters, including water quality, temperature, air quality, and more, are recorded, monitored, and regulated using sensors and devices in this article, and the WSNs connect those data. Smart environment systems can be simply comprehended with a wireless sensor network based on environmental pollution analysis. As a result, researchers have defined protocols and standards for WNS-based EPA systems, which are necessary for proper SEM systems when wireless devices are deployed through WSNs. Existing smart city services that concentrate on air quality monitoring are critical, such as monitoring the strength of a city’s living environment, monitoring weather and garbage, monitoring traffic, monitoring noise, and managing energy usage. The most pressing issue is the control of the many sensors that have been put in place to gather reliable data. When it comes to implementing smart cities, privacy and security are two of the biggest ethical concerns. Intimidation and fraud are a few consequences of a lack of security.
• Despite advances in WSN technology, the generation, recording, maintenance, and processing of data in certain smart city resources can be extremely expensive and time-consuming. These resources are essential for capturing, implementing, and interpreting data.
• Real-time ozone, particulate matter, carbon monoxide, sulphur dioxide, and nitrous oxide data are vital factors for regulating air pollution and preventing negative impacts.
• This paper’s environmental pollution prevention and control system has been shown through experiments to be capable of automatically completing the detection, prevention, and control of urban environmental pollution, reducing the need for human and material resources while increasing pollution prevention and control efficiency
The remainder of the WSN-EPAcan be arranged accordingly. Section 2 describes the related study of environmental pollution analysis, and Section 3 summarizes the proposed study that has been utilized in this paper. The numerical results are reported in Section 4. Finally, Section 5 concludes this study with a detailed discussion of the observation and results.
2 Related Work
An investigation of wireless sensor networks (WSNs) for environmental monitoring of a smart vehicle monitoring system. The sensors were attached to the vehicle, with more than 20 movable nodes, to measure the atmosphere’s humidity, temperature, CO, and NO2 levels. It is possible to reduce pollution, improve waste management and monitor the structural health of buildings by implementing WSNs in smart cities. The development of multi-sensor networks and other systems that can combine data from multiple sources is growing in popularity. Ecological preservation is a key factor in ensuring long-term global economic viability and sustainability.
In modern years, the Internet of Things (IoT) was already implemented by several prominent cities to renew economic growth and increase their worldwide resistance to climate change [21]. Using sensors, data, application, and organizational forms to make cities more adaptable and sustainable in the face of global climate change, this study introduces the notion of the smart city. It was then proposed that public-private collaboration networks be built, that smart city efforts and investments should be encouraged, and that greater focus should be placed on smart services. Wireless sensor networks (WSNs) are high-tech sensors that use the cloud to monitor and control them. The use of cloud-connected devices in WSNs has been shown to improve waste management, vehicle identification, temperature control, and pollution avoidance. These technologies include satellite imaging and remote sensing, mobile health monitoring; WNS-based environment systems; and WNS-based remote sensing.
The smart city utilizes information and communication technology (ICT) to meet the rising issues of urbanization by advancing sustainable development practices [22]. Privacy, security, secrecy, and authenticity are critical requirements for smart city applications, and they play a significant role in the data management interface for this infrastructure. According to the simulation study, the suggested framework was secure, accurate, fast, and scalable.
A community model and Big Data technology (BDT) could accomplish the sustainability required by intelligent city components and increase living standards [23]. A look at how big data could be utilized to create more inventive societies was the focus of this study. It analyses and contrasts several smart cities and big data concepts and examines the potential, problems, and advantages of using big data systems in smart cities. Additionally, it aims to establish standards for developing new municipal services based on big data.
Resilience in a smart city can be achieved by analyzing all the data created by the city, which allows for a new level of effective implementation [24]. An innovative full-stack solution based on the Internet of Everything (IoE) and massive multimedia data in smart cities was presented in this paper to manage the resilience of urban transportation systems (UTS), one of the city’s most essential infrastructures. Various types of data created in the smart city were proposed, as well as big data gathering and semantic enrichment.
A smart city was a place where information, digital, and telecommunications technologies were used to make networks and services more adaptable, effective, and long-lasting for the benefit of the city’s residents. As the idea of a city serving as a platform for IoT platforms, open data, and artificial intelligence grows in popularity, it is clear that cities must have effective management systems (EMS) [25]. One example of an effective crowd control system, installed and administered through a platform that gives several options for administering the information gathered in smart territories and cities, could be found in this use case.
The WSN-EPAhas been proposed to enhance environmental monitoring, analysis of air pollution, smart waste management, development ratio, and reduce noise pollution. The following section discusses the proposed WSN-EPA model briefly.
3 Proposed Method: Wireless Sensor Network Based Environmental Pollution Analysis
Environmental pollution is defined as substances that disrupt, harm, or disturb the physical and biological systems in the immediate surroundings. A wide range of agricultural pollutions damages crops, including dangerous gases, dirty water, and other environmental pollutants. Air pollution, which has been linked to a wide range of health problems in humans, is the primary focus of this research. One of the most significant factors in human health and environmental issues is air pollution, which includes a variety of dangerous gases, chemicals, and small dust particles. Vehicle and industrial emissions and volatile organic compounds are the most common sources of these pollutants. As one of the most serious threats to human health, air pollution should be eliminated as a fundamental need for optimum health.

Figure 1 Smart environment monitoring.
Using mobile sensors, they investigated the idea of a mobile sensor network for smart city environmental monitoring and how mobility affects measurement precision. Figure 1 shows the smart environment monitoring system. Various data sources, including objective (from sensors) and subjective (from residents), are combined to create meaningful indicators and open a dialogue between the general public and local government officials. Air quality index (AQI), thermal comfort index (TCI), and traffic index (TI) indicators, which are computed using solely objective data, are then given to various user groups: people, scientists, and municipal authorities. In addition, residents’ subjective data is incorporated into the objective data through the smart citizen (mobile social network) MSN program. Among the environmental indicators collected by the sensor array are carbon dioxide (CO2), unburned hydrocarbons (HC), ozone (O3), and particulate matter (PM) pollutants. The AQI, TCI, and TI indicators, which are based solely on objective data, are then distributed to various user groups, including the general public, scientists, and municipal authorities. A smart citizen (mobile social network) MSN program incorporates residents’ subjective data into objective data.
It is possible to extend and supplement smart city environmental monitoring using mobile sensor nodes, which are inexpensive and easy to maintain; high spatial and temporal resolution can be achieved; the nodes can be maintained without the intervention of specialized technicians in potentially distant locations; malfunction nodes can be detected and eliminated, and the nodes can be replaced if they fail. As a real-world test-bed to determine whether or not sensor node mobility affects measurement quality, the city of Pisa has compared data gathered by fixed and mobile sensor nodes installed in a smart, healthy environment (SHE). Some of the challenges of MSN are, Online vs. Real Life., an increase in the amount of time spent using the service, cyberbullying, social anxiety disorder, and depression are all linked to online behavior, addiction to social media is a common occurrence.
Pollutant concentrations in the air are measured using the level of air quality is given as,
| (1) |
As shown in Equation (1), there is an immediate difference between the highest and lowest values, and respectively. is the least polluted of all the sensors, whereas is the most polluting. As shown in Equation (1), the least polluted sensor has the lowest LAQ values, whereas the most polluted sensor has the highest. The actual truth about an area’s air quality can be obtained through pollution sensors and the measurements they produce.
Pollution sensors DNE and their subsequent measurements in the areas can provide the ground truth for the air quality of a certain area is defined as,
| (2) |
As shown in Equation (2), according to DNE, the model accuracy is measured against the model actual truth.
The proposed method developed three indices based on sensor data to make the data easily understandable to the general public: the air quality index (AQI), the thermal Comfort index (TCI), and the traffic index (TI). An extra sensor network in Pisa, controlled by Pisa Mobility (PisaMO), provides the last piece of the puzzle. Indexes are shown in simple visual indications when a person visits the page. Consequently, professionals can utilise data to conduct in-depth studies and aid the decision-making process. Experts, such as local governors and researchers, can use data to find long-term trends and assist scientific analysis. Rather than relying on specialized technicians in remote locations, the nodes can be checked for problems and repaired or replaced if necessary, without the need for outside help. Sensor node mobility has been tested in the real world by the city of Pisa, which installed fixed and mobile sensors in a smart, healthy environment to see if this affects measurement quality.
Electromagnetic (EM) investigations include water contamination and air pollution, harmful radiation weather fluctuations, and earthquakes. Many factors contribute to pollution, some of which are man-made while others are natural, and EM is responsible for maintaining a healthy environment for society and the planet.
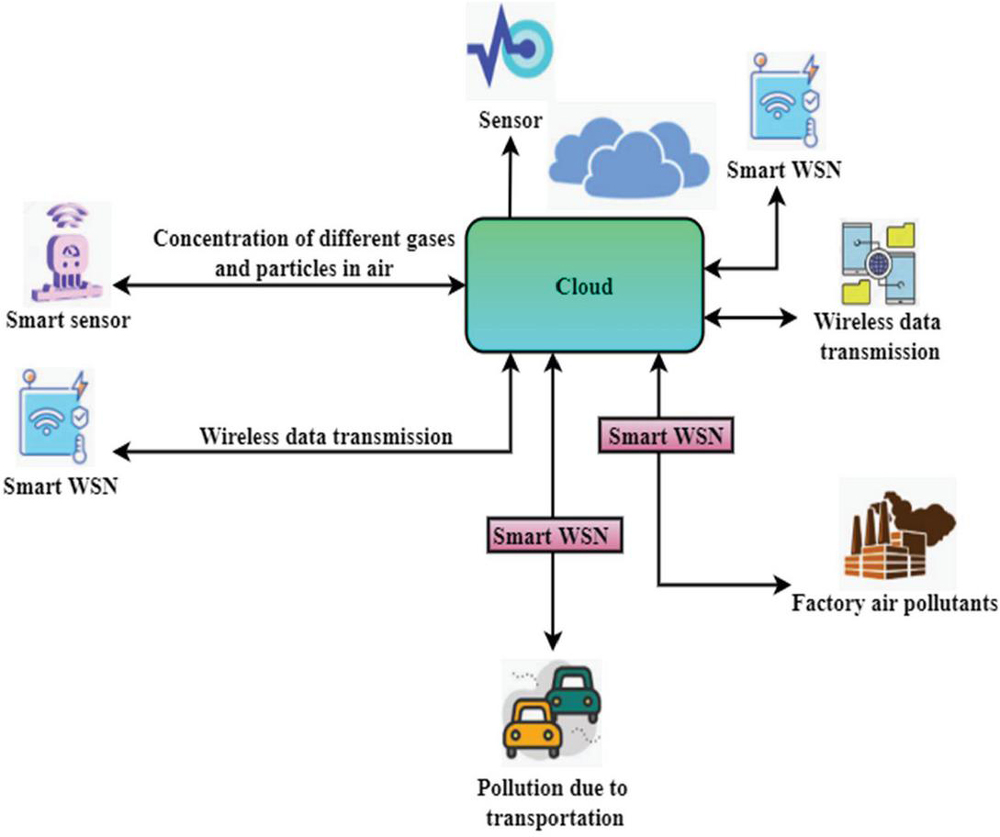
Figure 2 Wireless sensor network-based environment pollution analysis.
Figure 2 shows the wireless sensor network-based environment pollution analysis. The system’s core is a wireless sensor network (WSN), which serves as the interface between sensors and the data they collect. An excellent example of a smart city using an SEM system to maintain a safe and comfortable environment for its citizens. One of the most critical components in ensuring the long-term viability and sustainability of the global economy is preserving and protecting the environment. Environments that are pollution-free and hazard-free are crucial to human health and the growth of any country. As a result, professionals can use data to conduct in-depth studies and assist in decision-making. Researchers and experts, such as local governors, can use data to identify long-term trends and assist in conducting scientific research.
Consequently, any nation’s population must have access to a healthy environment. Environment monitoring (EM) includes disaster planning and management, pollution control, and effective problem-solving in the face of harmful situations. Ecology and the environment (EM) are concerned with all of these things and other natural disasters and weather variations. To maintain the environment for a healthy society and a healthy planet, the job of EM is to address the many variables that create pollution, some of which are artificial and others natural. As a result, a safe and healthy environment is a basic human right for the people of every country. Environmental monitoring (EM) encompasses a wide range of activities, from disaster preparedness and response to pollution reduction and problem-solving in the face of potentially hazardous situations. Everything from natural disasters and weather patterns to human-induced climate change is covered by ecology and the environment (EM).
An excellent example of a smart city using an SEM system to ensure the safety and comfort of its residents. Environment conservation is an essential part of ensuring the global economy’s viability and sustainability in the long term. Clean, safe environments are essential for everyone’s health and the development of any nation. A virtual line VL referred to access, is used to evaluate traffic flow in cities, and the index uses that assumption to predict traffic flow is stated as
| (3) |
As shown in Equation (3), variables are utilized to modify the scenario to the real circumstance , a unit of measure for this index . Monitoring the environment in which collections are housed is critical to gaining insight into and evaluating the conditions they are kept. Using data gathered from environmental monitoring, people can establish a baseline for the current conditions in which collections are housed.
A time-series model is used to simulate the system’s prospective behavior to provide short-term predictions and prediction ranges for the stressor is defined as,
| (4) |
As shown in Equation (4), indicates the estimation errors, represent the least-squares approximation and is the vector of parameters. By releasing pollutants into the air, water, and land, pollution affects the Earth’s land, air, and water. Smog, polluted air, and poisonous gas emissions are some forms of pollution that end up in the atmosphere. Human activity can be a cause of contamination, in addition to natural sources.
Smart city designs are replacing traditional techniques of creating and planning urban settings. Wireless networks aid in monitoring the city’s level of vehicle pollution in the planning of smart cities. Sustainable agriculture, economic prosperity, and a healthy society depend on a healthy environment, so environmental protection is a top priority worldwide. Consequently, the fundamental objective of SEM is to deal with environmental problems through smart monitoring to govern all essential development indicators, including social health. For example, there are several uses for environmental monitoring technologies, including weather forecasting and air pollution management and water quality control and monitoring. Agriculture, human beings, or any other creatures on the planet are the primary beneficiaries of this effort. Sensors and wireless networks have simplified environmental monitoring. As a result of technological advancements, the traditional methods of designing and planning cities are being phased out. Using wireless networks, planners of smart cities can monitor the city’s level of car pollution. Environmental protection is a top priority worldwide because sustainable agriculture, economic prosperity, and a healthy society all depend on a healthy environment.

Figure 3 Structure of air pollution.
Figure 3 shows the structure of air pollution. A smart city’s data gathering layer collects data from various linked devices. Ozone, nitrogen dioxide, sulfur dioxide, and particulate matter are all measured by sensors throughout the city. There are a lot of data sources; thus, the collecting and aggregation process takes place in this area. Pre-processing and filtering are done here since the data can be in various forms. Pre-processing is the process of identifying and removing extraneous data. An intermediary communication layer must move data collected by the collecting layer to the next layer. LTE, Wi-Fi, gateways, and other communications technology make up this layer. This is where all sensor data is sent to the data processing layer. For gateways that can handle real-time processing, this layer can be employed. Fog Latency can be improved by using computing. Real-time decisions can be made at this location. Data management is the primary layer that stores and analyses information. It is possible to mix several third-party technologies here since real-time processing is necessary for analysis. Examples are Spark, Volt Db, Storm, and other real-time processing tools. The data collection layer of a smart city gathers data from numerous linked devices like sensors.
Prediction error distribution function that generates additional noise instances is given as
| (5) |
As shown in Equation (5), short-term predictions , the noise has a well-defined distribution , the purpose of the indication and size of the sample.
Dispersed data interpolation can be done efficiently using distance measures is described as
| (6) |
As shown in Equation (6), a weighted average is used to interpolate the value for a query point , with weights using a distance-based function and monotonically declines with the range between and . The characteristics of the environment include,
• External forces in their entirety
• Practical and Strategic Forces
• interconnectedness,
• Dynamic Nature
• Lack of clarity
Complexity
A large quantity of data can be stored in a wireless sensor network using this layer. Other systems can be used to query and analyze historical data. This layer is used for both in-memory and offline data analysis. The ability to predict and identify patterns occurs at this level. The application layer serves as a gateway to all of the significant information. For the sake of the real-time devices, all events created by this layer will be sent to them. This layer is used to present data and reports in charts and dashboards. Those responsible for monitoring pollution can be the primary beneficiaries of this layer’s functionality. Using this information, significant judgments can be made. This layer is capable of broadcasting all pollution-related data. It’s the place where individuals get information about pollution and make choices about how to reduce it.
As a gateway to all important data, the application layer serves as the application layer. For the benefit of the real-time devices, all events generated by this layer will be sent. Charts and dashboards are created using this layer to display data and reports. One of the primary benefits of using this layer is that it can help monitor pollution.
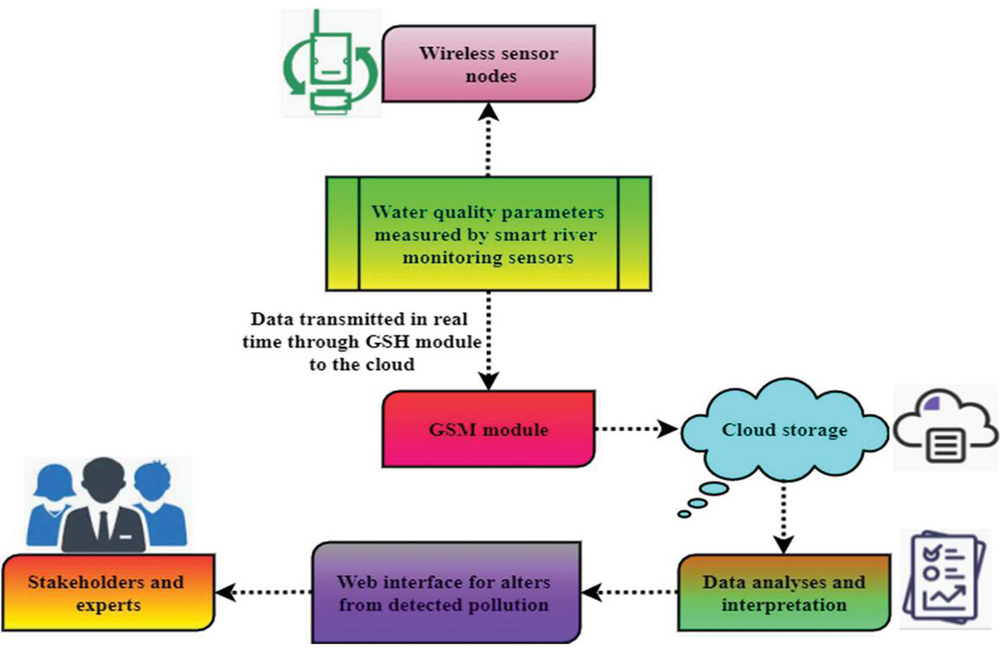
Figure 4 Monitoring water quality process.
Figure 4 shows the monitoring water quality process. Gateway nodes link each sensor node directly to the base station to reduce latency. The sensing, processing/computing, power, and communication subsystems comprise the sensor hardware architecture. Sensor probes are critical to the sensing subsystem’s ability to gather data from the area of interest. The processing subsystem consists of the raw data collection, data processing, and data analysis components. The power subsystem monitors and controls the sensor node’s power usage. Using a SIM card for GSM connectivity is possible with the 4G model’s GPS, allowing methods to develop real-time surveillance. This area can focus on sensor devices, validation, and the cloud-based web portal architecture for reporting and analyzing data from the deployment environment. Because of its capacity to offer real-time information to stakeholders, wireless sensor networks are useful for smart city water quality monitoring purposes. The Network sensor layer is used to create charts and dashboards for displaying data and reports. This layer’s capabilities can be most useful for those in charge of monitoring pollution. Significant conclusions can be drawn from this data. Pollution data can be transmitted using this layer. It’s a place where people can learn more about pollution and decide what they can do to help reduce it.
An air pollution online service has been created enabling the user to monitor air pollution metrics is stated as,
| (7) |
As shown in Equation (7), denotes the user interface, indicates the device status, and real-time data storage through the server.
Air pollution had no impact on healthy people during the test days since the air quality is at a high enough level is defined as,
| (8) |
As shown in Equation (8), a smart city’s current services for measuring the strength of living , and weather monitoring .
An intelligent online site has been developed to collect, model, store and retrieve data and information from sensor devices in real-time, alter, analyze and visualize it. It is possible to do this by employing online portals and SMS notifications. The sensor node’s power consumption is tracked and managed using a power subsystem. Allowing real-time surveillance, the 4G model’s GPS can be used to connect to GSM networks. Sensors, validation, and a cloud-based web portal architecture for reporting and analyzing data from the deployment environment can all be included in this section.
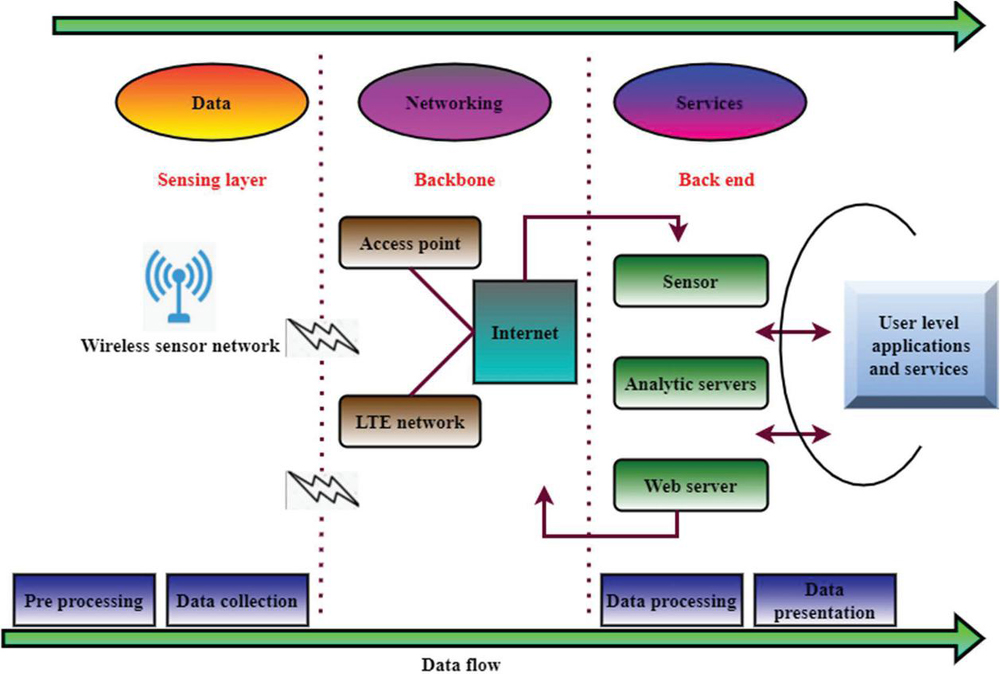
Figure 5 Smart City design for noise pollution through the sensor network.
Figure 5 shows thesmart city design for noise pollution through a sensor network. The sensing layer gathers and pre-processes data, including sound volume, position, time, and local news reports in the testing city. The layer is responsible for starting wireless sensor network connections between neighboring nodes. Additionally, the sensing layer handles reporting non-functioning nodes for repair or replacement. The nodes do not have a fixed position and instead rotate to cover a large region and projected areas. The backbone layer acts as a conduit to move data from one node to another and from one backend layer to the other. The backbone can use crowdsourced nodes if a node fails to communicate using RFID technology since crowdsourcing/crowdsensing in detecting noise pollution has shown to be an efficient approach for minimizing noise pollution. Backend layers are organized into two levels: data storage and processing and operator access. Suppose a node fails to communicate using RFID technology. In that case, the backbone can use crowdsourced nodes since crowdsourcing/crowdsensing in detecting noise pollution has proven to be an effective approach for reducing noise pollution. Layers in the backend are divided into two categories: storage and processing of data and access by the operator.
As well as data analysis and preparation for the high level and high level, where user-level applications and services are delivered, here is where it all begins. The backend layer handles the communication between the nodes and the services for real-time data streaming and reporting. In urban development, the term smart city refers to integrating Information and Communication Technology (ICT) in a safe way to manage city assets and enable impoverished urban planned communities to solve various issues, such as noise pollution. Noisy environments negatively influence the health and well-being of humans and other animals. It uses architecture to understand better where and when noise pollution is a problem and address it. Smart waste management, development ratio, environmental monitoring, air pollution analysis, and noise pollution reduction are all improved by the method proposed.
Machines and transportation systems, such as automobile engines and railway engines, are the primary sources of outdoor noise across the globe. There is a direct correlation between noise pollution and the health of cities. Noise pollution can cause a wide range of health issues, including cardiovascular consequences in people, an increased chance of mortality, and irreversible hearing loss. It is widely accepted that poor urban design contributes to noise pollution. The architecture helps cities identify where noise pollution needs to be mitigated and at what times of the day and night noise pollution is most prevalent to overcome poor urban planning. The suggested method improves the environment monitoring, analysis of air pollution, smart waste management, development ratio, and reduces noise pollution.
4 Result and Discussion
Autonomous nodes are small, efficient, and economical in wireless sensor networks (WSNs). Real-time monitoring is a primary use for sensor networks. Sensors have become more affordable, smaller, and more power-efficient due to advancements in sensing, processing, and communication technology. System performance is still influenced by unit processing speed, memory capacity, and communication reliability. Resilience and energy efficiency are essential for sensor networks. It is necessary to make design and device upgrades to extend the lifespan of wireless sensor networks (WSNs) in the network. Wireless sensor networks are used for traffic congestion monitoring, catastrophe alerts, residential and medical applications, and more. The proposed method analyzes the environment monitoring, analysis of air pollution, smart waste management, development ratio, and noise pollution.
Table 1 Environment monitoring in the smart city
| Year | IoT | BDT | WSN-EPA |
| 2016 | 48.1 | 62 | 80.2 |
| 2017 | 56 | 63.7 | 85.7 |
| 2018 | 60.8 | 66 | 87.1 |
| 2019 | 52.7 | 68.4 | 79.7 |
| 2020 | 53 | 72 | 93 |
| 2021 | 58 | 75 | 98.9 |
Table 1 shows the environment monitoring in a smart city. Tools and procedures used to examine an environment, define its quality, and create environmental parameters are called environmental monitoring tools and techniques. Ensuring that an organization’s operations do not harm the natural environment and human health is the primary goal of environmental monitoring, which can be performed for a number of reasons in the smart city. For environmental monitoring to be accurate and cost-effective, the development of sophisticated, automated monitoring applications and devices is essential as human populations, industrial activities, and energy consumption continues to expand. Programs for monitoring are outlined in a company’s internal publications. They include information on what is being monitored, the general goals, the suggested sampling techniques, the projects within each strategy, and the periods for each of them. The suggested technology improves environmental monitoring by 98.9% in 2021 compared to existing approaches. Reports on risk assessment, environmental monitoring, and effect assessment are produced based on the data obtained, processed statistically, and published.
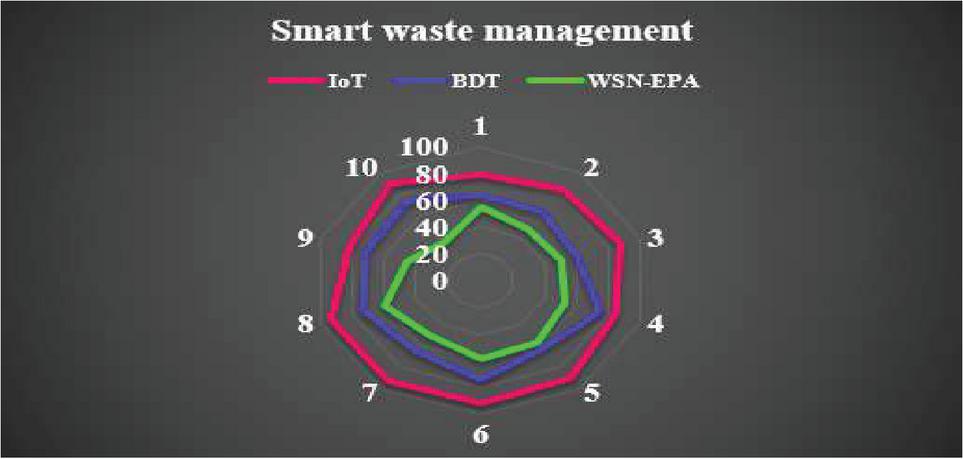
Figure 6 Analysis of smart waste management.
Figure 6 shows smart waste management. The use of sensors to monitor waste bin fill levels is now the most common smart waste management technology method. The Cloud is used to analyze and analyze the data collected on the ground. Trash collection and truck routes can be planned and improved using this data. A large part of the time and money spent on waste management is technology. To create better ways to manage solid waste, users need to use sensor-based technology. That means less time on the road for trucks, less demand for human resources, and fewer emissions from fuel. Treatment of solid and liquid waste is part of waste management, and it provides several options for recycling materials that aren’t considered garbage throughout the treatment process. This includes the following activities: trash collection and transportation; treatment and disposal of waste; regulatory oversight; and monitoring.
Table 2 Analysis of air pollution
| Year | IoT | BDT | WSN-EPA |
| 2016 | 45.4 | 63.5 | 83 |
| 2017 | 54 | 67 | 90.8 |
| 2018 | 51 | 70 | 84 |
| 2019 | 46 | 63 | 90 |
| 2020 | 53 | 66.9 | 81.2 |
| 2021 | 44 | 60.8 | 97.5 |
Table 2 shows the analysis of air pollution. Using sensors, air pollution can be monitored in real-time, allowing for more precise data collection. Automated systems utilizing wireless sensor networks analyze large amounts of data to make better predictions about where bad air quality is most likely to occur. Carbon monoxide emissions from city traffic are very concentrated. Nitrogen oxide, sulfur dioxide, and hydrocarbons are among the other main pollutants produced by automobiles and manufacturing facilities. Smog, a thick layer of polluted air, is created when these chemicals combine with sunlight. The built environment, such as the heating of buildings, construction, and transportation associated with it, accounts for almost 97.5% of the particulate matter polluting the air. Compared to the existing methods, the proposed method enhanced the analysis of air pollution in 2021.
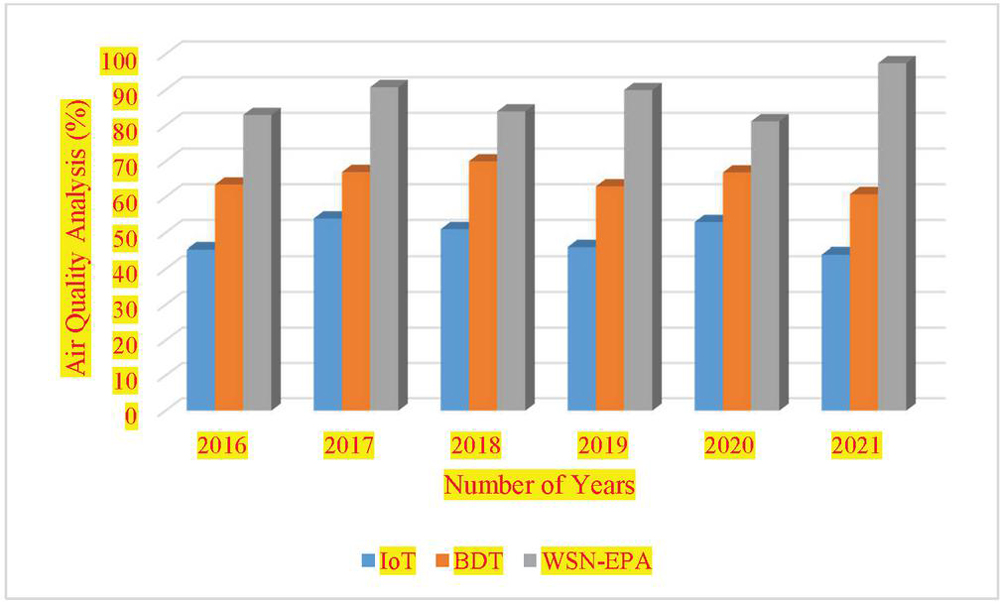
Figure 7 Air quality analysis.
In Figure 7, air pollution is examined. To collect more precise data, air pollution can be monitored in real-time using sensors. Large amounts of data are analyzed by automated systems using wireless sensor networks to predict where poor air quality will occur. The amount of carbon monoxide emitted into the air due to automobile traffic is staggering.
Table 3 Noise pollution in smart city
| Year | IoT | BDT | WSN-EPA |
| 2016 | 77 | 72 | 57 |
| 2017 | 92 | 78 | 58 |
| 2018 | 92.3 | 68.2 | 51.8 |
| 2019 | 93 | 74.1 | 49.7 |
| 2020 | 89 | 79.8 | 45.6 |
| 2021 | 98.7 | 65 | 37.5 |
Table 3 shows noise pollution. It is defined as any noise harmful to humans, animals, or the environment. Sound intensity or loudness can be measured in decibels (dB), the most often used unit. Noise pollution can be controlled by increasing the number of trees surrounding public spaces to absorb sound and lessen the negative impacts. Wearing earplugs, earmuffs, or noise helmets is necessary for those who work in loud environments, such as factories or construction sites. To protect human health and well-being, noise control is necessary. Setting permissible exposure limits and encouraging noise monitoring and control in environmental health programs are two specific noise management objectives.
Table 4
| Year | IoT | BDT | WSN-EPA |
| 2016 | 65 | 78 | 82 |
| 2017 | 53 | 62 | 88 |
| 2018 | 69 | 77 | 92 |
| 2019 | 66 | 79 | 81 |
| 2020 | 49 | 88 | 91.1 |
| 2021 | 51 | 72 | 98.2 |
Table 4 shows the development ratio. Cities that have invested in technological infrastructure that enables them to collect, analyze and use real-time data to improve the lives of their residents are known as smart cities. Developing smart cities is part of the larger notion of sustainable pro-ecological development based on utilizing current, innovative information technology and ecology. People’s lives can be improved, and their happiness increased due to the development of smart cities in this manner. Solutions like air quality monitoring, energy usage optimization, and garbage tracking can be implemented in a smart city. For example, smart cities can decrease greenhouse gas (GHG) pollution by lowering energy use and emissions. Electricity and heat generation contribute to global greenhouse gas emissions. The creation of smart and sustainable cities is driven primarily by reducing greenhouse gas emissions. Among the most significant benefits are the enhancements to energy storage and efficiency, waste management, and traffic flow. One of the repeating themes in smart cities is intelligent grids and water management systems. The proposed method evaluated the environment monitoring, analysis of air pollution, smart waste management, development ratio, and noise pollution reduction. Even though agriculture’s negative effects on the environment can be severe, including soil and water pollution and air pollution, this can have positive effects, such as capturing greenhouse emissions within plants and soils or reducing flood hazards through the use of specific farming practices.
5 Conclusion
Mobility and other variables, such as the height of the mobile sensor, can lead to an acceptable measurement error in air quality monitoring in smart cities. This can be compensated for by enlarging the monitoring area with minimal costs. The WSN-EPA network has been used to construct air pollution monitoring devices for smart cities, as described in this study. WSN-EPA module, database, and online monitoring are all part of the creation of the system, which includes air detecting sensors and a microcontroller. Air pollution monitoring stations are not practicable because of the high cost. Low-cost sensors that can monitor critical effects affecting air pollution, such as weather and traffic, can be deployed in areas where monitoring stations are not feasible. Consequently, the recommended approach can be applied to infer the air quality of any road or section of a city for any application that demands a precise and real-time evaluation of air quality with little cost infrastructures. A smart multi-sensor detection system for real-time air pollution monitoring through the WSN-EPA network has been created in this study because of the importance of air pollution in smart cities. The experimental outcome of the proposed method improves the environment monitoring, analysis of air pollution, smart waste management, development ratio, and noise pollution reduction. For areas where the high cost of air pollution monitoring stations makes them unfeasible, low-cost sensors that can monitor important factors affecting air pollution such as the weather and traffic are an alternative.
References
[1] Khan, S., Nazir, S., García-Magariño, I., and Hussain, A. (2021). Deep learning-based urban big data fusion in smart cities: Towards traffic monitoring and flow-preserving fusion. Computers & Electrical Engineering, 89, 106906.
[2] Zhang, Y., Geng, P., Sivaparthipan, C. B., and Muthu, B. A. (2021). Big data and artificial intelligence-based early risk warning system of fire hazard for smart cities. Sustainable Energy Technologies and Assessments, 45, 100986.
[3] Rubí, J. N. S., and de Lira Gondim, P. R. (2021). An IoT-based platform for environment data sharing in smart cities. International Journal of Communication Systems, 34(2), e4515.
[4] Tekouabou, S. C. K. (2021). Intelligent management of bike-sharing in smart cities using machine learning and the Internet of Things. Sustainable Cities and Society, 67, 102702.
[5] Kandt, J., and Batty, M. (2021). Smart cities, big data and urban policy: Towards urban analytics for the long run. Cities, 109, 102992.
[6] Yigitcanlar, T., Kankanamge, N., and Vella, K. (2021). How are smart city concepts and technologies perceived and utilized? A systematic geo-Twitter analysis of smart cities in Australia. Journal of Urban Technology, 28(1–2), 135–154.
[7] Abu-Rayash, A., and Dincer, I. (2021). Development of integrated sustainability performance indicators for better management of smart cities. Sustainable Cities and Society, 67, 102704.
[8] Simonofski, A., Vallé, T., Serral, E., and Wautelet, Y. (2021). Investigating context factors in citizen participation strategies: A comparative analysis of Swedish and Belgian smart cities. International Journal of Information Management, 56, 102011.
[9] Belhadi, A., Djenouri, Y., Srivastava, G., Djenouri, D., Lin, J. C. W., and Fortino, G. (2021). Deep learning for pedestrian collective behavior analysis in smart cities: A group trajectory outlier detection model. Information Fusion, 65, 13–20.
[10] Arun, M., Barik, D., Sridhar, K.P. and Vignesh, G., 2022. Performance Analysis of Solar Water Heater Using Al2O3 NanoParticle with Plain-Dimple Tube Design. Experimental Techniques, pp. 1–14.
[11] Kim, H., Choi, H., Kang, H., An, J., Yeom, S., and Hong, T. (2021). A systematic review of the smart energy conservation system: From smart homes to sustainable smart cities. Renewable and Sustainable Energy Reviews, 140, 110755.
[12] Zekić-Sušac, M., Mitrović, S., and Has, A. (2021). Machine learning-based system for managing the energy efficiency of the public sector as an approach towards smart cities. International journal of information management, 58, 102074.
[13] Bibri, S. E. (2021). A novel model for data-driven smart, sustainable cities of the future: the institutional transformations required for balancing and advancing the three sustainability goals. Energy Informatics, 4(1), 1–37.
[14] Shen, M., Liu, A., Huang, G., Xiong, N. N., and Lu, H. (2021). ATTDC: An Active and Traceable Trust Data Collection Scheme for Industrial Security in Smart Cities. IEEE Internet of Things Journal, 8(8), 6437–6453.
[15] Lv, Z., Chen, D., and Li, J. (2021). Novel system design and implementation for the smart city vertical market. IEEE Communications Magazine, 59(4), 126–131.
[16] Drangert, J. O. (2021). Urban water and food security in this century and beyond: Resource-smart cities and residents. Ambio, 50(3), 679–692.
[17] Cai, Z., Li, D., Deng, L., and Yao, X. (2021). Smart city framework based on intelligent sensor network and visual surveillance. Concurrency and Computation: Practice and Experience, 33(12), e5301.
[18] Alazab, M., Lakshmanna, K., Reddy, T., Pham, Q. V., and Maddikunta, P. K. R. (2021). Multi-objective cluster head selection using fitness averaged rider optimization algorithm for IoT networks in smart cities. Sustainable Energy Technologies and Assessments, 43, 100973.
[19] Cha, J., Singh, S. K., Kim, T. W., and Park, J. H. (2021). Blockchain-empowered cloud architecture based on secret sharing for a smart city. Journal of Information Security and Applications, 57, 102686.
[20] Hajjaji, Y., Boulila, W., Farah, I. R., Romdhani, I., and Hussain, A. (2021). Big data and IoT-based applications in smart environments: A systematic review. Computer Science Review, 39, 100318.
[21] Song, T., Cai, J., Chahine, T., and Li, L. (2021). Towards smart cities by the Internet of Things (IoT)—a silent revolution in China. Journal of the Knowledge Economy, 12(2), 1–17.
[22] Chen, J., Ramanathan, L., and Alazab, M. (2021). Holistic, big data integrated artificial intelligent modeling to improve privacy and security in data management of smart cities. Microprocessors and Microsystems, 81, 103722.
[23] Ageed, Z. S., Zeebaree, S. R., Sadeeq, M. M., Kak, S. F., Rashid, Z. N., Salih, A. A., and Abdullah, W. M. (2021). A survey of data mining implementation in smart city applications. Qubahan Academic Journal, 1(2), 91–99.
[24] Bellini, E., Bellini, P., Cenni, D., Nesi, P., Pantaleo, G., Paoli, I., and Paolucci, M. (2021). An IoE and Big Multimedia Data Approach for Urban Transport System Resilience Management in Smart Cities. Sensors, 21(2), 435.
[25] Garcia-Retuerta, D., Chamoso, P., Hernández, G., Guzmán, A. S. R., Yigitcanlar, T., and Corchado, J. M. (2021). An Efficient Management Platform for Developing Smart Cities: Solution for Real-Time and Future Crowd Detection. Electronics, 10(7), 765.
Biography

Qing Song Zhang, male, was born in July 1980. His title is Associate Professor. He graduated from Sichuan University in 2011, majoring in Electrical Engineering and automation. Now he is working in Chongqing Creation Vocational College. He mainly engages in the research of electronic information. So far, he has published 8 papers and participated in 2 projects.
Strategic Planning for Energy and the Environment, Vol. 42_1, 239–262.
doi: 10.13052/spee1048-5236.42112
© 2022 River Publishers