Medium- and Long-term Forecast of China’s Electricity Consumption Considering the Fast Growth of New Infrastructure
JunChao Yang1 and Tianfeng Li2,*
1School of Account, Inner Mongolia University of Finance and Economics, Hohhot, China
2School of Economics and Management, Beijing Information Science & Technology University, Beijing, China
E-mail: yjcyjc2022@yeah.net; litanfeng2010@126.com
*Corresponding Author
Received 28 January 2023; Accepted 25 March 2023; Publication 11 July 2023
Abstract
In order to predict China’s electricity consumption demand under situation of fast growth of the new infrastructure, a medium- and long-term electricity consumption demand prediction model based on LEAP is proposed, which calculates the overall electricity consumption of the country according to the activity level and intensity of typical new infrastructure and other sectors. Five different scenarios are set for comparison. The results show that under the basic scenario, China’s electricity consumption will reach 7408 billion kWh in 2035, in which the consumption of new infrastructure accounts for 31.31%.While under the other four scenarios, China’s electricity consumption will reach to the minimum of 7319 billion kWh under the scenario of improvement of energy-saving technology, and the maximum of 7525 billion kWh under the scenario of fast development of the new infrastructure, with higher contributions of the consumption of commercial charging, data centers and 5G base station. Relevant suggestions are put forward from the aspects of new infrastructure construction, development of clean energy and technical standards to reduce the electricity consumption of new infrastructure.
Keywords: New infrastructure, leap model, electricity consumption prediction.
1 Introduction
Since the reform and opening up, China has made great achievements in economic development and maintained rapid economic growth for more than 30 years, which objectively caused great pressure on resources and environment. The need to pursue higher-quality development in the new era has prompted China’s economy to shift from a high-speed growth stage to a high-quality development stage, and the corresponding economic system also needs to shift from a traditional economic system to a modern economic system. The report of the 19th National Congress of the Communist Party of China pointed out that “China’s economy has shifted from a stage of high-speed growth to a stage of high-quality development, and is in a critical period of transforming its development mode, optimizing its economic structure, and transforming its growth momentum” [1]. The important role played by the digital economy in this critical period has become increasingly evident. The scale of the digital economy continues to expand and its contribution continues to increase. In 2019 and 2020, the scale of China’s digital economy reached RMB 35.8 trillion and 39.2 trillion, accounting for 36.2% and 38.6% of GDP respectively [2]. The digital economy is accelerating its take-off against the trend, because it is in line with the current trend of China’s economic development, especially high-quality development [3].
In recent years, the rapid development of the digital economy has promoted the explosive growth of data volume, driving up the energy consumption of data transmission, storage, computing, application links and interconnected equipment to a large extent, and digital infrastructure has increasingly become a major consumer of electricity. New infrastructures, such as 5G base station, new energy vehicle charging piles, big data centers, are all the big electricity consumer, and if the infrastructures cannot overcome the “energy consumption” threshold, it will not only be conducive to the achievement of China’s carbon peak and neutral goal as scheduled, but will also greatly reduce the comprehensive benefits of the new infrastructure.
From the national level, China’s new infrastructure construction has a good foundation for development. In recent years, China has incorporated “new infrastructure” into its national development strategy, and has clearly proposed to build a modern infrastructure system that is intensive, efficient, economical, smart, green, safe and reliable based on the construction of new infrastructure, and the contributions of this figuration in helping China to achieve a high-quality economy has begun to emerge. Scholars have compared the use of digital technologies and responses to COVID-19 in Singapore, Hong Kong and mainland China, and explores the impact of digital infrastructure [4]. The impact of digital surveillance and other digital infrastructures during COVID-19 has also been studied [5]. These studies demonstrate that digital infrastructure plays an important role in times of pandemic. New infrastructure has became the main drive of China’s post-epidemic economic recovery during the “14th Five-Year Plan” period, and the realization of innovative and high-quality development. As a result of this, the new infrastructure is going to be the focus of future investment [6].
The fast growth of new infrastructure will bring great pressure to the current electricity supply, as almost all digital infrastructure is supported by electricity and needs to run 24 hours a day. In particular, the widely used 5G technology has a significant increase in energy consumption per station compared to 4G, and the data centers consume much more electricity than everyday consumer electronics. With the increase of sales of new energy vehicles, the number of charging piles in China is also increasing year by year. Both relevant government departments and private capital are vigorously developing charging piles. The data shows that the total amount of charging nationwide in 2020 will reach 824 million kWh, and the total amount of charging nationwide in the first half of 2021 will be about 921 million kWh. Because of this kind of importance, in December 2021, China’s National Development and Reform Commission and the National Energy Administration officially urged that by 2025, all the data centers and 5G stations should basically form a green and energy-efficient operation pattern, which means the electricity utilization efficiency and renewable energy utilization rate of new infrastructure will be significantly improved [7].
Although scholars have realized the importance of the new infrastructure to China’s future energy consumption pattern, so far there is no specific research to quantify it from the perspective of quantitative analysis, and the purpose of this paper is to solve this problem. The subsequent structure of this paper is as follows: Section 2 introduces the model used in this paper and the structure of the LEAP model under the new infrastructure. Section 3 explains the parameters in the model, Section 4 briefly describes the main scenarios, Section 5 analyzes the model prediction results and Section 6 summarizes the research.
2 Methodology
2.1 LEAP Model
The Long Term Energy Alternative Program (LEAP) system is an integrated energy-economic-environment modeling platform based on scenario analysis. LEAP model is mainly used in national or regional medium- and long-term energy planning to analyze energy demand through energy supply, energy processing and conversion, terminal energy demand and other links. Some scholars have used the LEAP model to conduct energy demand forecasting research. Based on the model, the energy demand and carbon emission trends in Zhangjiakou, Hebei Province were simulated and predicted [8]. Using LEAP, Muhammad et al. simulated Pakistan’s electricity system from 2016 to 2040 and forecast its provincial electricity demand [9]. Some scholars have combined LEAP and other methods to generate a new model to measure energy demand. For example, an integrated approach was developed based on LEAP and LCA to quantitatively assess Jinan’s energy demand and environmental co-benefits under three policy scenarios [10].
Traditional electricity consumption forecasting methods often rely on historical data, while new infrastructure appears late and does not have too much historical data, so it is impossible to use traditional forecasting methods to predict the medium- and long-term electricity consumption of new infrastructure. For this kind of medium- and long-term power consumption prediction with large uncertainty and large time span, simulation has its unique advantages. The simulation, especially bottom-up summation simulation, can accurately describe the overall impact of changes in the power consumption behavior of each unit of the system on the electricity consumption of the entire system. Common bottom-up models include the MESSAGE model, the LEAP model, the AIM/Enduse model, the MARKAL model, and the TIMES model. Except for the LEAP model, most of the other models are optimization models, that is, to optimize the target by minimizing the cost under certain constraints. Therefore these models are not suitable for this study.
LEAP adds up the electricity consumption of each department to calculate the total electricity consumption. The calculation formulas of the electricity consumption of each sector and the total electricity consumption are as follows:
| (1) | ||
| (2) | ||
| (3) | ||
| (4) |
where represents the electricity demand of the i-th new infrastructure, and represent the number and electricity intensity of the i-th new infrastructure respectively; represents the electricity demand of the i-th industry, and represent the share and electricity intensity of the i-th industry respectively; represents the residential electricity demand, represents the per capita electricity intensity; TED is the total electricity demand.
2.2 Structure of the New LEAP Model for China
Figure 1 describes the structure of our LEAP model.
In terms of main assumptions, we input the main variables used to calculate the activity level and electricity intensity of each sector, including GDP, population, new infrastructure, industrial structure and electricity intensity. The demand department is divided into household, primary industry, secondary industry, new infrastructures including data centers, 5G base stations, charging piles and other tertiary industries except the new infrastructures. Considering the existence of self-generation in terminal electricity consumption, we further assume that part of the electricity consumption of residential life, data centers, 5G base stations and charging piles comes from the main grid, and part of it comes from solar photovoltaic self-generation.
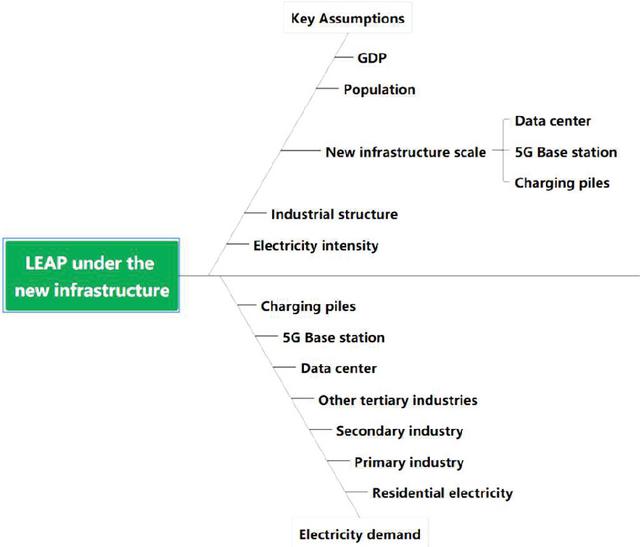
Figure 1 The structure of the LEAP model under the new infrastructure.
3 Main Parameter Description
3.1 GDP
According to China’s “14th Five-Year Plan” and the outline of the long-term goals for 2035, China’s per capita GDP will reach the level of moderately developed countries by 2035, and China’s total economic output and per capita GDP will be doubled, which means that in order to achieve this goal, China must achieve annual economic growth of more than 4.7% between 2020 and 2035 [11]. The Blue Book predicts that in the medium and long term, the economic growth rate during the 14th Five-Year Plan period can reach more than 5.0% under the condition of effectively preventing and defusing public risks [12]. Based on this, we assume that the average annual GDP growth rates in 2021–2025, 2026–2030, and 2031–2035 are 5.5%, 5%, and 4.5%, respectively.
3.2 Population
The National population Development Plan (2016–2030) puts forward that the main goal of the total population is to reach about 1.42 billion by 2020 and about 1.45 billion by 2030. China’s population development not only accords with the general law of the world, but also has its own characteristics and the main trend of population change in the next 15 years is that the inertia of total population growth weakens, reaching a peak around 2030 [13]. The Green Paper of the Chinese Academy of Social Sciences (2019) predicts that China’s population will reach a peak of 1.442 billion in 2029, enter a sustained negative growth from 2030, and decrease to 1.364 billion in 2050 [14]. Therefore, we assume that the population will increase at an annual growth rate of 0.3% from 2021 to 2030, and decline annually at 0.31% from 2031 to 2035.
3.3 New Infrastructure Scale
3.3.1 Data centers
According to the Data Center Application Development Guidelines, the number of racks in China’s data centers in 2019 is 3.15 million [15]. The number of racks in the data center will be 4.286 million in 2020. By the end of 2021, the rack size of data centers in use in China has reached 5.2 million, with an average annual compound growth rate of more than 30% in the past five years. The number of racks in the data center is expected to reach 6.7 million in 2022 [16]. Zhiyan Consulting predicts that the number of racks in China’s data centers in 2025, 2030 and 2035 will be 7.593 million, 11.252 million and 14.911 million respectively [17], we use these data for predicting the growth of Data centers’ scale in our simulation.
3.3.2 5G base stations
According to the statistics of the Ministry of Industry and Information Technology, by the end of 2019, more than 130000 5G base stations have been built in China. In 2020, according to the principle of moderate advance, more than 600000 new 5G base stations have been built [18]. By the end of 2021, 1.425 million 5G base stations have been built in China. It is speculated that the period of 5G communication technology is 10 years, and the construction of base stations will be basically completed in 2025. The number of base stations will increase at a compound growth rate of 63.6% from 2021 to 2025. The number of 5G base stations will begin to decline gradually in 2030, and the number of 5G base stations in China is expected to be about 7.58 million in 2035 [19], we use these data for predicting the growth of 5G base stations’ scale in our simulation.
3.3.3 Charging piles
The “New Energy Vehicle Industry Development Plan (2021–2035)” issued by the Ministry of Industry and Information Technology proposes that it is estimated that the number of charging piles will reach 6.543 million in 2025, with a compound annual growth rate of 25.7% from 2021–2025. The number of new energy vehicles in China will reach 64.2 million by 2030. According to the construction goal of a vehicle-to-pile ratio of 1:1, there will be a gap of 63 million charging piles to be constructed in the next ten years [20]. According to the medium- and long-term development plan of the automobile industry and industry consensus, the development of automobile electrification will accelerate in the next 15 years, and the market share will increase rapidly. It is estimated that in 2025, the number of new energy vehicles will exceed 25 million; in 2030, the number will exceed 80 million; in 2035, the number will exceed 160 million [21]. Taking into account the limited land area, it is conservatively estimated that the vehicle-to-pile ratio will be maintained at the level of 1.5:1 from 2031 to 2035.
Private charging piles
In recent years, the proportion of private charging piles has increased to more than 50%. As of June 2021, the number of private charging piles has reached 1.024 million, accounting for about 58%. Among them, there are about 497,000 shared private piles, accounting for 48.53% [22]. Based on this we suppose that by 2025, 2030 and 2035, the proportion of private charging piles will be about 65%, 60% and 55% respectively, and the number of private charging piles will be 4.25 million, 48 million and 58.66 million respectively.
Public charging piles
Public charging pile is a kind of charging pile which provides charging service for all or part of electric vehicles used for commercial purpose. The number of public charging piles in China in 2019 and 2020 is 516000 and 807000 respectively [23]. By 2035, pure electric vehicles will become the mainstream of new sales of vehicles, and vehicles in the public domain will be fully electrified [24]. Based on the above estimation of the share of private charging piles, we assume that by 2025, 2030 and 2035, the proportion of public charging piles will be about 35%, 40% and 45% respectively, and the number will be 2.29 million, 32 million and 48 million respectively.
3.4 Industrial Structure
Industrial structure refers to the proportion of agriculture, industry and service department in a country’s economic structure. We assumed that with the growth of China’s economy, the share of the primary industry will gradually decline, assuming at an annual rate of 0.1%. We used Xia and Xu’s forecasting to define the proportion growth of service department from 2021 to 2035, which is expected to reach 60.98% by 2035 [25].
3.5 Electricity Intensity
3.5.1 For the electricity intensity of household, primary industry, secondary industry and tertiary industry except the new infrastructures
We forecast it will grow at the rate the same as it grew in 2001–2020 using data collected from China’s Statistical Yearbook [26]. In 2021, the electricity consumption intensity of residents’ living will be 780 kWh/person, and the electricity consumption intensity of each sector in the primary, secondary and tertiary industries (except new infrastructure) will be: 0.00118 kWh/yuan, 0.05235 kWh/yuan, and 0.00726 kWh/yuan. By 2035, the residential electricity consumption intensity will be 1257 kWh/person, and the electricity consumption intensity of the primary, secondary and tertiary industries (except new infrastructure) will be 0.00068 kWh/yuan, 0.03657 kWh/yuan, and 0.00105 kWh/yuan respectively.
3.5.2 Data centers
In 2020, the total energy consumption of Chinese data centers is 150.7 billion kilowatt-hours (kWh), and the energy consumption of single rack is about 35161 kWh. With the development of energy-saving technology slowing down and local applications on the ground, the total energy consumption of data centers in China in 2035 will be about 485.5 billion kWh [27], which is 7.3978% lower than that in 2020. The energy consumption of single rack is about 32560 kWh. We assume that data center energy consumption will not change for several years, so we assume that data center single rack energy consumption is 35161 kWh in 2021–2025, 33860 kWh in 2026–2030, and 32560 kWh in 2031–2035.
3.5.3 5G base stations
In 2020, the electricity consumption of single station is about 6711 W/h. China Mobile estimates that device-level electricity consumption will decrease by an average of 10% per year between 2021 and 2023 and with the development of energy-saving technology, it is estimated that in 2030, the electricity consumption of main equipment of 5G stations will be reduced by 0.5% on the basis of 2025, and the proportion of air conditioning, electricity distribution and other energy consumption can be reduced to 52%. Take all the considerations, it is estimated that the electricity consumption of single station is about 4921 W/h in 2025 and 4701 W/h in 2035 [19]. The above data is the hourly energy consumption of a single base station. According to the annual operation of the base station, the annual operation time is 24 hours/day * 365 days 8760 hours. Therefore, the annual electricity consumption of a single base station can be obtained by multiplying the two data.
3.5.4 Charging piles
Private charging piles
The General Office of the State Council recently issued the New Energy vehicle Industry Development Plan (2021–2035), which proposes that the average electricity consumption of private electric vehicles will be reduced to 12.0 kWh/100 km by 2025 [24]. So we assumed that before 2025, the electricity consumption of a private charging station is 13 kWh/100 kilometers and after that time will be reduced to 12.0 kWh/100 km. We assumed that private users use electric vehicles for 18, 20 and 22 days per month in 2025, 2030 and 2035 and drive about 50 kilometers per day, the average annual mileage in 2025, 2030 and 2035 will be 10800, 12,000 kilometers and 13,200 kilometers respectively. The annual electricity consumption of a single private charging pile will be 1404 kWh, 1440 kWh and 1584 kWh in 2025, 2030 and 2035, respectively.
Public charging piles
The monthly charging capacity of public piles is basically stable, rising slightly from 1044 kWh/month in December 2018 to 1155 kWh/month in December 2019. Taking into account the increase in travel after the end of the epidemic and the full electrification of vehicles in the public sector, it is assumed that the monthly charging capacity of a single pile in 2030 will increase significantly and remain at 1400 kWh/month. In 2035, it will double from 2025 to 1600 kWh/month.
3.6 Solar Sources
In 2020, the electricity consumption of the whole society was 7.511 trillion kWh, an increase of 3.1% over the same period last year [28]; Solar power generation reached 261.1 billion kWh, an increase of 37.1 billion kWh [29]. In 2019 and 2020, solar power generation accounted for 3.07% and 3.5% of the country’s total electricity consumption, respectively. From January to November 2021, it is forecasted the national solar power generation will reach 300.9 billion kWh, accounting for about 4% of the total electricity consumption of the whole society [30].
The Energy Bureau has put forward the overall requirement that in 2021, the proportion of wind power and photovoltaic power generation in the electricity consumption of the whole society will reach about 11%, and then increase to 16.5% by 2025 [31]. Photovoltaic power generation is expected to rely on the advantages of cost and low carbon, with a compound annual growth rate of 12% in 2020–2050 and accounting for about 40% of national electricity generation in 2050 [32]. We take this trend as baseline for the growth of the proportion of photovoltaic power generation in the overall electricity consumption for household and new infrastructure departments.
4 Scenario Development
According to the existing policy objectives and development trends, we first set a basic scenario (2019–2035) as the benchmark for the other four scenarios, namely, the expansion of new infrastructure, the development of energy-saving technologies, and the increase in the proportion of solar self-power generation and the mixed scenario combining all the above scenarios.
4.1 Basic Scenario (BA)
In this scenario, we assume that the scale of future data centers, 5G base stations and charging piles will develop in accordance with the current policy, and the policy changes and industry development in the future to 2035 will be consistent with the current developing trend. All the parameters are set based as assumed in the III parts.
4.2 Rapid Development of New Infrastructure (RDNI)
In this scenario, we assume that the growth scale of the new infrastructure will exceed the development rate of the new infrastructure in the BS scenario in 2030 and 2035, by 5% per year, while other parameters are all same as BA.
4.3 Energy-saving Technology Improvement (ESTI)
In this scenario, we assume that the energy-saving technology of data centers and 5G base stations will be improved, the energy consumption of a single device will be reduced, and other variables will remain unchanged.
4.3.1 Data centers
With the rapid development of energy-saving technology and large-scale popularization in China, the total energy consumption of data centers in 2035 is expected to be 450.5 billion kWh [27], which is 14.0735% lower than that in 2020. We assume that the energy consumption of the data center will not change in the near five years, and after 2025 will decrease by 14.0735% in 2035.
4.3.2 5G base stations
With the rapid development of energy-saving technology and large-scale popularization in China, it is estimated that in 2030, the electricity consumption of China’s main equipment can be reduced by 1% compared with 2025, the proportion of air conditioning, electricity distribution and other energy consumption can be reduced to 50%. It is estimated that in 2035, the electricity consumption of main equipment can be reduced by 2% compared with 2025, the proportion of air conditioning, electricity distribution and other energy consumption can be reduced to 40% [19].
4.4 Increase in the Proportion of Solar Photovoltaic Self-generation (IPSP)
Due to the high electricity consumption of 5G base stations and data centers, both require higher electricity flexibility, so we assume that the proportion of photovoltaic energy storage may be higher, and in this scenario, we assume that the proportion of solar power generation will increase by 3% each year from 2023.
4.5 Comprehensive Scenario (CO)
In this scenario, we combine all the assumptions in BA, RDNI, ESTI and IPSP, which means that all policies, including building more equipment, improving electricity efficiency and increasing the proportion of self generated electricity, will be implemented.
5 Results
5.1 Results of the Scenario BA
The simulation results of medium- and long-term electricity consumption prediction under the BA (Figure 2) show that with the continuous growth of China’s GDP and the number of infrastructure, the electricity consumption under the new infrastructure continues to rise to 2035. There will be 6901.34 billion kWh of electricity demand by 2035, of which the electricity consumption of new infrastructure is 1812.17 billion kWh, accounting for 26.26% of the total electricity consumption of the whole society.
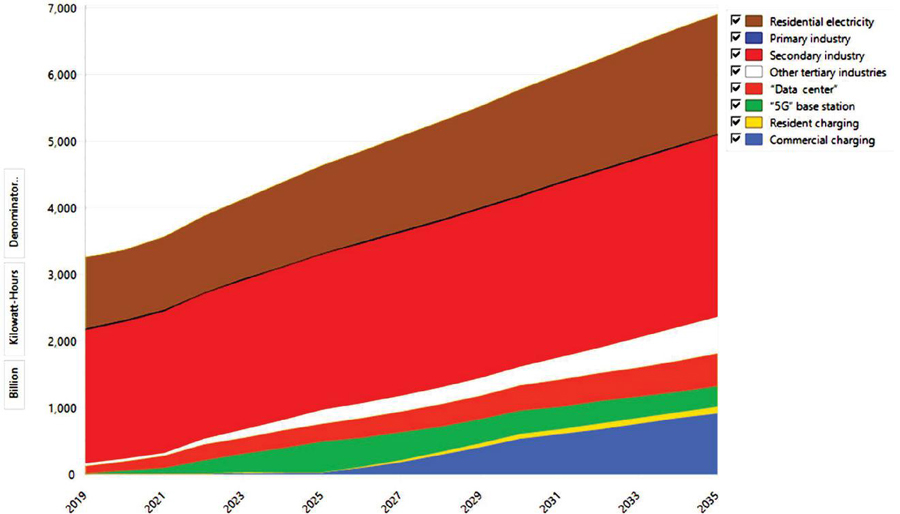
Figure 2 Energy demand of all sectors under the scenario BA.
With the optimization and adjustment of industrial structure, the proportion of primary industry in electricity consumption has decreased year by year. Electricity consumption in the primary industry is expected to increase from 2021, peaking at 9.91 billion kWh in 2027. After 2027, the overall electricity consumption will show a downward trend. By 2035, the electricity consumption of the primary industry will reach 9.63 billion kWh. The electricity consumption of residents, secondary industry and tertiary industry under BA will maintain a clear upward trend before 2035. The new infrastructure accounts for a relatively large proportion of electricity consumption in the tertiary industry. The electricity consumption of other tertiary industries maintains a steady growth trend, and there will be 556.84 billion kWh of electricity consumption by 2035. It can also be found that the electricity consumption of data centers and charging piles will increase significantly after 2025. By the end of 2035, the proportion of data centers in total electricity consumption will increase to 7.03%, which is higher than that in 2025 (5.77%) and also higher than that in 2030 (6.61%). The share of charging piles will increase to 14.7%, much higher than that in 2025 (0.66%) and 2030 (10.52%). In particular, the electricity consumption of 5G base stations will increase rapidly after 2021, reaching 461.52 billion kWh by the end of 2025, which is more than five times that of 2021. With the advancement of energy-saving technologies and the slowdown in the construction of 5G base stations, electricity consumption will decline after 2025, reaching 312.15 billion kWh by 2035, which accounts for 4.52% of the total electricity consumption of the whole society. In general, The scale growth of new infrastructure has driven the proportion of its electricity consumption to increase from 7.75% in 2021 to 26.26% in 2035.
China’s medium- and long-term electricity consumption under the scenario BA is increasing year by year. Increasing the proportion of solar power generation (or the scale of other clean energy use) is helpful to reduce the pressure of power generation and electricity consumption. By 2030, solar photovoltaic power generation will provide 5.6% of electricity consumption for the whole society; solar energy will provide 10.3% of the electricity consumption in 2035 (Table 1), which will alleviate the electricity consumption pressure of 710.84 billion kWh in the whole society.
5.2 Results of the Scenario RDNI
Under the scenario RDNI, China’s medium- and long-term electricity consumption is expected to continue to grow steadily and be significantly higher than the scenario BA after 2025 (Figure 3). This means that under the condition that other variables remain unchanged, the increase in the scale of the new infrastructure will obviously lead to an increase in overall electricity consumption. According to the simulation results, the total electricity consumption in 2035 is about 7524.59 billion kWh, which is 9.03% higher than that in the BA scenario. All these are brought about by the 5% annual increase in the scale of the new infrastructure on the basis of the scenario BA.
Table 1 Proportion of solar power generation in each scenario
| Years | ||||
| Scenarios | 2020 | 2025 | 2030 | 2035 |
| BA | 1.3% | 2.8% | 5.6% | 10.3% |
| RDNI | 1.3% | 2.9% | 5.6% | 11.0% |
| ESTI | 1.3% | 2.8% | 5.5% | 10.1% |
| IPSP | 1.3% | 3.7% | 7.2% | 13.3% |
| CO | 1.3% | 3.7% | 7.2% | 14.1% |
In fact, due to the increase in electricity consumption in the new infrastructure while the electricity consumption of other sectors has not changed, this will inevitably lead to an increase in the proportion of electricity consumed by new infrastructure and a decrease in the share of electricity consumption in other sectors. From the data point of view, the proportion of electricity consumption of new infrastructure in 2030 and 2035 will increase to 23.99% and 32.37%, which are 0.88% and 6.11% higher than the scenario BA, respectively.
However, since the share of solar resources has been set to a fixed proportion in Section 3.6, the electricity it can provide is only related to the annual residential electricity consumption and the electricity consumption of the new infrastructure. In the scenario RDNI, there is no change in residential electricity consumption, and the increase in the electricity consumption of the new infrastructure increases the electricity consumption of the whole society by 8.28%. Compared with the scenario BA, solar energy provides 11.0% of the electricity consumption of the whole society in 2035 under the scenario RDNI, and the share of solar power generation does not increase significantly (10.3% in the scenario BA).
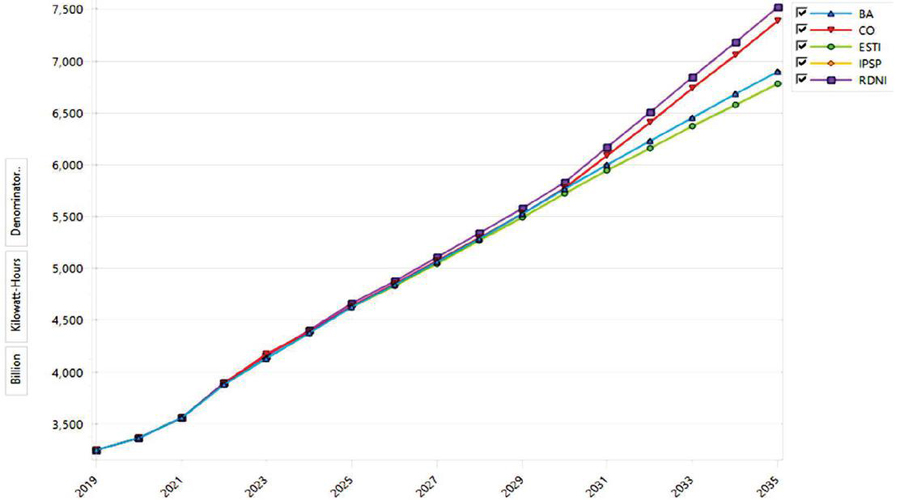
Figure 3 Comparison of electricity consumption of all sectors in all scenarios.
5.3 Results of the Scenario ESTI
In the scenario ESTI, due to the improvement of energy-saving technologies, the energy consumption of a single device in the new infrastructure will be reduced (which means that its electricity consumption intensity will decrease), so China’s medium- and long-term electricity consumption will be lower than the scenario BA and RDNI. It is expected that the growth of total electricity consumption for new infrastructure will slow down significantly after 2030 under the scenario ESTI. In 2035, the electricity consumption will reach 6780.61 billion kWh, which is 120.74 billion kWh lower than that in the scenario BA and 743.98 billion kWh lower than that in the scenario RDNI. If the energy-saving technology of the new infrastructure is improved to a greater extent, then the electricity consumption of the new infrastructure will also be reduced, which will lead to a greater reduction in electricity consumption in China.
The electricity consumption of the whole society is slightly reduced because only the electricity intensity of the new infrastructure is reduced in this scenario, and the share of solar energy in the ESTI scenario is not significantly reduced compared with the BA scenario.
5.4 Results of the Scenario IPSP
In this scenario, the increase in the proportion of solar power generation can only alleviate the electricity pressure, but can not fundamentally reduce the overall electricity consumption, so it is consistent with the electricity consumption in the scenario BA. In Figure 3, the electricity consumption curve of scenario BA overlaps with that of scenario IPSP.
Except for the total electricity consumption, the electricity consumption of each sector is consistent with that under the scenario BA. The only difference is that the proportion of solar energy resources in residential electricity consumption and new infrastructure electricity consumption has increased compared with the scenario BA. Under the scenario IPSP, solar power will provide 3.7%, 7.2%, and 13.3% of electricity consumption in 2025, 2030 and 2035, respectively, which is 0.9%, 1.6%, and 3.0% more than the scenario BA.
5.5 Results of the Scenario CO
In this scenario, we assume that the rapid development of new infrastructure, the improvement of energy-saving technologies and the increase in the proportion of solar photovoltaic power generation occur at the same time, and apply to our medium- and long-term electricity consumption forecasting model in China. The national electricity consumption from 2026 to 2035 is still expected to increase slightly compared with the scenario BA (Figure 3), reaching 7384.30 billion kWh in 2035, which is 482.96 billion kWh more than the scenario BA. This means that developing in line with current policy goals will not significantly reduce China’s total electricity consumption.
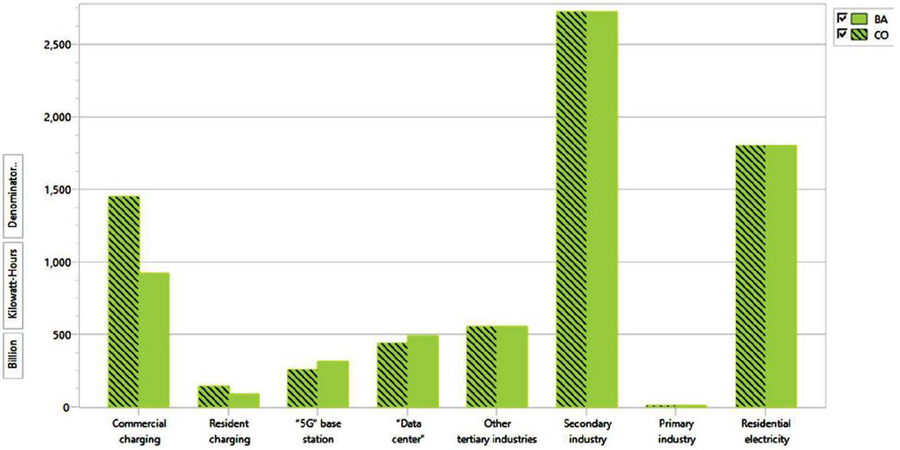
Figure 4 Electricity consumption of each sector under the scenario BA and CO in 2035.
Although the improvement of energy-saving technologies in 5G base stations and data centers reduces their energy consumption (scenario RDNI), which offsets the increase in electricity consumption caused by the increase in the number (scenario ESTI), so that their electricity consumption is lower than that in the scenario BA, the substantial increase in the number of charging piles has led to an increase in electricity consumption (Figure 4). This brings the electricity consumption of the new infrastructure higher than that under the scenario BA. As in the scenario IPSP, the electricity provided by solar energy increases from 1.3% in 2020 to 14.1% in 2035 (Table 1).
6 Conclusions
This study establishes a LEAP-based medium- and long-term electricity consumption forecast model in China considering the rapid development of new infrastructure to determine the impact of new infrastructure on future electricity consumption. From Figures 5 and 6, it can be seen that the rapid development of new infrastructure has increased its proportion from 16.41% to about 26.25% in 10 years. Among them, the proportion of charging piles increased from 0.66% to about 14.7%. The proportion of data centers and 5G base stations decreased from 15.57% to about 11.55%. We find that the proportion of electricity consumption of new infrastructure in the scenario ESTI is the lowest, encouraging all parties to actively explore and solve the energy consumption problem of digital new infrastructure and improve the overall energy saving level.
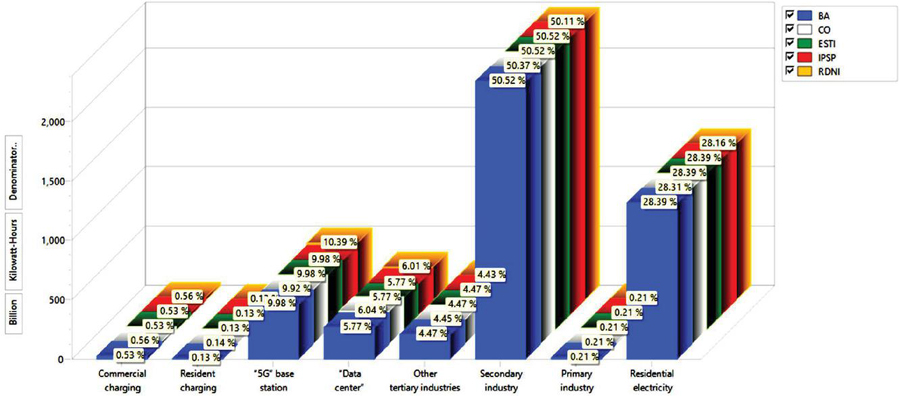
Figure 5 The share of electricity consumption of each sectors in each scenario in 2025.
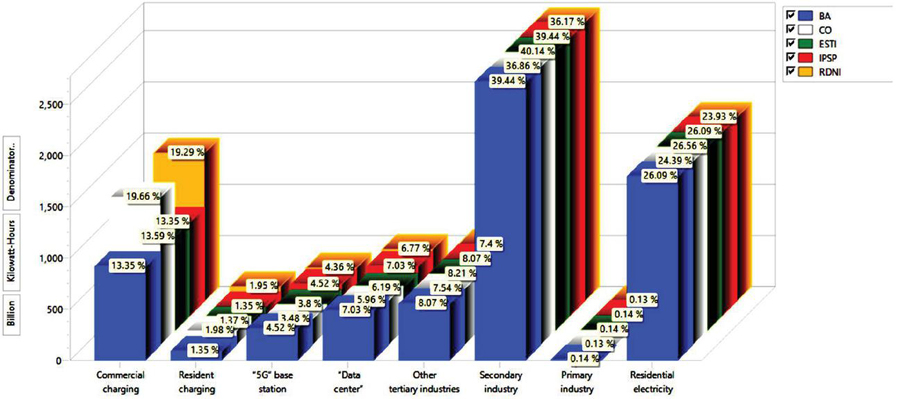
Figure 6 The share of electricity consumption of each sector in each scenario in 2035.
This measure is very effective in reducing electricity consumption.
However, with the development of the economy, the number of new infrastructure is bound to increase. If the number is not controlled, the overall electricity consumption cannot be significantly reduced. Therefore, it is encouraged to optimize the construction layout of new infrastructure, strengthen management, and improve the utilization efficiency of new infrastructure. Although increasing the proportion of solar power (or clean energy) cannot help China reduce total electricity consumption, it can help China reduce the pressure on electricity consumption. Encouraging the use of renewable energy such as wind and solar energy and adjusting the power structure can solve the energy consumption and carbon emission problems of new digital infrastructure and raise the level of green electricity use. Implementing any one policy alone will hardly lead to a substantial reduction in overall electricity consumption. Only when these policies are implemented simultaneously, reducing electricity consumption while increasing the generation of clean energy can keep China’s electricity consumption within an affordable level and reduce the pressure on electricity consumption.
Acknowledgment
The authors declare that they have no known competing financial interests or personal relationships that could have appeared to influence the work reported in this paper.
References
[1] Central People’s Government of the People’s Republic of China, how does China’s economy cross the transition stage of development, Dec., 2017. Retrieved from: http://www.gov.cn/xinwen/2017-12/10/content\_5245591.htm.
[2] China Academy of Information and Communications Technology (CAICT), ‘The development of China’s digital economy’, White paper. Retrieved from: http://www.caict.ac.cn/kxyj/qwfb/bps/202104/t20210423\_374626.htm.
[3] W. Pan, T. Xie, Z. Wang, and L. Ma, “Digital economy: An innovation driver for total factor productivity”, Bus. Res. Netherlands, vol. 139, pp. 303–311, February 2022.
[4] S. Tan, C. Chiu-Shee, and F. Duarte, “From SARS to COVID-19: Digital infrastructures of surveillance and segregation in exceptional times”, Cities. UK, vol. 120, January 2022.
[5] D. Ting, L. Carin, V. Dzau, and T. Y. Wong, “Digital technology and COVID-19”, Nat. Med. UK, vol. 26, pp. 459–461, March 2020.
[6] X. Yu, F. Song, Y. Zhou, and H. Liang, “Analysis of the impact of “new infrastructure” on China’s electricity demand and power grid planning during the “14th Five-Year Plan” period (in Chinese)”, Electric Power. China, vol. 54, pp. 11–17, July 2021.
[7] National Development and Reform Commission (NDRC). Document no. (2021) 1742. Retrieved from: https://www.ndrc.gov.cn/xwdt/tzgg/202112/t20211208\_1307105.html?code=\&state=123
[8] D. Yang, D. Liu, A. Huang, J. Lin and L. Xu, “Critical transformation pathways and socio-environmental benefits of energy substitution using a LEAP scenario modeling”, Renew. Sust. Energ. Rev. Netherlands, vol. 135, January 2021.
[9] M. Shahid, K. Ullah, K. Imran, A. Mahmood, and M. Arentsen, “LEAP simulated economic evaluation of sustainable scenarios to fulfill the regional electricity demand in Pakistan”, Sustain. Energy Technol. Assess. UK, vol. 46, August 2021.
[10] S. Chen, Y. Liu, J. Lin, X. Shi, K. Jiang, and G. Zhao, “Coordinated reduction of CO emissions and environmental impacts with integrated city-level LEAP and LCA method – a case study of Jinan”, Adv. Clim. Chang. Res. China, vol. 12, pp. 848–857, December 2021.
[11] Central People’s Government of the People’s Republic of China, Economists interpret the “14th Five-Year Plan” and the outline of long-term goals for 2035, Mar., 2021. Retrieved from: http://www.gov.cn/zhengce/2021-03/14/content\_5592819.htm.
[12] Finance.Sina, China Fiscal Policy report 2022: fiscal Policy from demand Management to risk tradeoff, Nov., 2022. Retrieved from: http://finance.sina.com.cn/jjxw/2022-11-19/doc-imqmmthc5164456.shtml.
[13] Central People’s Government of the People’s Republic of China, No. 32 Document in 2016 of the State Council, 2016. Retrieved from: http://www.gov.cn/zhengce/content/2017-01/25/content\_5163309.htm.
[14] Social Sciences Academic Press (China) (SSAP), Green paper on population and labor: report No. 19 on China’s population and labor issues, Dec., 2018.
[15] Open Data Center Committee (ODCC), National Data Center Application Development Guidelines (2020), Feb., 2021. Retrieved from: http://www.odcc.org.cn/news/p-1357574159367331842.html.
[16] Leading Industry Research, Analysis on the Market scale, number of Data Center racks and Energy consumption growth of Data Center in China from 2017 to 2021, Nov., 2022. Retrieved from: http://www.leadingir.com/datacenter/view/8368.html.
[17] Zhiyan Consulting, report on in-depth market evaluation and investment opportunity forecast of China data center Rack Industry (2021–2027), Feb., 2021. Retrieved from: https://www.chyxx.com/research/202102/931113.html.
[18] Ministry of Industry and Information Technology of the People’s Republic of China, Statistical Bulletin of the Communications Industry in 2019 and 2020, 2020 & 2021. Retrieved from: https://www.miit.gov.cn/jgsj/yxj/xxfb/art/2020/art\_fba81d47193a4f1f83e7ebe694313ab9.html
[19] CHYXX, Analysis and forecast of the number and scale of 5G base stations in China, energy consumption and carbon emissions of 5G base stations in 2035, Aug., 2021. Retrieved from: https://www.chyxx.com/industry/202108/968113.html.
[20] Hongxing News, 1.83 million units nationwide! The construction of electric vehicle charging infrastructure has accelerated, and the vehicle-to-pile ratio has reached 3:1, May 2021. Retrieved from: https://baijiahao.baidu.com/s?id=1699703301742764402\&wfr=spider\&for=pc.
[21] Sili Fan Report, China Economic News, 2020. Retrieved from: https://www.cet.com.cn/wzsy/ycxw/2677725.shtml.
[22] Wangyi, Analysis of the market in the upper, middle and lower reach-es of China’s charging pile industry chain in 2021, Jul., 2021. Retrieved from: https://www.163.com/dy/article/GG5UL78Q051481OF.html.
[23] CHYXX, Analysis on the Development trend of China’s charging pile Industry in 2020, Feb., 2021. Retrieved from: https://www.chyxx.com/industry/202102/931474.html.
[24] General Office of the State Council of the People’s Republic of China. No. 39 Document in 2020 of the State Council, Oct., 2020, Retrieved from: http://www.gov.cn/zhengce/content/2020-11/02/content\_5556716.htm.
[25] J. Xia, and Z. Xu, “China’s service industry towards 2035: prospects, strategic orientation and promotion strategy (in Chinese)”, China Economist. China, vol. 16, pp. 11–17, January 2021.
[26] National Bureau of Statistics of China (NBSC), China Statistical Yearbook 2001, 2002, 2003, 2004, 2005, 2006, 2007, 2008, 2009, 2010, 2011, 2012, 2013, 2014, 2015, 2016, 2017, 2018, 2019, 2020, 2021. Retrieved from: http://www.stats.gov.cn/tjsj/ndsj/.
[27] CHYXX, Analysis and forecast of rack size, rack energy consumption and carbon emissions of data centers in China in 2035, Aug., 2021. Retrieved from: https://www.chyxx.com/industry/202108/968123.html.
[28] National Energy Administration (NEA), China’s electricity consumpt-ion will increase by 3.1 percent year-on-year in 2020, Jan., 2021, Retrieved from: http://www.nea.gov.cn/2021-01/20/c\_139682386.htm.
[29] CHYXX, Analysis of China’s solar power generation, installed capacity and future development trend in 2020, Mar., 2021, Retrieved from: https://www.chyxx.com/industry/202103/939197.html.
[30] National Energy Administration (NEA), China’s new energy generation exceeds 1 trillion kWh for the first time this year, Dec., 2021, Retrieved from: http://www.nea.gov.cn/2021-12/31/c\_1310404016.htm.
[31] National Energy Administration (NEA), Notice on matters related to the development and construction of wind power and photovoltaic power generation in 2021 (draft for comments), Apr., 2021, Retrieved from: http://www.nea.gov.cn/2021-04/19/c\_139890241.htm.
[32] Chao Xu Report, Wall Street News, 2021.
Biographies

JunChao Yang is an Lecturer in the School of Account of Inner Mongolia University of Finance and Economics. He got a PhD in Department of Economics and Management of North China Electric Power University. His activity mainly focuses on Accounting and Management. He lectures on Accounting.

Tianfeng Li is a postgraduate student in the school of economics and management of Beijing Information Science & Technology University. Her main research directions include Energy Economics and Management.
Strategic Planning for Energy and the Environment, Vol. 42_4, 703–724.
doi: 10.13052/spee1048-5236.4246
© 2023 River Publishers