Renewable Energy and Economic Efficiency in the Framework of Sustainable Development: Malmquist Index and Tobit Model
Eda Bozkurt
Atatürk University, Erzurum, Turkey
E-mail: edabozkurt@atauni.edu.tr
Received 29 October 2021; Accepted 21 November 2021; Publication 03 December 2021
Abstract
Today, energy is as important as labour, capital and technology for the growth of countries. As countries grow economically, they try to achieve the same or more amounts of output with fewer inputs. In other words, countries target efficiency based growth. As the economic growth of countries increases, their energy requirements also increase. Regarding countries that are not rich in domestic resources, this increase, imposes significant costs. On the other hand, the finite energy supply in countries rich in domestic resources is an important problem. That is why the phenomenon of renewable energy has become a trend all over the world. In addition to reducing import dependence on energy, new policies are required to reduce the effects of climate changes and to protect natural resources. That is why; renewable energy and economic efficiency are an attractive research area. In the study, efficiency scores were obtained by calculating the Malmquist total factor productivity index in the period 1992–2018 for 10 countries among the N11 countries. Then, the efficiency values obtained by using the two stage estimation method were used as the dependent variables. The test results based on Tobit regression indicated that the increase in the supply of renewable energy positively increases economic efficiency. It can be said that the supply of renewable energy will lead to economic efficiency in the future.
Keywords: Malmquist total factor productivity index, panel data, renewable energy, tobit model.
1 Introduction
According to scientists, energy is the ability to perform work. Mankind has reached a modern civilization as a result of learning to convert energy from one form to another, and then using it to perform work. Energy is used at every point of life, from the movement of cars on the roads, boats on the water, cooking food on the oven to lighting up homes and offices. The most widely used energy sources are coal, petroleum, natural gas, hydrocarbon gas liquids and nuclear energy. Due to the limited quantity of these resources in the world, they are called non-renewable energy sources [1]. As shown in Figure 1, coal and oil are the primary sources of energy today. Coal and oil are followed by natural gas.

Figure 1 Primary sources of energy consumption at the global level [2].
The fact that non-renewable energy sources is finite, the world’s population increase and, correspondingly, the acceleration of industrial growth in developing countries such as India and China show that the global energy demand will increase significantly. Table 1 shows the change in gross domestic product (GDP) growth and energy consumption in the world. Statistics show that over the past fifty years, as energy consumption has increased, economic growth has also increased. Literature studies carried out in this area by Hamilton (1983), Burbridge and Harrison (1984), Hwang and Gum (1992), Stern (1993), Glasure and Lee (1997), Paul and Bhattacharya (2004), Odhiambo (2009), Bakırtaş and Akpolat (2018) proves that there is a strong relationship between energy consumption and economic growth. As a result of the oil crisis in 1973, energy consumption slowed down until the 1980s, and the results led to a contraction in GDP at the global level.
Table 1 GDP and energy consumption
| Years | 1970 | 1975 | 1980 | 1985 | 1990 | 1995 | 2000 | 2005 | 2019 |
| GDP | 6,127 | 0,715 | 1,863 | 3,677 | 2,978 | 3,020 | 4,425 | 3,899 | 2,335 |
| Energy | 6,759 | 0,542 | 0,705 | 2,652 | 1,157 | 2,092 | 2,507 | 3,357 | 1,331 |
| [3, 4]. | |||||||||
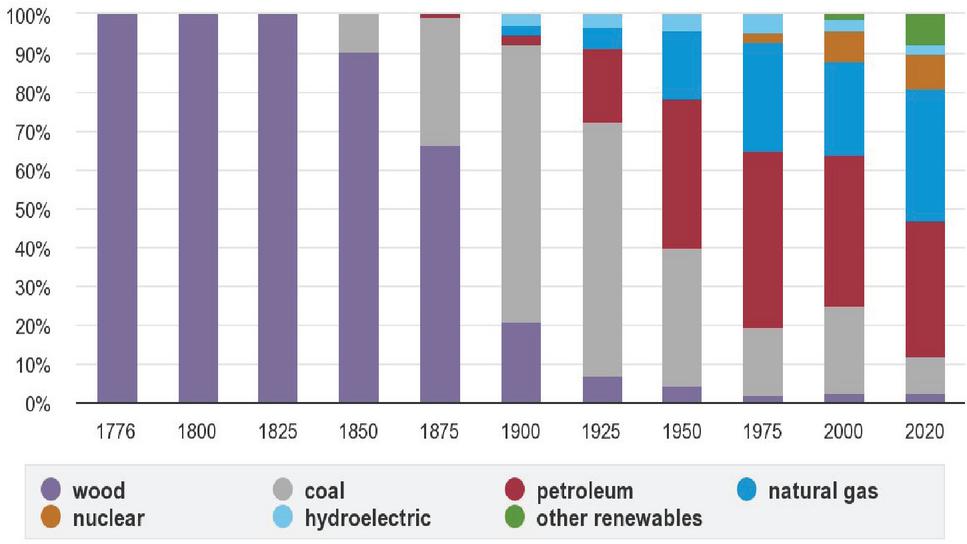
Figure 2 Energy use according to the main source in the USA (1176–2020) [5].
Unfortunately, it is not possible to continue economic activities without energy production and consumption. The distribution of energy uses by resources in the United States, which has one of the largest economies in the world, is given in Figure 2. The United States has a GDP of $18 trillion in 2020, according to World Bank data. When the types of energy used in production are examined, it is seen that there is an energy-based structure that cannot be renewed in the United States as well as throughout the world. But it is worth noting that the use of renewable energy sources is increasing. Until the mid-1800s, almost all the energy needs of the United States were supplied from wood, a natural resource. Later, coal, oil and natural gas from fossil fuels became the main sources of energy. While wood and hydropower were the most used renewable energy sources until the 1990s, geothermal energy, solar energy and wind energy usage increased in the US energy consumption. The total renewable energy uses of the United States reached record levels in 2020. In 2020, the energy obtained from renewable sources is approximately 11.59 quadrillion Btu. In the electric power sector, about 20% of the total electricity generation in 2020 was provided from renewable energy sources [5].
The growing need for energy not only leads to the depletion of resources, but also increases carbon emissions, which play an important role in combating climate changes. In other words, an important policy change in the world regarding energy supply is considered mandatory. Because there are two important factors for a sustainable energy policy for all institutions. The first is the scarcity of energy resources, which necessarily raises the orientation to renewable energy sources. The other is the undesirable effects of energy use [6]. This situation is closely related to sustainable development. Sustainable development is a development model that ensures that the ability to meet the needs of future generations is not compromised while meeting the needs of the current generation. Economic, environmental and social issues are among the dimensions of sustainable development [7]. Energy is involved in all dimensions of sustainable development. In terms of the economic dimension, energy is the basis of macroeconomic growth. Increasing the production of goods and services, that is, economic growth is a physical process. For this reason, the amount of energy used in a country and the economic size of the country has a strong relationship. Large economies use much more energy than small economies. The main goal of sustainable development is to achieve an increase in material living standards in poor countries. A significant increase in the total energy use in these countries will increase the GDP. In terms of the environmental dimension, it is the main source of environmental stress at the regional and global levels, as well as the acquisition, processing and use of energy. Excessive use of non-renewable energy sources causes climate change and environmental harmful effects. In terms of the social dimension, energy cannot meet any need alone. But it is a prerequisite of basic human needs. Energy is absolutely necessary to provide life, food, water, health, education, housing and employment services [8, 9]. One of the main obstacles to achieving sustainable development is energy. For this reason, the energy source that is seen as an alternative to fossil fuels and developed rapidly in the 21st century is known as renewable resources. Renewable energy is a type of energy produced from self-renewable energy sources such as solar, wind, streams, biomass, and the internal heat of the earth. Renewable energy is a type of energy produced from self-renewables such as solar, wind, streams, biomass, and the internal heat of the earth. Basically, with the energy obtained from these five sources, electricity is produced for all economic sectors, fuel for transportation, and heat for buildings [10].
The source of growth gains is important. Since the share of productivity among the resources that provide growth in countries with low levels of development is very small, it causes irreversible damage to the environment. Development is sustainable if it is supported by efficiency-based growth. Therefore, development is not dependent on the quantitative increase in goods and services produced alone, but are related to how effectively resources are used. Ensuring sustainability in all areas is directly related to efficient forms of behaviour [11]. Thus, the relationship between economic efficiency and renewable energy, which constitute the two important pillars of sustainable development, is remarkable. Therefore, the countries in the study, known as N11, the relationship between economic efficiency and renewable energy in developing countries, two-stage data envelopment analysis (DEA) model based on the Malmquist total factor productivity (TFP) and Tobit regression analysis was investigated. The most important contribution of the study to the literature is to determine the contribution of renewable energy use to economic efficiency in countries with an emerging market economy and whose energy needs are increasing every day. As a result of the fact that renewable energy sources will increase economic efficiency, it will make countries more willing to increase the use of such energy sources. Thus, the energy policies of the countries will be reshaped. Therefore, the growth of countries will not allow various concessions to be made in order to meet the needs of future generations. In other words, sustainable development will be supported.
2 Data and Methodology
The relation between the output produced by a production system over a certain period of time and the inputs used for production is explained by the concept of efficiency. The ratio of the output produced as a result of this production activity to all the inputs used is known as TFP [12]. As an indicator of economic growth for enterprises or countries, TFP explains the reasons for growth, as well as reveals the source of this growth. TFP is generally investigated based on the Solow (1957) model. The Cobb-Douglas production function of production, including the total factor productivity, that is, the level of technology expressed externally where K; capital, L; labour and A; is shown as follows:
| (1) |
In TFP calculations, the Malmquist TFP index is a widely used method for monitoring the progress of system performance in various industries. The index measures the change in the total factor productivity of two observations as the ratio of distances to a common technology [13].
The Malmquist TFP index was calculated by Färe et al. (1994), Färe et al. (1998) and Coelli et al. (1998) based on the change in activity between the t and t 1 periods in their studies. The Malmquist TFP index, which is divided into two components as efficiency change (EC) and technical change (TC), is expressed by equation. can take values equal to 1, greater than 1 or less than 1, depending on the efficiency changes between the two periods [14].
| (2) | ||
| (3) | ||
| (4) |
The efficiency change shows how close the production unit is to the effective limit, and the technical change shows the effective limit change. When the values are evaluated between the periods t and t 1, the fact that the result is greater than 1 indicates that the effectiveness and technical change have increased, that it is less than 1 and that it is equal to 1 has not changed [15]. Since the return characteristics of technology relative to scale have an important place in the TFP index, the Malmquist TFP index measurement should be based on the DEA model assumption, which takes into account fixed return relative to scale, in estimating distance functions [16].
The economic performances of the countries that are similar at work, known as N11 and the data set is available in 10 countries (because series for Bangladesh, Egypt, Indonesia, Iran, Mexico, Nigeria, Pakistan, Philippines, Korea, Turkey, Vietnam were missing they could not be included in the analysis). First, the Malmquist TFP index was calculated. The effective use of resources such as capital, labour, information and energy in the production process of goods and services increases productivity. For this purpose, labour and capital variables were considered as input variables in accordance with the classical Cobb-Douglas model. In addition, renewable energy has been added as an input because energy is the essence of production. Moreover, the CO2 series was also used as an input due to the possible effect of carbon dioxide release on GDP resulting from non-renewable energy use. The output variable consists of the GDP figures. The data were obtained from the World Bank, the International Labor Organization (ILO) and the Organization for Economic Cooperation and Development (OECD) databases. Table 2 gives information about the input and output variables.
Table 2 Variables used in the analysis
| Input | Output | ||||
| Variables | LAB | CAP | REN | CAR | GDP |
| Description | Total employment, total (ages 15) | Gross capital formation (constant 2010 US$) | Renewable energy supply (kilotoe) | CO2 emissions (kiloton-kt) | Gross Domestic Product (constant 2010 US$) |
In the model, the values calculated with the Malmquist TFP index were used as the dependent variable. The fact that these values were limited required that the most appropriate method for the regression to be estimated be selected as a Tobit Model. The Random Effects Panel Tobit model for the 10 countries used in the analysis is shown by the equation:
| (5) |
The Tobit model (censored regression model) described above can be estimated by the maximum probability method. The limit set in the Tobit model is not exceeded beyond the value. The Y values are known and these values are used. Where is the vector of coefficients, is the explanatory variable vector, is the latent dependent variable, is the observed dependent variable, and is the error term showing the identical and independent normal (IIN) distribution [17]. From here, the equation used for prediction is as follows.
| (6) |
When examining the elements that are considered to have a relationship with productivity, it is preferred that more than one continuous-discrete variable can be used (two stage approach), which does not require a prior assumption about the effect of variables. In the first step, efficiency values are calculated for each unit. In the second step, the relationship between the variables determining productivity and efficiency is estimated using regression model [18].
3 Results of the Analysis
Table 3 shows the results of the Malmquist TFP index, the first analysis. The results of the analysis are summarized as EC, TC and TFP values. In the period 1992–2018, productivity changes of the countries under consideration are observed with the Malmquist TFP indices. The efficiency scores to be used as a dependent variable in the Tobit model were calculated using the DEAP 2.1 program. When the results were evaluated in t and t 1 periods, TFP1.000 TFP increased, TFP1.000 TFP decreased, and TFP=1.000 TFP and there was no change.
Table 3 Malmquist TFV scores
| Country/ | ||||||||||
| Period | Bangladesh | Egypt | Indonesia | Iran | Mexico | Nigeria | Pakistan | Philippines | Korea | Turkey |
| 1992–1993 | 0.655 | 0.690 | 0.721 | 0.755 | 0.799 | 0.824 | 0.861 | 0.897 | 0.929 | 0.965 |
| 1993–1994 | 0.890 | 0.911 | 0.934 | 0.964 | 0.996 | 1.000 | 1.000 | 3.587 | 3.577 | 3.496 |
| 1994–1995 | 2.000 | 2.000 | 2.000 | 2.000 | 2.000 | 2.000 | 2.000 | 0.945 | 0.876 | 0.940 |
| 1995–1996 | 0.753 | 0.818 | 0.840 | 0.836 | 0.888 | 0.917 | 0.918 | 0.944 | 0.911 | 0.939 |
| 1996–1997 | 0.791 | 0.833 | 0.867 | 0.896 | 0.972 | 0.995 | 1.004 | 1.014 | 0.985 | 0.992 |
| 1997–1998 | 0.666 | 0.679 | 0.664 | 0.665 | 0.907 | 0.936 | 0.954 | 0.965 | 0.977 | 0.986 |
| 1998–1999 | 0.765 | 0.692 | 0.747 | 0.771 | 0.789 | 0.792 | 0.848 | 0.893 | 0.904 | 0.945 |
| 1999–2000 | 1.000 | 5.331 | 5.283 | 5.228 | 5.176 | 5.112 | 5.029 | 4.950 | 4.866 | 4.793 |
| 2000–2001 | 2.667 | 0.853 | 0.628 | 0.555 | 0.520 | 0.586 | 0.597 | 0.611 | 0.622 | 0.654 |
| 2001–2002 | 0.725 | 0.723 | 0.833 | 0.885 | 0.938 | 0.975 | 1.026 | 1.079 | 0.892 | 0.861 |
| 2002–2003 | 0.872 | 0.874 | 0.874 | 0.885 | 0.888 | 0.913 | 0.898 | 0.907 | 0.975 | 0.994 |
| 2003–2004 | 0.887 | 0.777 | 0.849 | 0.912 | 0.940 | 0.953 | 0.966 | 0.970 | 0.961 | 0.966 |
| 2004–2005 | 1.000 | 1.000 | 1.000 | 1.000 | 1.000 | 3.030 | 3.061 | 3.089 | 3.090 | 3.028 |
| 2005–2006 | 1.200 | 1.200 | 1.200 | 1.200 | 1.223 | 0.936 | 0.952 | 0.964 | 0.953 | 0.979 |
| 2006–2007 | 0.732 | 0.741 | 0.743 | 0.762 | 0.691 | 0.726 | 0.726 | 0.745 | 0.757 | 0.785 |
| 2007–2008 | 0.824 | 0.807 | 2.097 | 2.079 | 2.338 | 2.315 | 2.338 | 2.414 | 2.482 | 2.522 |
| 2008–2009 | 1.458 | 1.458 | 0.877 | 0.885 | 0.901 | 0.923 | 0.940 | 0.950 | 0.962 | 0.977 |
| 2009–2010 | 1.000 | 1.000 | 1.000 | 1.000 | 1.000 | 1.000 | 1.000 | 1.000 | 1.000 | 1.471 |
| 2010–2011 | 1.143 | 1.143 | 1.143 | 1.143 | 1.143 | 1.143 | 1.143 | 1.143 | 1.143 | 0.959 |
| 2011–2012 | 0.827 | 0.845 | 0.864 | 0.889 | 0.912 | 0.910 | 0.909 | 0.944 | 0.937 | 0.955 |
| 2012–2013 | 0.719 | 0.728 | 0.712 | 0.712 | 0.737 | 0.753 | 1.245 | 1.364 | 1.335 | 1.418 |
| 2013–2014 | 0.538 | 0.564 | 0.612 | 0.690 | 0.738 | 0.800 | 0.850 | 0.771 | 0.919 | 0.825 |
| 2014–2015 | 0.725 | 0.742 | 0.720 | 0.754 | 0.742 | 0.736 | 0.879 | 0.879 | 0.723 | 0.917 |
| 2015–2016 | 0.969 | 0.974 | 0.976 | 2.200 | 1.981 | 2.163 | 2.044 | 1.914 | 1.786 | 1.851 |
| 2016–2017 | 1.051 | 1.041 | 1.209 | 0.885 | 0.915 | 0.891 | 0.915 | 0.941 | 1.113 | 1.128 |
| 2017–2018 | 0.734 | 0.739 | 0.592 | 0.627 | 0.664 | 0.734 | 0.751 | 0.759 | 0.741 | 0.749 |
In Bangladesh, the TFP value is greater than 1 in 6 periods, equal to 1 in 3 periods, less than 1 in other periods. In Egypt, the TFP value is again greater than 1 in 6 periods, equal to 1 in 2 periods, less than 1 in other periods. In Indonesia, Iran, Mexico, Nigeria, there is a similar situation with Egypt, with different periods. In Pakistan, the TFP value is greater than 1 in 9 periods, equal to 1 in 2 periods, less than 1 in other periods. In Philippines, the TFP value is greater than 1 in 9 periods, equal to 1 in 1 period, less than 1 in other periods. In Korea, the TFP value is greater than 1 in 8 periods, equal to 1 in 1 period, and less than 1 in other periods. Finally, the TFP value in Turkey is greater than 1 in 8 periods and less than 1 in other periods. For all countries, TFP values in the periods 1999–2000, 2004–2005 and 2009–2010 have a score of more than 1 or 1.
The estimation results based on the maximum likelihood method using the balanced panel data set for the 1993–2018 period shown in Equation (6) are reported in Table 4.
Table 4 Tobit model estimation results
| TFP | Coef. | Std. Err. | z | P|z| | [95% Conf. Interval] | |
| LAB | 9.63 | 4.52 | 2.13 | 0.03 | 1.85 | 7.72 |
| CAP | 1.31 | 1.05 | 1.24 | 0.24 | 7.53 | 3.37 |
| REN | 2.49 | 8.35 | 2.99 | 0.00 | 8.57 | 4.13 |
| CAR | 8.45 | 7.61 | 0.11 | 0.91 | 1.58 | 1.41 |
| _cons | .86 | .05 | 16.69 | 0.00 | 0.76 | 0.96 |
| Number of obs: 260 | Uncensored: 173 | Left censored: 0 | Right-censored: 87 | Number of group: 10 Obs per group: | min: 26 avg:26.0 max:26 Integration pts.: 12 | |
The Tobit model was estimated with the STATA 16.0 package program. The results show that of the 260 observations, 173 were uncensored, that is, the dependent variable TFP value was below 1 and 87 were above the censored 1 from the top (right). Table 4 also contains coefficient estimates, standard errors, z statistics, P values and 95% confidence intervals. The P value of the LAB variable is 0.03 and it is statistically significant and negatively marked at the 5% significance level. No statistically significant results were obtained for the CAP and CAR variables. The REN variable is statistically significant and positively marked at the 1% significance level.
4 Conclusion
Unlimited desires force mankind to an infinite production process. It seems that it is almost impossible to produce without the need for at least one piece of equipment in everyday life. Therefore, at least one type of energy use is mandatory. In other words, energy is seen as the primary input for the economic expansion of any country. Unlike before the industry, today the demand for energy has expanded quite a lot. For this reason, the ability to reuse energy is a global problem. The remedy for the growing energy needs of the population is the use of renewable energy sources, known as the world’s fastest growing energy source. Only countries that can adapt renewable energy sources to their economic systems will be able to achieve sustainable development. For this reason, it is important to determine the impact of renewable energy use on economic efficiency. In this study, the relationship between economic efficiency and renewable energy for 10 developing countries was examined. Firstly, the productivity level of the countries between 1992 and 2018 was calculated by the Malmquist TFP index. The relationship between Malmquist TFP scores and renewable energy was estimated by regression based on the Tobit model. The results showed that renewable energy has a positive effect on economic efficiency. The increase in the supply of renewable energy increases the economic efficiency. This result shows that countries need to fully adapt to the economies of the subject of renewable energy. For this reason, significant investments should be made in the field of renewable energy. In particular, developing countries should develop policies for the allocation of sufficient resources to implement these investments. The costs of investments to be made should be well calculated. It is a fact that there are burdens that the transition to renewable energy will bring to the economy. But non-interference in this area will have irreversible economic, social and environmental consequences. Of course, it is not possible to switch from the use of non-renewable energy sources to renewable sources in a very short time. The issue of renewable energy is a global phenomenon and requires greater cooperation of countries at the international level.
References
[1] U.S. Energy Information Administration, https://www.eia.gov/energyexplained/what-is-energy/, Accessed Date: 01.08.2021
[2] Our Worl in Data, https://ourworldindata.org/grapher/global-energy-substitution?country=~OWID\_WRL, Accessed Date: 05.08.2021
[3] World Bank, https://databank.worldbank.org/source/world-development-indicators\#, Accessed Date: 10.08.2021.
[4] U.S. Energy Information Administration, https://www.iea.org/data-and-statistics, Accessed Date: 10.08.2021.
[5] U.S. Energy Information Administration, https://www.eia.gov/energyexplained/renewable-sources/, Accessed Date: 15.08.2021.
[6] Woo, Chungwon, Chung, Yanghon, Chun, Dongphil, Seo, Hangyeol, Hong, Sungjun (2015), The static and dynamic environmental efficiency of renewable energy: A Malmquist index analysis of OECD countries, Renewable and Sustainable Energy Reviews, 47(2015):367–368.
[7] International Institute for Sustainable Development, https://www.iisd.org/about-iisd/sustainable-development, Accessed Date: 15.08.2021.
[8] Naham, Adil and Cleveland, Cutler J. (2003), Energy and sustainable development at global environmental summits: An evolving agenda, Environment, Development and Sustainability, 5: 117–138.
[9] Vezzoli, Carlo, Ceschin, Fabrizio, Lilac, Osanjo, Mugendi, K. M’Rithaa, Moalosi, Richie, Nakazibwe, Venny, Diehl, Jan Carel (2018), Designing Sustainable Energy for All, Energy and Sustainable Development, 3–22.
[10] Bull, Stanley, R. (2001), Renewable energy today and tomorrow, Proceedings of The IEEE, 89(8):1216–1226.
[11] Peşkircioğlu, Nurettin (2016), 2030 Sürdürülebilir kalkınma hedefleri: Küresel verimlilik hareketine doğru, Kalkınmada Anathar Verimlilik Dergisi, 28(335): 4–9.
[12] Coelli, Timothy J., Rao, D. S. Prasada, O’Donnell, Christopher. J. and Battese, George E. (2005), An introduction to efficiency and productivity analysis, Springer Science & Business Media, Austrilia.
[13] Kara, Sedef E., Ibrahim, Mustapha, D. Ibrahim and Daneshvar, Sahand (2021), Sustainability, 13(7401):1–14.
[14] Chachuli, Fairuz Suzana Mohd, Ludin, Norasikin Ahmad, Jedi, Muhamad Alias Md and Hamid, Norul Hisham (2021), Transition of renewable energy policies in Malaysia: Benchmarking with data envelopment analysis, Renewable and Sustainable Energy Reviews 150 (2021) 111456:1–16.
[15] Sturm, JAN-EGBERT and Williams, Barry (2002), Deregulation, entry of foreign banks and bank efficiency in Australia, CESifo Working Paper, No: 816.
[16] Bozkurt, Eda and Topçuoğlu, Özlem (2019), Ar-ge etkinliğinin belirleyicileri üzerine bir tobit model uygulaması, Trakya Üniversitesi Sosyal Bilimler Dergisi, 21:141–163
[17] Özer, Hüseyin and Topçuoğlu, Özlem (2017), Türk çimento sektöründe mülkiyet etkinlik ilişkisi: VZA ve tobit model uygulaması, Verimlilik Dergisi, 4(4):141–168.
[18] Philip Andrew, Stevens (2005), Assessing the Performance of Local Government, National Institute Economic Review, 193(1):90–101.
Biography

Eda Bozkurt received the bachelor’s degree in economy from Atatürk University in 2006, the master’s degree in economy from Atatürk University in 2010, and the economy of doctorate degree in from Atatürk University in 2014, respectively. She is currently working as an Assoc. Prof. at the Faculty of Open Education, Atatürk University. Her research areas include economic development, energy, finance and trade. She has been serving as a reviewer for many highly-respected journals.
Strategic Planning for Energy and the Environment, Vol. 40_2, 163–174.
doi: 10.13052/spee1048-4236.4024
© 2021 River Publishers