Harmonic Analysis of Electric Transmission System of New Energy Vehicle
Xiaomin Xie1,*, Renwei Dou1, Yinping Yang2, Jun Xie1 and Xuanfu Du1
1School of Mechatronic Engineering, Anhui Vocational and Technical College, Hefei 230011, China
2Hefei Keweier Power System Co., Ltd., Hefei 230088, China
E-mail: 357106305@qq.com
*Corresponding Author
Received 29 November 2021; Accepted 08 December 2021; Publication 07 January 2022
Abstract
In order to improve the cruising range of new energy electric vehicles and solve the low efficiency of electric transmission system in low-speed driving stage, a space vector pulse width modulation algorithm is proposed. The simulation model is established by Matlab/Simulink software, and the test parameters of electric transmission system in the actual driving process of new energy electric vehicle are analyzed, and the harmonic distribution of line voltage of electric transmission system and the influence of battery bus voltage on harmonic content are explored. The actual test results show that reducing the difference between the bus voltage and the fundamental line voltage under actual electric transmission can reduce the harmonic content and improve the system efficiency. According to the characteristics of power generation system, a reliable motor optimization scheme is proposed to reduce harmonic content to improve the efficiency of electric transmission system of new energy vehicles.
Keywords: New energy electric vehicles, electric transmission system, harmonic distribution of line voltage, bus voltage.
1 Introduction
China’s 14th Five-Year Plan clearly points out that vigorously developing new energy vehicle technology will play a positive role in promoting China’s carbon peaking-carbon neutralization policy. The use and popularization of electric vehicle (EV) largely depend on the distance traveled, the number of charging places and the number of nodes [1, 2]. Through the sampling of voltage, current, temperature and other related data, the related circuits are controlled to achieve real-time monitoring, real-time control and humanized design, and the related data are sent to the display part and sent to the BMS controller through CAN bus, so that the charger is controlled by BMS to meet the requirements of the whole vehicle [3–5]. At present, built-in PMSM with high system efficiency is mostly used in EV motors, and the mainstream control method of this electric drive system is Space Vector Pulse Width Modulation (SVPWM) algorithm [6–9]. We first analyze the principle and control algorithm of SVPWM, then build a simulation model of SVPWM electric drive system under matlab/simulink environment, test the change of SVPWM voltage harmonic content under different battery bus voltage conditions at low speed, and study the relationship between them. Finally, we give the methods to reduce harmonics and optimize EV electric drive system scheme.
2 Analysis and Calculation of Electric Drive System Parameters
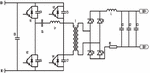
The circuit of SVPWM full-bridge converter is shown in Figure 1. Among them, V1V4 are four main switch tubes, each of which has a body diode inside, C4C7 are parasitic capacitors of V1V4, Lr is resonant inductor, T is high-frequency transformer, D1D4 is output rectifier diode, C1, C2 and C3 are output filter capacitors. This converter adopts phase-shifting control, and the two power tubes of each bridge arm are in complementary conduction of 180 degrees, and the conduction angles of the two bridge arms differ by one phase, that is, the phase-shifting angle, and the output voltage can be adjusted by adjusting the phase-shifting angle. In this scheme, the phase shift angle changes with the change of voltage and current. Because V1 and V2 are ahead of V4 and V3 by one phase respectively, the bridge arm composed of V1 and V2 is called the leading bridge arm, and the bridge arm composed of V3 and V4 is the lagging bridge arm. The converter uses phase-shifting control method to realize zero-voltage switching by using resonant inductance and parasitic capacitance of power tube or external capacitance, thus improving the efficiency and reliability of power supply and reducing EMI. In order to realize SVPWM in a wide load range, the design of resonant inductor is the key, and resonant inductor must provide enough energy to realize SVPWM.
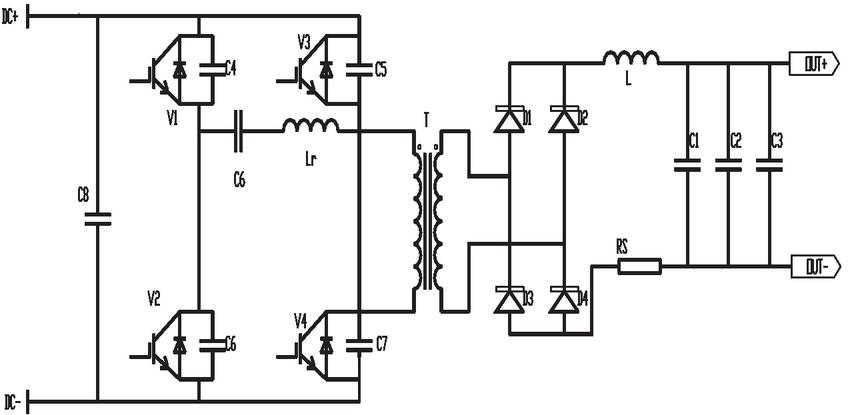
Figure 1 Single-phase full bridge converter.
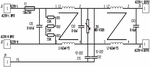
EMI filtering: according to the requirements of electromagnetic compatibility, a two-stage filtering circuit (see in Figure 2) is adopted. The fuse adopts the merit slow-breaking fuse 30A/250VAC, the magnetic ring adopts the ferrite magnetic ring H 311913 (material R10K/M) made by Qixing Flight (or equivalent quality manufacturer), and the varistor adopts the 471D20 made by Junyao Company.

Figure 2 EMI filter diagram.
Since the power supply adopts single-phase input, the input minimum working voltage is Vin_min 220 (1–15%) 187V. The maximum output power of the power supply for normal operation is Pout_max 3300W. The efficiency is selected as (full load). The maximum input current of the power supply is calculated as:
According to the above calculation, the maximum input current is 18.2A, so the input buffer relay can be selected as the commonly used Hongfa (or Matsukawa) relay HF2100-1A-12DEF with 30A current. The maximum peak reverse breakdown voltage of the input rectifier bridge is calculated according to 120% of the maximum peak input voltage; Its value is:
Maximum average forward current of diode:
The maximum input current is 18.2A. According to the principle of voltage drop of at least 60% and current drop of at least 50%, a rectifier bridge with 800V withstand voltage and 50A forward average current can be selected, and two VISHAY rectifier bridges GSIB2580 can be selected in parallel. In the design of power supply, set the output voltage of PFC (power factor correction) as . The switching frequency of PFC operation is . According to the input voltage, the maximum duty cycle of Boost PFC can be calculated as follows:
Select the peak-to-peak value of ripple current on Boost inductor as 20% of the maximum peak line current:
The ripple current is I 0.2A. According to the above parameters, the inductance of PFC can be calculated, and with 20% margin, the inductance is:
Considering the overall dimensions of the electric drive system and other requirements, the load is the storage battery, and in theory, the output filter capacitor is not needed. Considering the voltage ripple, according to
Because the current in the output filter inductor flows unidirectionally, the current flowing through the winding has a larger DC component and a smaller alternating component with a frequency of 140 kHz(2*70 kHz), which belongs to the third working state, so the maximum working magnetic density of the magnetic core can be very high, close to the saturation magnetic density. The maximum inductance current is
According to the formula,
Among , , , , , , .
When the reference voltage vector U which is expected to be output rotates to a certain sector, it can be linearly combined by two basic non-zero vectors U and U which constitute the sector, acting for a period of time T and T respectively [10–12]. In SVPWM modulation scheme, proper selection of zero vector can minimize switching times and reduce switching losses. As long as the zero vectors are evenly distributed in time, symmetrical SVPWM waves can be generated. U can finally be expressed as:
| (1) |
T is the SVPWM sampling period, and T, T, T and T are the action times of U, U, U and U respectively. The realization of SVPWM control algorithm is divided into the following two steps:
(1) jud that sector N where the reference voltage vector is located
U can be expressed as U U jU after being transformed into (, ) coordinate system by two-phase/three-phase coordinate transformation. Define intermediate variables , and :
| (2) |
Define variables m, n and x, if U, then m 1, otherwise m 0; n 1 if U, otherwise n 0; x 1 if U, otherwise x 0. Sector N m 2n 4x.
(2) calculate that action time of two basic vectors of the sector
Define the intermediate variables p, q and k as:
| (3) |
The action time T and T of that two basic vectors of the sector are shown in Table 1.
Table 1 T, T assignment table
| Sector N | ||||||
| 1 | 2 | 3 | 4 | 5 | 6 | |
| T | k | q | k | p | p | q |
| T | q | p | p | k | q | k |
| Note: T indicates the vector action time occurring first, and T indicates the vector action time occurring later. | ||||||
When T T T, the inverter enters the over-modulation state, and the output waveform is seriously distorted. At this time, a scaling algorithm is usually used for processing, namely T T T/(T T), T T T/(T T).
3 Simulation Test Analysis
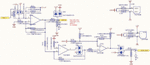
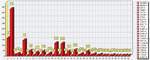
Based on the above SVPWM control algorithm and the voltage harmonics are analyzed by FFT tool in powergui. The simulation model is shown in Figure 3. On the basis of establishing the simulation model, the parameters of harmonic analysis are set as follows: the fundamental frequency of the signal is 50Hz, the sampling frequency of V06-L is 1.25MHz, and the order of harmonic calculation is 40 times. According to the simulation, harmonic details are obtained, including the distribution of effective value and power content. See the harmonic energy distribution curve as shown in the Figures 4 and 5 for details. The results are as follows: total harmonic distortion: 3.7%, total effective value: 22.00, fundamental effective value: 22.00, fundamental content: 99.90%.
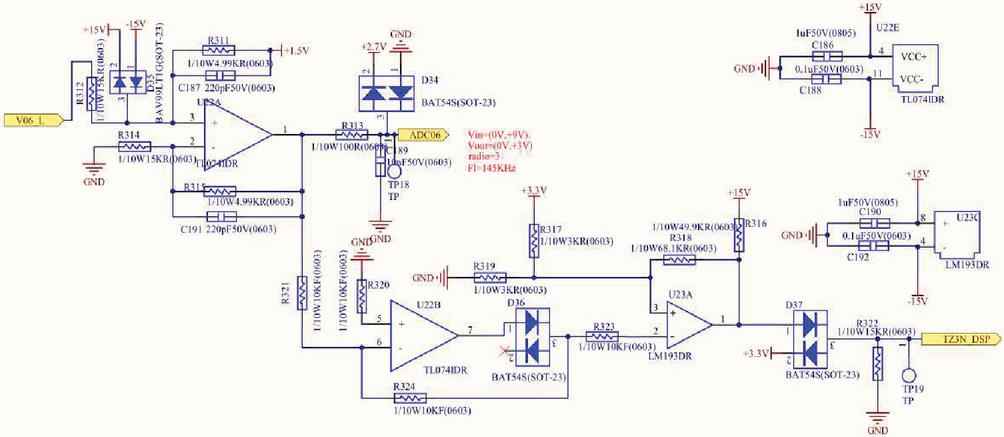
Figure 3 SVPWM simulation model of EV electric drive system.
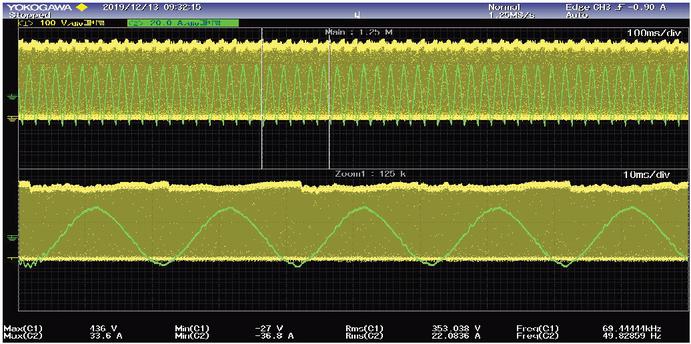
Figure 4 Harmonic and fundamental distortion curve.

Figure 5 Harmonic energy distribution curve.
When the PFC inductor in the electric drive system is changed to 6K inductor and the software program is changed, PFC current sampling is changed from ADC00 to ADC14, C86 is changed from ADC02 to ADC15, voltage sampling is changed from ADC 02 to ADC 15, and C85 is changed from ADC 10 to 470nF. The total harmonic distortion is 3.5%, the fundamental rms and total rms are 19.33, and the fundamental wave content is 99.99%, which is improved to some extent compared with before improvement. Its harmonic curve and harmonic energy distribution curve are shown in Figure 6 and 7 respectively.
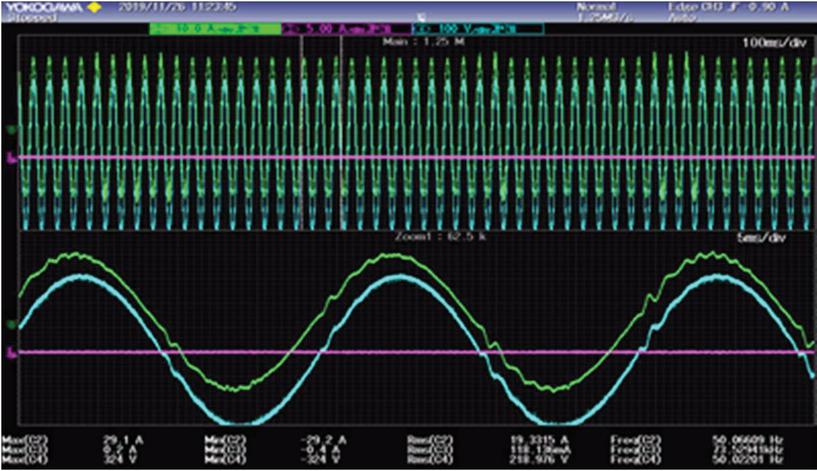
Figure 6 Harmonic curve with total RMS of 19.33.
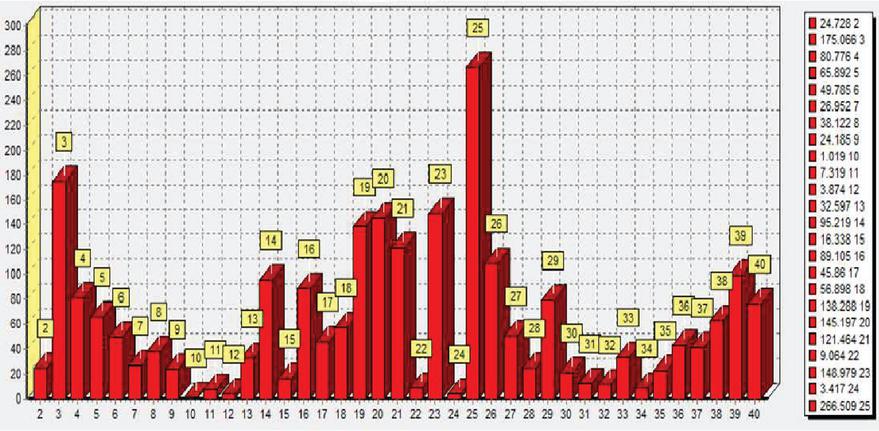
Figure 7 Harmonic energy distribution curve with reduced total distortion.
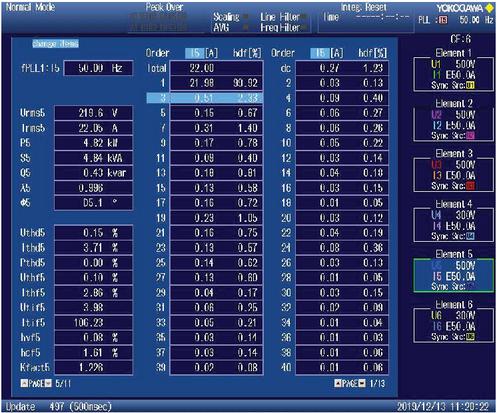
Figure 8 Statistical analysis with f 50.00 Hz.
When the fundamental frequency is 49.98Hz and 50.00Hz respectively, the total effective value, energy distribution and proportion statistics of harmonic components are shown in Figures 8 and 9 respectively.
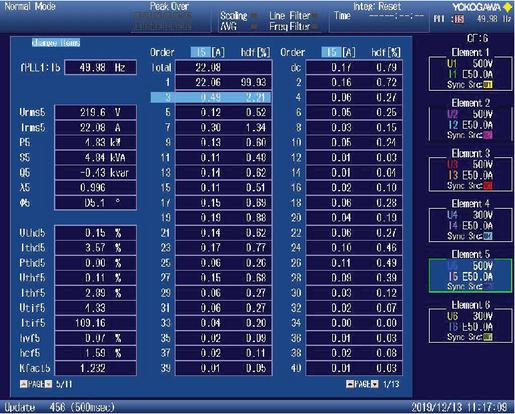
Figure 9 Statistical analysis with f 49.98 Hz.
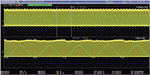
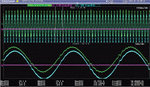
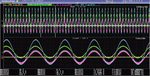
The capacitance of current sampling DSP port is 680nF, the capacitance of mains voltage sampling DSP port is 68nF, the PFC inductor is changed to 6k inductor, the input filter is added with 300uH differential-mode inductor, 10uF differential-mode capacitor is added before the differential-mode inductor and 2.2uF capacitor is added after the differential-mode inductor. The auxiliary power supply is powered by charger instead of external auxiliary power supply. The simulation waveform diagram is shown in the Figure 10.
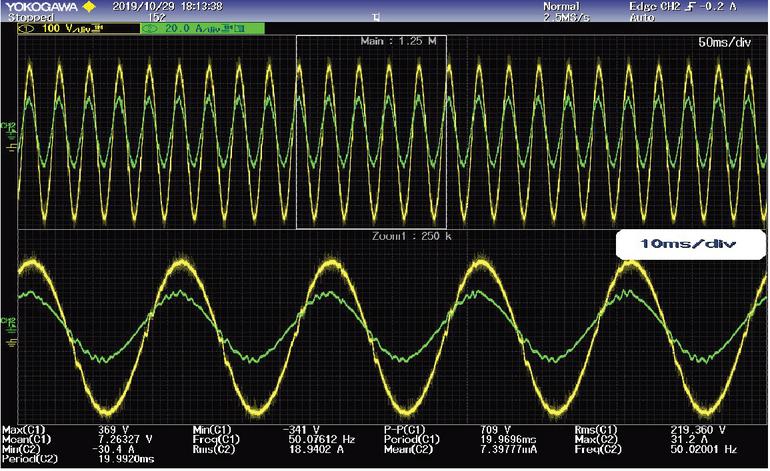
Figure 10 The simulation waveform diagram.
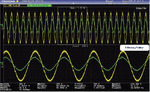
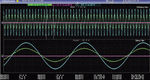
Input filter and external auxiliary power supply and whole machine (charger and APS is turned on but not connected to the control board), C12 is 1uF charger harmonic current test, loop parameters R6 are 5.1 k, C5 is 1nF,C34 is 470pF, current sampling DSP port capacitance is changed to 680nF, voltage sampling DSP port capacitance is 68nF, current sampling is changed to ADC00 port (changed from pin42 to pin52), and bypass voltage sampling is changed to mains voltage sampling. The simulation waveform diagram is shown in Figure 11.
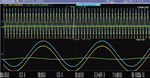
Input filter and external auxiliary power supply and whole machine, the capacitance of current sampling DSP port is changed to 680nF, that of voltage sampling DSP port is 68nF, that of current sampling ADC00 port is changed to ADC14 port (changed from pin42 to pin52), that of input voltage sampling is changed to bypass voltage sampling (operational amplifier), that of DSP port is changed from ADC03 to ADC05, and that of the filter removes differential mode inductance and differential mode capacitance of the previous stage. The simulation waveform diagram is shown in Figure 12.
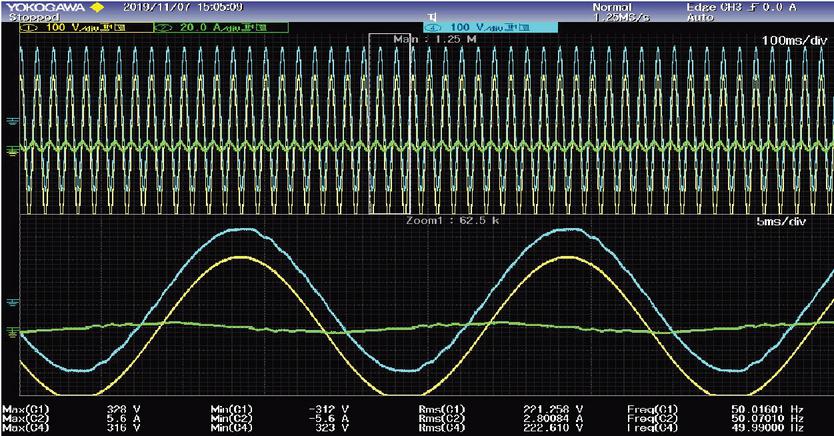
Figure 11 The simulation waveform diagram with 470pF.
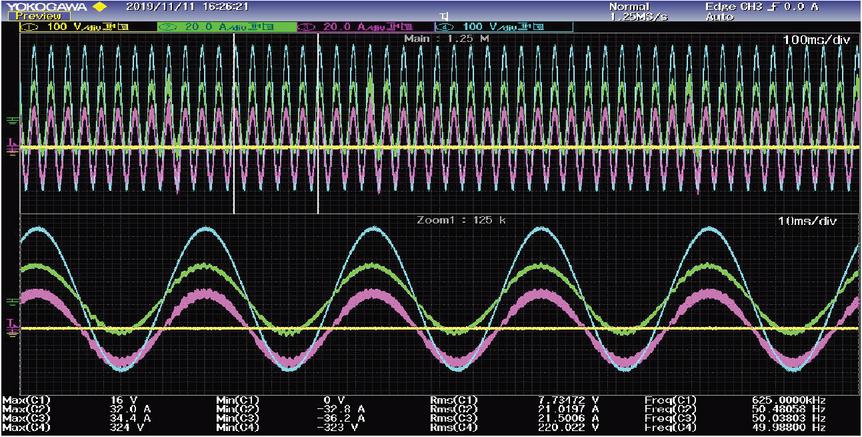
Figure 12 The simulation waveform diagram with 680nF.
Debugging with external filter, external auxiliary source and the whole machine, PFC current sampling C69 is 470nF, voltage sampling C71 is changed from 10nF to 68nF, PFC inductance is changed to 6K inductance, and the software program is modified. After the filter, the harmonic content can be reduced by connecting the L-line into the 1mH amorphous inductor in advance, and reducing the difference between the bus voltage and the fundamental voltage. The statistical situation of harmonic content distribution is shown in Figure 13. The test waveform diagram that can reduce harmonic components after improvement is shown in Figure 14.
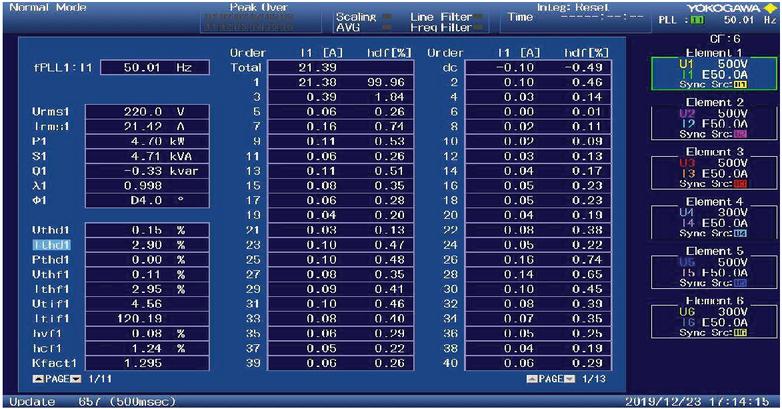
Figure 13 The statistical situation of harmonic content distribution.
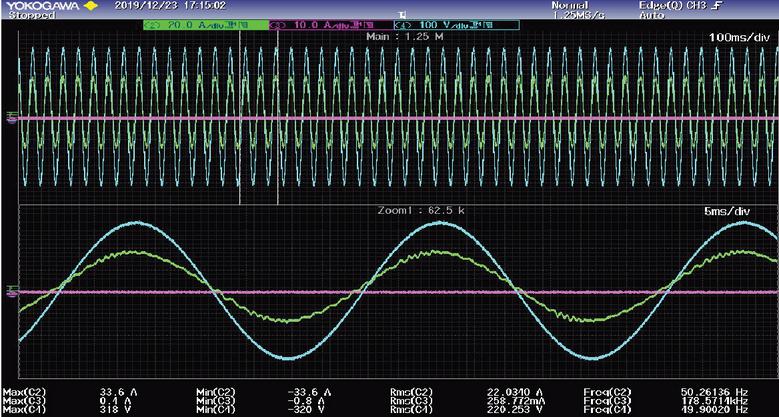
Figure 14 The test waveform diagram that can reduce harmonic components.
4 Conclusion
Based on the analysis of SVPWM algorithm and the influence of battery bus voltage on harmonic and efficiency of electric drive system under different working conditions in low-speed area is discussed, and the following conclusions are obtained [11, 12].
(1) The harmonics of the electric drive system are mainly distributed around the frequency which is an integral multiple of the sampling frequency.
(2) The fundamental line voltage required in EV low speed area is lower, which is much smaller than the battery bus voltage. Generally, the lower the EV speed, the lower the required fundamental line voltage.
(3) When the fundamental line voltage required for working conditions is too small and far away from the bus voltage, the harmonic component is basically even harmonic, and its content can be equal to or even exceed the fundamental component, resulting in a substantial increase in total harmonic distortion and low energy efficiency of EV electric drive system.
(4) The higher the battery voltage, the more harmonic content, the greater the total distortion, and the lower the system efficiency when the low-speed working environment is constant and the fundamental line voltage of the electric drive system is constant.
(5) The closer the fundamental line voltage amplitude and bus voltage are, the lower the harmonic content produced by the system.
From the above conclusions, it can be seen that the amplitude of line voltage required and the difference between them has a great influence on the harmonic content of line voltage, which will affect the efficiency of motor system and EV cruising range. Therefore, measures should be taken to reduce the gap between them, for example, under other conditions being the same, increase the number of winding turns of motor appropriately and improve the amplitude of line voltage at low speed of motor; When the cost allows, select the appropriate battery voltage.
Fund Project: Key Projects of 2020 Excellent Talents Support Program in Colleges and Universities (gxyqZD2020055);
Natural Science Research Key Project of Anhui Province Higher School (KJ2019A0991);
Key Natural Research Projects of Anhui Vocational and Technical College in 2020 (azy2020kj04);
2021 Anhui Vocational and Technical College Quality Engineering Quality Improvement and Excellence Action Plan Special Project-Key Research Project of Education and Teaching (2021xjtz029).
References
[1] Habib S, Khan M M, Abbas F, Sang L, Shahid M U, Tang H. A comprehensive study of implemented international standards, technical challenges, impacts and prospects for electric vehicles. IEEE Access: Practical Innovations, Open Solutions, 2018, 6: 13866–13890.
[2] Hou K, Xu X, Jia H, Yu X, Jiang T, Zhang K, Shu B. A reliability assessment approach for integrated transportation and electrical power systems incorporating electric vehicles. IEEE Transactions on Smart Grid, 2018, 9(1): 88–100.
[3] Li, Z., Khajepour, A., Song, J.: A comprehensive review of the key technologies for pure electric vehicles. Energy 182, 824–839 (2019).
[4] Du, J., Li, F., Li, J., Wu, X., Song, J., Zou, J., Ouyang, M.: Evaluating the technological evolution of battery electric buses: China as a case. Energy 176, 309–319 (2019).
[5] Kumar, P.R., Alok, K.: Adoption of electric vehicle: a literature review and prospects for sustainability. J. Clean. Prod. 253, 119911 (2020).
[6] Di Somma M, Graditi G, Heydarian-Forushani E, Shafie-khah M, Siano P. Stochastic optimal scheduling of distributed energy resources with renewables considering economic and environmental aspects. Renewable Energy, 2018, 116: 272–287.
[7] Lee, W., Li, S., Han, D., Sarlioglu, B., Minav, T.A., Pietola, M.: A review of intergrated motor drive and wide-bandgap power electronics for high-performance electro hydrostatic actuators. IEEE Trans. Transp. Electrif. 3(4), 684–693 (2018).
[8] Zhao, X., Niu, S., Zhang, X., Fu, W.: A new relieving-DC-saturation hybrid excitation Vernier machine for HEV starter generator. IEEE Trans. Ind. Electron. 8(67), 6342–6353 (2020).
[9] Sachan S, Adnan N. Stochastic charging of electric vehicles in smart power distribution grids. Sustainable Cities and Society, 2018, 40: 91–100.
[10] Li, G., Hu, J., Li, Y., Zhu, J.G.: An improved model predictive direct torque control strategy for reducing harmonic currents and torque ripples of five phase permanent magnet synchronous motors. IEEE Trans. Ind. Electron. 66, 5820–5829 (2018).
[11] Li, K., Bouscayrol, A., Han, S., Cui, S.: Comparisons of electric vehicles using modular cascade machines system and classical single drive electric machine. IEEE Trans. Veh. Technol. 1(67), 354–361 (2018).
[12] Al-Adsani, A.S., Beik, O.: Design of a multiphase hybrid permanent magnet generator for series hybrid EV. IEEE Trans. Energy Convers. 3(33), 1499–1507 (2018).
Biographies

Xiaomin Xie received the bachelor’s degree in Electronic Information Engineering from Anhui Jianzhu University in 2008, the master’s degree in detection technology and automatic equipments from China civil aviation university in 2011, respectively. He is currently working as an lecturer at the Department of School of Mechatronic Engineering, Anhui Vocational and Technical College. His research areas include circuit fault diagnosis and intelligent detection, deep learning, and neural network analysis.

Renwei Dou received the bachelor’s degree in Electronic Information Engineering from Anhui university of finance and economics in 2006, the master’s degree in power electronic technology from University Of Anhui in 2020, respectively. He is currently working as an lecturer at the Department of School of Mechatronic Engineering, Anhui Vocational and Technical College. His research areas include circuit fault diagnosis and intelligent detection, deep learning.

Yinping Yang received the bachelor’s degree in Electronic Information Engineering from Anhui Jianzhu University in 2008, the master’s degree in detection technology and automatic equipments from Hefei University of Technology in 2011, respectively. He is currently working as an senior engineer at Hefei Keweier Power System Co., Ltd. His research areas include Development and Research on Switching Power Supply an Transmission System of New Energy Vehicle.

Jun Xie received the bachelor’s degree in Industrial Automation from Huainan Mining Institute in 1996, the master’s degree in Power Electronics and Power Drives from Anhui University of Science and Technology in 2005, the doctor’s degree in electrical engineering from Anhui University of Science and Technology in 2013, respectively. He is currently working as an associate professor at the Department of School of Mechatronic Engineering, Anhui Vocational and Technical College. His research areas include New power electronic device.

Xuanfu Du received the bachelor’s degree in Mechanical Manufacture and Automation from Hefei University of Technology in 2014, the master’s degree in Mechanical Manufacture and Automation from Hefei University of Technology in 2017, respectively. He is currently working as an Teaching assistants and R&D engineers at the Department of School of Mechatronic Engineering, Anhui Vocational and Technical College. His research areas include Electric power technology research, and neural network analysis.
Strategic Planning for Energy and the Environment, Vol. 40_3, 279–296.
doi: 10.13052/spee1048-4236.4034
© 2022 River Publishers