A Hybrid Evaluation Method of Ecological Environment Quality Based on Entropy and Matter-Element Extension Model
Ran Wang1, Jianjun Wang1, 2,* and Yun Teng1
1School of Economics and Management, North China Electric Power University, Beijing, China
2Beijing Key Laboratory of New Energy and Low-Carbon Development (North China Electric Power University), Beijing, China
E-mail: wangjianjun@ncepu.edu.cn
*Corresponding Author
Received 08 December 2021; Accepted 20 December 2021; Publication 25 January 2022
Abstract
The ecological environment of China is facing much more pressure with the continuous growth of population and energy usage. China pays more attention to improving the ecological environment quality with the ecological civilization development in the situation. The key problem is to construct a scientific and reasonable comprehensive evaluation index system guiding the ecological environment quality improvement. This paper creates a comprehensive evaluation index system of ecological environment quality based on the Pressure-State-Response (PSR) framework and uses a hybrid model with the entropy weight method and matter-element extension to evaluate China’s ecological environment quality from 2016 to 2020. The results show the overall ecological environment quality evaluation level in China is continuously improved. The results also show that China should pay much attention to the four main factors, which are population density, carbon emissions, per capita energy consumption, and per capita arable land, it should take some policies to improve the four factors. The case study has proven the effectiveness and practicality of the hybrid method and the comprehensive evaluation index system.
Keywords: Ecological environment quality, entropy evaluation, PSR, matter-element extension.
1 Introduction
Due to the Chinese government paying attention to the ecological environment development, and China has decided to try its best to control carbon-emission, and help the global to achieve below 2C. The ecological environment is a complex ecosystem related to social and economic sustainable development, it is always concluding the quantity and quality of water resources, land resources, biological resources, and climatic resources (Wang and Zhao, 2016). To accurately evaluate the quality of the ecological environment is very important to promote the sustainable development of human society and the natural environment (Wu et al., 2020), and it is also important to help guide national sustainable development (He et al., 2018, Zhang et al., 2017).
Ecological sustainability development is an important part of the current social ecosystem, it is believed that the evaluation combines various factors from a macroeconomic perspective. The core problem of ecological environment quality is how to build the evaluation indicator system (Wu et al., 2021), however, what and which influence factors should choose is a hard problem. Organization for Economic Cooperation and Development (OECD) and the United Nations Environment Programme (UNEP) are promoting an evaluation frame from three aspects of ecological stress, ecosystem health, and ecological sustainability (Hu et al., 2021), and forming an integrated Pressure-State-Response (PSR) model of ecological environment quality evaluation (Qiu et al., 2008), in which, pressure(P) refers to the pressure of human activities on the ecological environment, state(S) refers to the current situation of the ecological environment, and response(R) refers to the measures taken to alleviate the deterioration of the ecological environment and implement the construction of ecological civilization (Fu et al., 2011, Das et al., 2008).
Many scholars have also studied the ecological environment quality evaluation from the PSR perspective. Boori et al. (2021) evaluate ecological environment quality based on the Pressure-State-Response (PSR) frame and remote sensing GIS technology. Rapport et al. (2006) trace the evolution of SOER based on the PSR model and provide some building blocks to overcome its current limitations. Probst et al. (2016) Through comparative analysis, it is pointed out that the requirements of the PSR and MSFD are more consistent, and can be applied to the standards in other descriptors to obtain a consistent index structure in MSFD. Li et al. (2021) used the PSR model and Rough Set theory to evaluate the ecological stability of coastal estuaries in China. Sun et al. (2018) constructed a comprehensive evaluation model based on the PSR model and evaluated the ecological security level of urban agglomeration in the Pearl River zones of China. These researches prove that the PSR frame effectively evaluates the ecological-related environment-related areas and gets good results.
Due to the successful experience of the PSR frame to evaluate the ecological environment areas, this paper also uses the PSR frame to consider how to evaluate Chinese ecological environment quality and creates an index system from the Pressure, State, Response three aspects, including in the PSR frame. The Entropy and Matter-Element extension evaluation method is used to obtain the scientific evaluation result of the Chinese ecological environment quality from 2016 to 2020, in the thirteenth-five period of China. Some results analysis and suggestions are given at the end of the paper.
2 Ecological Environment Quality Evaluation Index System Based on PSR
Based on the PSR model, to evaluate the quality of the ecological environment needs consider three aspects of pressure, state, and response. In this paper, the details of the three aspects are considered as follows.
(1) Pressure The pressure indicators are including seven indicators, namely, population density (Yi et al., 2018), unit fertilizer use (Hua et al., 2017), carbon emissions (Song et al., 2020, Donohue et al., 2013, Mao et al., 2013), wastewater emissions (Hu et al., 2021), besides, we also consider the indicators as per capita energy consumption, which can reflect the energy usage situation of national economic development, and the secondary industry’s share of GDP, and residents’ disposable income are also considering in the pressure because the two indicators are always considering a national macroeconomic situation.
(2) State The state indicators are also including seven indicators, namely, per capita arable land (Mueller et al., 2014, Hua et al., 2017), per capita water resources (Hu et al., 2021), forest cover rate (Xu et al., 2020), besides, we also consider the national nature reserve area, per capita park green space, these two indicators can reflect the green condition of a national area, and the number of environmental emergencies and soil erosion area are also considering in the state aspect because the two indicators can reflect the soil state of a national region.
(3) Response The response indicators are including six indicators, namely, the proportion of environmental protection investment, the proportion of drinking water treatment investment (Hu et al., 2021), the rate of forestry pest control (Zhang et al., 2018). Some research has found that the educated people and fully science knowledge person always give high response of the environment protection response, so this paper considers the proportion of science and education investment. How to deal with the waste is also reflecting the human response of protecting the environment, therefore, the rate of domestic sewage treatment and the harmless treatment rate of domestic garbage are considered in the response aspect.
Based on the above analysis, the ecological environment quality evaluation index system of China is created in Table 1.
Table 1 Ecological environment quality evaluation index system
| Goal Layer | Criterion Layer | Indicator Layer | Unit | Tendency |
| Ecological | Pressure B1 | Population Density C1 | People/km2 | Negative |
| Environment Quality A | Residents’ Disposable Income C2 | ¥ | Positive | |
| Unit Fertilizer Use C3 | Tons per hectare | Negative | ||
| Carbon Emissions C4 | Hundred million tons | Negative | ||
| Wastewater Emissions C5 | Ten thousand tons | Negative | ||
| Per Capita Energy Consumption C6 | Ten thousand tons of standard coal | Negative | ||
| the Secondary Industry’s Share of GDP C7 | % | Negative | ||
| Status B2 | Per Capita Arable Land C8 | acre | Positive | |
| Per Capita Water Resources C9 | m | Positive | ||
| Forest Cover Rate C10 | % | Positive | ||
| National Nature Reserve Area C11 | Ten thousand hectares | Positive | ||
| Per Capita Park Green Space C12 | m | Positive | ||
| the Number of Environmental Emergencies C13 | meta | Negative | ||
| Soil Erosion Area C14 | Ten thousand km | Positive | ||
| Response B3 | the proportion of environmental protection investment C15 | % | Positive | |
| the rate of domestic sewage treatment C16 | % | Positive | ||
| the proportion of science and education investment C17 | % | Positive | ||
| the proportion of drinking water treatment investment C18 | % | Positive | ||
| the harmless treatment rate of domestic garbage C19 | % | Positive | ||
| the rate of forestry pest control C20 | % | Positive |
3 Data Collection and Evaluation Methods
3.1 Data Source and Data Preprocessing
The indicator values have been collected from the public government announcement data sources, which are mainly divided into the four following aspects: (1) Government documents. This part mainly refers to the National Science and Technology Funds Investment Statistics Bulletin (2016–2020), National Bureau of Statistics of the People’s Republic of China (2014), Statistical Bulletin of the National Economic and Social Development (2016–2020), Government Work Report (2016–2020) and public documents of various government departments, mainly published by the National Bureau of Statistics. (2) Statistical Yearbook. The macroeconomic indicator values mainly refer to China Statistical Yearbook and China Environmental Statistics Yearbook. (3) News websites. This part mainly includes People’s Network, Xinhua Network, China Daily, and so on.
A few data missing phenomena are existing in the data collection step. Since the indicators selected include positive indicators and negative indicators, and also considering that the indicator value has a trend of growth or decrease, the missing value adopts two methods: (1) If the indicator is valued for both the previous year and the following year, the missing value for that year is replaced by the average of the upper and lower values. (2) If the missing value is located at both ends, it is calculated based on annual average growth rates or average reduction rates for each year.
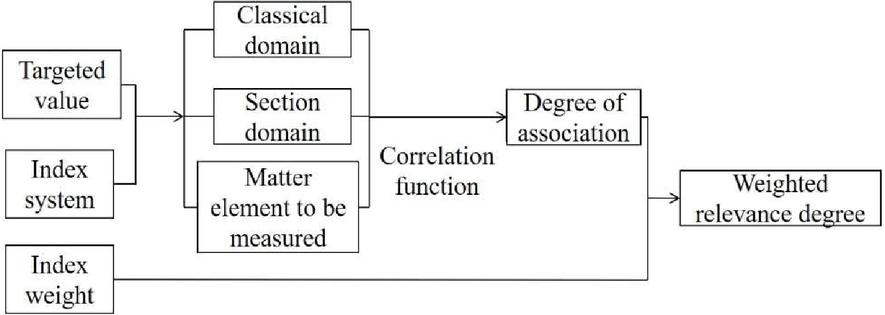
Figure 1 Modeling flow chart of the matter-element extension model.
3.2 Evaluation Model Based on Entropy and Matter-Element Extension Model
The matter-element extension model theory is proposed by Chinese scholar Cai Wen based on matter-element theory and extension theory (Ng et al., 1997). Many scholars use this method for comprehensive evaluation. Seyedmohammadi et al. (2019) evaluate the suitability of agricultural land based on matter elements, AHP, and GIS. It determines the development status or realization level of the object both qualitative and quantitative, and the matter-element extension model is also considering the possibility of things changing. According to the existing standards and related information, the numerical standards of five grades of excellence, good, medium, qualified and poor are determined by the experts or standards firstly, and the classical domains of the different grades, as well as the matter-element matrix of the nodal domain and the matter-element matrix to be measured, are established. The entropy weight method is used to calculate the weight of each indicator. Then, the correlation degree is obtained through the correlation function, and the correlation degree is weighted. The maximum correlation degree is selected as the final evaluation grade. The flow chart of the specific model is as follows:
This paper is focused on the ecological environment quality problem, expressed by N of things has the characteristic indicators C, and the corresponding value of its characteristic is V. Then the ordered triple , C, V) composed of N, C, and V is used to describe the basic elements of things, referred to as matter-element. In this paper, the matter-element matrix is denoted as Equation (1).
| (1) |
3.2.1 Determine the classical domain, section domain, and measured element
(1) Determine the classical domain matter-element matrix According to common division in most papers, the quality of the ecological environment is divided into five levels, namely excellent, good, medium, qualified, poor, a total of 20 indicators, then ecological environmental quality with five evaluation levels , , and the range of eigenvalues corresponding to each evaluation indicator constitutes the matter-element matrix of the classic domain as Equation (2):
| (2) |
Where: R is the matter-element matrix of the i-th evaluation level, a is the upper limit of the value range of the characteristic value V corresponding to the indicator C, and b is the lower limit, respectively. N is the j-th grade in the comprehensive evaluation of ecological environment quality.
(2) Determining the section domain matter-element matrix The section domain matter-element matrix is composed of the ecological environment quality, the corresponding indicator, and the overall characteristic value range of the indicator, which is denoted as R. The specific representation of R is shown in Equation (3).
| (3) |
Where: V is the overall value range of the characteristic value of the i-th indicator under the comprehensive evaluation level of ecological environment quality: a is the upper limit of the value range of the characteristic value V corresponding to the indicator C; b is the upper limit of the value, and is the section domain.
The classical domain matter-elements and the section domain matter-element matrix is as follows:
Table 2 The classical domain matter-elements and the section domain matter-element matrix
| Indicator | Excellence | Good | Medium | Qualified | Poor | Section Domain |
| C | (20,68) | (69,105) | (106,159) | (160,253) | (254.859) | (20,859) |
| C | (51257.3,57789.5) | (39914.8,51257.2) | (30132.6,39914.7) | (22957.3,30132.5) | (15598.3,22957.2) | (15598.3,57789.5) |
| C | (0,0.158) | (0.159,0.225) | (0.226,0.596) | (0.597,0.731) | (0.732,0.901) | (0,0.901) |
| C | (457,578) | (579,1296) | (1297,9097) | (9098,10593) | (10594,11564) | (457,11564) |
| C | (1010.23,2563.54) | (2563.55,5969.39) | (5969.4,7369.88) | (7369.89,13059.64) | (13059.65,15196.21) | (1010.23,15196.21) |
| C | (0.1563,0.3531) | (0.3532,0.3969) | (0.397,0.4948) | (0.4949,5.1549) | (5.155,5.8967) | (0.1563,5.8967) |
| C | (0.3917,0.4536) | (0.3036,0.3916) | (0.2516,0.3035) | (0.2016,0.2515) | (0.1536,0.2015) | (0.1536,0.4536) |
| C | (0.0019,0.0023) | (0.0014,0.0018) | (0.0011,0.0013) | (0.0008,0.001) | (0.0006,0.0008) | (0.0006,0.0023) |
| C | (0.8185,0.9236) | (0.7078,0.8184) | (0.5013,0.7077) | (0.2123,0.5012) | (0.1857,0.2122) | (0.1857,0.9236) |
| C | (50.25,64.01) | (33.75,50.24) | (25.13,33.74) | (20.36,25.12) | (13.26,20.35) | (13.26,64.01) |
| C | (11569.6,15130.1) | (9015.6,11569.5) | (8364.2,9015.5) | (6564.2,8364.1) | (5826.3,6564.1) | (5826.3,15130.1) |
| C | (15.1,15.7) | (14.1,15) | (12.9,14) | (11.3,12.8) | (10.5,11.2) | (10.5,15.7) |
| C | (103,197) | (198,305) | (306,368) | (369,437) | (438,551) | (103,551) |
| C | (30.65,38.71) | (38.72,42.72) | (42.73,48.59) | (48.6,55.37) | (55.38,57.43) | (30.65,57.43) |
| C | (0.0315,0.0476) | (0.0201,0.0314) | (0.0153,0.02) | (0.0106,0.0152) | (0.0025,0.0105) | (0.0025,0.0476) |
| C | (93.8,100) | (90.3,93.7) | (86.1,90.2) | (83.3,86) | (80.5,83.2) | (80.5,100) |
| C | (0.1652,0.1998) | (0.1272,0.1653) | (0.1159,0.1271) | (0.1059,0.1158) | (0.0931,0.1058) | (0.0931,0.1998) |
| C | (0.0977,0.1015) | (0.0952,0.0976) | (0.0931,0.0951) | (0.0856,0.093) | (0.0801,0.0855) | (0.0801,0.1015) |
| C | (95.3,100) | (93.6,95.2) | (90.8,93.5) | (88.5,90.7) | (83.1,88.4) | (88.4,100) |
| C | (82,95.3) | (76.6,81.9) | (68.3,76.5) | (66.5,68.2) | (56.7,66.4) | (56.7,95.3) |
(3) Determining the measured matter-element matrix The measured matter-element matrix is composed of ecological environment quality-related indicator and their values, which is denoted as R, and its specific expression is shown in Equation (4):
| (4) |
Where: R is the element to be measured and N is the object to be measured.
According to the data collection and above calculated method, The matter-element matrix to be measured is shown in Table 3:
Table 3 The measured matter-element matrix
| Indicator | 2016 | 2017 | 2018 | 2019 | 2020 |
| C | 145 | 146 | 146 | 147 | 147 |
| C | 23821.0 | 25973.8 | 28228.0 | 30732.8 | 32188.8 |
| C | 0.891 | 0.864 | 0.828 | 0.787 | 0.759 |
| C | 9248 | 9340 | 10154 | 9806 | 10357 |
| C | 6843.78 | 6824.98 | 6824.98 | 6821.34 | 6812.97 |
| C | 0.3903 | 0.4104 | 0.4300 | 0.4376 | 0.5266 |
| C | 0.3958 | 0.3985 | 0.3969 | 0.3859 | 0.3782 |
| C | 0.0010 | 0.0010 | 0.0010 | 0.0010 | 0.0009 |
| C | 0.2332 | 0.2054 | 0.1954 | 0.2160 | 0.2238 |
| C | 21.63 | 21.63 | 22.96 | 22.96 | 22.96 |
| C | 14733.2 | 14716.7 | 14716.7 | 14719.4 | 14719.5 |
| C | 13.7 | 14.01 | 14.11 | 14.36 | 14.8 |
| C | 304 | 302 | 286 | 261 | 208 |
| C | 56.20 | 53.73 | 50.35 | 47.79 | 45.33 |
| C | 0.0252 | 0.0277 | 0.0285 | 0.0309 | 0.0258 |
| C | 89.21 | 92.00 | 93.95 | 95.70 | 97.53 |
| C | 0.1845 | 0.1843 | 0.1833 | 0.1852 | 0.1847 |
| C | 0.0990 | 0.0940 | 0.0955 | 0.0957 | 0.0975 |
| C | 96.6 | 97.7 | 99 | 99.2 | 99.7 |
| C | 68.8 | 76.8 | 77.8 | 82.1 | 78.9 |
(4) Standardized data processing The values in Tables 2 and 3 of each classical domain and the matter-element need to be normalized to obtain the following Equations (5) and (6):
| (5) | ||
| (6) |
3.2.2 Weight determination based on entropy method
The entropy weight determination method is a relatively mature method to determine the weight by data objectively. The advantage of the entropy method is to determine the weight reflecting the importance of comparison between different indicators’ values. The entropy weight method is widely used in many fields. Sidhu et al. (2021) combined Multi-objective decisions with the entropy weight method to study machining operations. Vaid et al. (2021) combined VIKOR, WASPAS, and entropy weight method multi-criteria decision-making theory. Zamri et al. (2013) propose a linguistic variable considering positive and negative fuzzy numbers, which is used to solve the unknown interval type-2 of the fuzzy TOPSIS method of interval type-2 entropy weight. The calculation steps are as follows:
(1) Indicator data standardization. The calculation formula is shown in Equation (7):
| (7) |
Where: x is the actual value of the i-th indicator in expressed as 2016 to 2020 year, and is the standardized value of the i-th indicator in year j.
(2) Indicator data normalization. The calculation formula is shown in Equation (8):
| (8) |
Where: r is the proportion of the standardized value of the i-th indicator in year j.
(3) Calculation of information entropy. The calculation formula is shown in Equation (9):
| (9) |
Where H is the information entropy of indicator , . In this article, five years of data are selected for calculation, so .
(4) Calculating indicator weights. The calculation formula is shown in Equation (10):
| (10) |
where is the weight of indicator i, is the information entropy of indicator , .
According to the above data and equations, the following indicator weights are obtained in Table 4:
Table 4 Weight of each indicator
| Indicator | Weight | Indicator | Weight | Indicator | Weight | Indicator | Weight |
| C | 0.060 | C | 0.032 | C | 0.116 | C | 0.039 |
| C | 0.043 | C | 0.056 | C | 0.045 | C | 0.034 |
| C | 0.047 | C | 0.030 | C | 0.086 | C | 0.046 |
| C | 0.049 | C | 0.042 | C | 0.045 | C | 0.037 |
| C | 0.033 | C | 0.068 | C | 0.058 | C | 0.032 |
3.2.3 Determining levels by correlation degree
The correlation degree between the measured matter-element, the classical domain matter-element, and the section domain matter-element can be calculated as following steps.
(1) The distance between the measured matter-element and the classical domain is as Equation (11):
| (11) |
Where a and b are the upper and lower limits, respectively. The characteristic correlation degree of the measured matter element can be obtained as Equation (12).
| (12) |
Where: is the weight of the indicator .
(2) Level determined The j-th level of measured matter-element can be calculated by , as Equations (13) and (14).
| (13) | |
| (14) |
where, represents the eigenvalue of the measured matter-element in the level evaluation, which is used to determine the closeness of the matter-element to be measured to the adjacent level.
By Equations (11) and (12), the closeness of the distance between the object to be evaluated and the evaluation level are calculated. The specific values of the year 2020 are shown in Table 5 as an example. Finally, the ecological environment quality of my country from 2016 to 2020 is shown in Table 6.
Table 5 Distance between matter-elements to be measured and classical field values for 2020
| Indicator | D(v,v) | ||||
| C | 0.092 | 0.049 | 0.014 | 0.015 | 0.124 |
| C | 0.330 | 0.134 | 0.036 | 0.036 | 0.160 |
| C | 0.667 | 0.593 | 0.181 | 0.031 | 0.030 |
| C | 0.846 | 0.784 | 0.109 | 0.020 | 0.020 |
| C | 0.280 | 0.056 | 0.037 | 0.037 | 0.411 |
| C | 0.029 | 0.022 | 0.005 | 0.005 | 0.785 |
| C | 0.030 | 0.030 | 0.165 | 0.279 | 0.390 |
| C | 0.432 | 0.215 | 0.084 | 0.041 | 0.046 |
| C | 0.644 | 0.524 | 0.300 | 0.012 | 0.013 |
| C | 0.426 | 0.169 | 0.034 | 0.034 | 0.041 |
| C | 0.027 | 0.208 | 0.377 | 0.420 | 0.539 |
| C | 0.019 | 0.013 | 0.051 | 0.127 | 0.229 |
| C | 0.020 | 0.018 | 0.178 | 0.292 | 0.417 |
| C | 0.115 | 0.045 | 0.045 | 0.057 | 0.175 |
| C | 0.120 | 0.118 | 0.121 | 0.222 | 0.321 |
| C | 0.025 | 0.038 | 0.073 | 0.115 | 0.143 |
| C | 0.076 | 0.097 | 0.288 | 0.345 | 0.395 |
| C | 0.002 | 0.001 | 0.023 | 0.044 | 0.118 |
| C | 0.003 | 0.045 | 0.062 | 0.090 | 0.113 |
| C | 0.033 | 0.024 | 0.025 | 0.112 | 0.131 |
Table 6 Closeness between evaluation objects and evaluation level
| Level | |||||||
| 2016 | 0.7611 | 0.8387 | 0.8998 | 0.9006 | 0.7984 | Qualified | 3.4976 |
| 2017 | 0.7793 | 0.8499 | 0.8969 | 0.8950 | 0.7861 | Medium | 3.2741 |
| 2018 | 0.7793 | 0.8499 | 0.8969 | 0.8950 | 0.7861 | Medium | 3.1891 |
| 2019 | 0.7962 | 0.8602 | 0.8966 | 0.8867 | 0.7700 | Medium | 2.9281 |
| 2020 | 0.7998 | 0.8632 | 0.8947 | 0.8816 | 0.7656 | Medium | 2.8672 |
From the results, the evaluation level of ecological environment quality in China is qualified in 2016 and medium in 2017, 2018, 2019, 2020. Generally speaking, the evaluation level of ecological environment quality in China has an increasing trend during the thirteenth five years. The level has improved from qualified to medium, and the closeness degree has gradually become smaller, also has indicated that the ecological environment quality is gradually improving.
Due to the indicators of carbon emissions, population density, unit fertilizer use, per capita energy consumption is still in a poor stage of China in 2016–2020, and China’s population, per capita energy consumption is also growing, and the energy consumption is increasing in recent years, energy conservation and emission reduction are imperative. In addition, China has a large population, a large population density, and a small per capita resource share. These reasons are leading to China’s overall ecological environment quality reaching a medium level. However, With the determination of China’s improves the ecological environment quality, China will use more renewable non-fossil energies and reduce carbon emissions with its great effort.
4 Conclusion
This paper constructed a comprehensive evaluation index system of ecological environment quality in China based on the PSR model framework, including the evaluation indicators from three aspects of pressure, state, and response, a total of 20 indicators. The entropy weight method and matter-element extension model are used to calculate the ecological environment quality evaluation results of China from 2016 to 2020 and provide a certain basis for improving and enhancing the ecological environment quality in China. According to the results, the main conclusions of this paper are as follows:
(1) The weight of each indicator is calculated by the entropy weight method, and the weighted correlation degree is calculated by the matter-element extension method. The evaluation of China’s ecological environment quality level is obtained from 2016 to 2020, and the results show that the ecological environment development level in 2016 is qualified, and the ecological environment development level from 2017 to 2020 is medium. The ecological environment quality level in China is showing an improving trend in the last five years.
(2) From the results, population density, carbon emissions, per capita energy consumption, and per capita arable land area are the obstacle factors affecting the development of China’s ecological level. It also means that improving the ecological environment quality level of China should lower the population density, and reduce the carbon emissions by replacing non-fossil energy with fossil energy. China has proposed two stages of carbon emission reduction goals, carbon dioxide emissions will strive to peak in 2030 and strive to achieve carbon neutrality in 2060. In addition, per capita arable land area should enhance to improve the ecological environment quality. Land conversion from natural ecosystems to agriculture has been the biggest cause of gas emission uses historically, so China should consider effective land use and strategies to increase arable land usage in the future.
This paper uses the PSR model to evaluate the ecological environment quality of our country and has achieved certain results. However, there are still the following shortcomings in the research process, which need to be further improved.
(1) This paper uses the PSR model when constructing the comprehensive evaluation index system of ecological environment quality. A total of 20 indicators are selected to analyze and evaluate the ecological environment quality of our country from the three aspects of pressure, state and response. Although the PSR model has been widely used at present, the ecological environment quality has a relationship with everyone in China. Consumer culture and lifestyle of the ecological environment are also important. In the future evaluation of ecological environment quality, the consumer culture and lifestyle of the ecological environment should be combined. So we will improve the accuracy of evaluation results and provide more accurate directions for ecological governance.
(2) The research area selected in this article is China, because ecological and environmental issues have become a research hotspot, and China covers a large area, and the regional characteristics and climatic characteristics of different regions are also different. In the future ecological environment quality evaluation, the research region should be relatively reduced, and the ecological environment quality evaluation should be carried out for a certain characteristic region, to better discover the ecological environment quality change rules in different regions, and provide science for the regional ecological environment management and accurate direction.
Acknowledgements
The authors acknowledge the National Natural Science Foundation of China (Grant: 72071077), The authors acknowledge the Beijing Social Science Foundation under Grant (Grant: 19GLB024), and the Fundamental Research Funds for the Central Universities (Grant: 2020FR001).
References
[1] Boori M S, Choudhary K, Paringer R, et al. Eco-environmental quality assessment based on pressure-state-response framework by remote sensing and GIS[J]. Remote Sensing Applications: Society and Environment, 2021: 100530.
[2] Das N N, Mohanty B P. Temporal dynamics of PSR-based soil moisture across spatial scales in an agricultural landscape during SMEX02: A wavelet approach[J]. Remote Sensing of Environment, 2008, 112(2): 522–534.
[3] Donohue R J, Roderick M L, McVicar T R, et al. Impact of CO2 fertilization on maximum foliage cover across the globe’s warm, arid environments[J]. Geophysical Research Letters, 2013, 40(12): 3031–3035.
[4] Fu B, Jiang Q, Ren C. Assessment and analysis of wet-land ecological fragility in Zhalong[J]. Journal of Arid Land Resources and Environment, 2011, 25(1): 49–52.
[5] He L, Shen J, Zhang Y. Ecological vulnerability assessment for ecological conservation and environmental management[J]. Journal of environmental management, 2018, 206: 1115–1125.
[6] Hu X, Ma C, Huang P, et al. Ecological vulnerability assessment based on AHP-PSR method and analysis of its single parameter sensitivity and spatial autocorrelation for ecological protection—A case of Weifang City, China[J]. Ecological Indicators, 2021, 125: 107464.
[7] Hua W, Chen H, Zhou L, et al. Observational quantification of climatic and human influences on vegetation greening in China[J]. Remote Sensing, 2017, 9(5): 425.
[8] Li H, Li L, Su F, et al. Ecological stability evaluation of tidal flat in coastal estuary: A case study of Liaohe estuary wetland, China[J]. Ecological Indicators, 2021, 130: 108032.
[9] Mao J, Shi X, Thornton P E, et al. Global latitudinal-asymmetric vegetation growth trends and their driving mechanisms: 1982–2009[J]. Remote Sensing, 2013, 5(3): 1484–1497.
[10] Mueller T, Dressler G, Tucker C J, et al. Human land-use practices lead to global long-term increases in photosynthetic capacity[J]. Remote Sensing, 2014, 6(6): 5717–5731.
[11] Ng D K W, Cai W. Treating non-compatibility problem from matter element analysis to extenics[J]. ACM Sigice Bulletin, 1997, 22(3): 2–9.
[12] Probst W N, Rau A, Oesterwind D. A proposal for restructuring Descriptor 3 of the Marine Strategy Framework Directive (MSFD)[J]. Marine Policy, 2016, 74: 128–135.
[13] Qiu W, Zhao Q L, Li S, et al. Ecological security evaluation of Heilongjiang province with pressure-state-response model[J]. Huan jing ke xue= Huanjing kexue, 2008, 29(4): 1148–1152.
[14] Rapport D J, Singh A. An ecohealth-based framework for state of environment reporting[J]. Ecological Indicators, 2006, 6(2): 409–428.
[15] Seyedmohammadi J, Sarmadian F, Jafarzadeh A A, et al. Development of a model using matter element, AHP and GIS techniques to assess the suitability of land for agriculture[J]. Geoderma, 2019, 352: 80–95.
[16] Sidhu A S, Singh S, Kumar R. Bibliometric analysis of entropy weights method for multi-objective optimization in machining operations[J]. Materials Today: Proceedings, 2021.
[17] Song Y, Lu Y, Liu T, et al. Variation of vegetation fractional coverage and its relationship with climate in a desert steppe: optimization of farmland layout in a farming–pastoral ecotone using the ecological suitability index[J]. Ecological Engineering, 2020, 150: 105834.
[18] Sun J, Li Y P, Gao P P, et al. A Mamdani fuzzy inference approach for assessing ecological security in the Pearl River Delta urban agglomeration, China[J]. Ecological Indicators, 2018, 94: 386–396.
[19] Vaid S K, Vaid G, Kaur S, et al. Application of multi-criteria decision-making theory with VIKOR-WASPAS-Entropy methods: A case study of silent Genset[J]. Materials Today: Proceedings, 2021.
[20] Wang C, Zhao H. The assessment of urban ecological environment in watershed scale[J]. Procedia Environmental Sciences, 2016, 36: 169–175.
[21] Wu M, Liu Y, Xu Z, et al. Spatio-temporal dynamics of China’s ecological civilization progress after implementing national conservation strategy[J]. Journal of Cleaner Production, 2021, 285: 124886.
[22] Wu J, Wang X, Zhong B, et al. Ecological environment assessment for Greater Mekong Subregion based on Pressure-State-Response framework by remote sensing[J]. Ecological Indicators, 2020, 117: 106521.
[23] Xu X, Zhang D, Zhang Y, et al. Evaluating the vegetation restoration potential achievement of ecological projects: A case study of Yan’an, China[J]. Land Use Policy, 2020, 90: 104293.
[24] Yi L, Chen J, Jin Z, et al. Impacts of human activities on coastal ecological environment during the rapid urbanization process in Shenzhen, China[J]. Ocean & coastal management, 2018, 154: 121–132.
[25] Zhang D, Jia Q, Xu X, et al. Contribution of ecological policies to vegetation restoration: A case study from Wuqi County in Shaanxi Province, China[J]. Land use policy, 2018, 73: 400–411.
[26] Zhang F, Liu X, Zhang J, et al. Ecological vulnerability assessment based on multi-sources data and SD model in Yinma River Basin, China[J]. Ecological Modelling, 2017, 349: 41–50.
[27] Zamri N, Abdullah L. A new linguistic variable in interval type-2 fuzzy entropy weight of a decision making method[J]. Procedia Computer Science, 2013, 24: 42–53.
Biographies

Ran Wang is a master student in the school of economics and management of North China Electric Power University. Her main research direction is the guidance mechanism and optimization of residents’ intelligent power consumption behavior.

Jianjun Wang is an Associate Professor at the Department of Economics and Management of North China Electric Power University. He got a PhD in Management Science and Engineering at the Department of Economics and Management of North China Electric Power University. His activity mainly focuses on Electricity, Energy, Environment and Economic Simulation and Optimization. He lectures on Information Management and Matlab software.

Yun Teng is a master student in the school of economics and management of North China Electric Power University. His main research directions include logistics system planning and design, logistics system modeling and simulation.
Strategic Planning for Energy and the Environment, Vol. 40_4, 387–406.
doi: 10.13052/spee1048-5236.4044
© 2022 River Publishers