Study on Water Regulation of Yong’an River Basin Based on Ecological Flow Guarantee
Huifang Guo1, Fangfang Yin1,*, Haibo Ma2, Chuanchong Tian2 and Shixia Zhang1
1Zhejiang Tongji Vocational College of Science and Technology, CO 311231, China
2Zhejiang Water Resources and Hydropower Survey and Design Institute, CO 31002, China
E-mail: 61681034@qq.com
*Corresponding Author
Received 24 December 2021; Accepted 08 February 2022; Publication 02 April 2022
Abstract
Water resources are the necessary guarantee to support the development of human society and one of the most important resources to maintain the health and stability of the ecological environment. With the gradual increase of China’s population and the gradual increase of water consumption for industry, life and agriculture, the water consumption for ecological environment can not be met. As a result, some rivers have dried up, biological habitat has been lost and species diversity has been reduced. Therefore, how to ensure the river ecological flow is a very urgent problem to be solved. This paper selects Yong’an River Basin as the research object. Yong’an river is a mountainous river with the characteristics of uneven distribution of natural runoff throughout the year and seasonal water shortage. At present, the ecological flow demand of the river has not been considered in the reservoir operation. In this paper, four different scheduling schemes are set up according to the two constraints of ecological base flow and target ecological flow. Finally, the reservoir group operation scheme with better water supply assurance rate and ecological flow assurance rate is determined.
Keywords: Ecological flow, reservoir group operation, Yong’an River Basin, operation scheme, water resources allocation.
1 Introduction
Water resources is one of the most important resources for the development of human society and the maintenance of healthy and stable ecological environment. In recent years, with the development of economy and society, China’s population is becoming larger and larger. The demand for water resources for human life and social development is increasing, which gradually leads to the inability to guarantee the water use of the ecological environment from time to time, and then affects the stability of the ecosystem. The natural conditions in some river basins are poor, the development and utilization of water resources during human early life and production is unreasonable, and the contradiction between human and ecological environment is becoming increasingly acute due to the impact of drastic global climate change.
With the rapid development of society, human beings have built a large number of water conservancy projects such as dams and reservoirs for economic and social benefits to intercept River and lake runoff and provide convenience for regulating the demand for water for life, industry and agriculture, thus ignoring the guarantee of ecological water use. A series of problems, such as shrinking water area, decreasing river flow, drying up of some rivers, loss of biological habitat and reduction of species diversity, are caused by the inability to guarantee ecological flow and meet the water demand of ecological environment. Therefore, ensuring ecological flow is an important task to maintain the normal development and relative stability of river ecosystem.
Yong’an river is a mountainous river with the characteristics of uneven distribution of natural runoff in a year and seasonal water shortage. Due to the limitation of water resources, the contradiction between water resources utilization and ecological environment water demand is more prominent. However, at present, the reservoir operation of Yong’an river has not considered the needs of the downstream ecological environment. In order to maintain the health and stability of Yongan river ecosystem and realize ecological sustainable development, it is very necessary to carry out the research on watershed water regulation based on ecological flow guarantee in order to improve the ecological water guarantee capacity of the watershed.
2 Research Progress of Ecological Water Regulation
Ecological regulation needs to consider flood control, ecology, profit promotion and other factors [1]. The main types are: river ecological water demand regulation to ensure the basic ecological water use of the river [2], ecological factor regulation with single factors such as flow, velocity and water temperature as regulation factors [3], simulated ecological flood regulation considering the safety of river ecological environment in the process of flood in flood season [4]. Water pollution prevention and control dispatching [5] for alleviating water pollution events leading to excessive water quality in water sources or rivers [6], sediment control dispatching for sediment discharge in downstream rivers [6], water system connectivity dispatching for strengthening water system connectivity [7], etc. Since 1940, the United States has carried out research on the impact of factors such as river flow, velocity, water temperature and nutrients on runoff [8]. In the 1980s, the U.S. federal government believed that the protection of water resources should investigate its ammonia nitrogen, pH value and other indicators, and in this process, the environment required for the survival of organisms in the river should be taken as the key investigation object [9]. In 1973, the United States issued the endangered animals act, which provided a series of management schemes for the environmental problems of dam operation, and conducted an artificial flood peak test, which effectively improved the downstream habitat and restored the endangered species to a certain extent [10]. In 1992, The Australian and New Zealand agriculture and Resources Management Commission (aarkanz) and the environment and Protection Council (anzecc) have issued a law to protect ecological water, which provides support for meeting the needs of living, production and ecological water at the same time, protecting the healthy and stable function and structure of the ecological environment system, and preventing the destruction of biological species diversity [11]. In 1998, Hughes et al. Established a reservoir operation model to coordinate the contradiction between human water use and environmental water demand [12]. In 2008, Hu Heping et al. [13] established a reservoir ecological optimal operation model with the optimization objective of power generation and the constraint of ecological scheme. In 2010, halleraker et al. Used various methods to calculate environmental flow considering different factors such as water temperature and biological habitat demand, and carried out ecological dispatching on this basis [14]. In 2013, gates and others analyzed the impact of the dam on the Snake River on the ecological environment health, and studied the dispatching scheme to maintain the functional stability of the ecological structure [15]. In 2013, Deng Xiaoya [16] put forward the ecological dispatching scheme of “centralized and synchronous combination” of the source stream, “segmented water consumption control” of the main stream and “groundwater level regulation” of the downstream of the main stream. In 2014, Steinschneider et al. Proposed a dispatching model that takes into account the comprehensive requirements of reservoir flood control safety, water supply guarantee, power generation efficiency and ecological environment stability [17].
In 2018, Chen yueyun [18] and others used multi-objective particle swarm optimization algorithm to solve the optimal operation model of reservoirs in Ganjiang River Basin considering river ecological flow. In 2019, Huang Zhihong et al. [19], proposed a method to deal with multi-objective problems by using time division weighting method to solve the reservoir operation model to improve the ecological environment quality of Zhuozhang River region. In 2020, Han Yu et al. [20] proposed an optimization algorithm for reservoir ecological operation based on chaotic cloud genetic algorithm. In 2021, Li Yang [21] used the improved Tennant method, intra year distribution method, q90 method, improved frequency method and ngprp method to calculate the minimum ecological flow that should be discharged from the ocean reservoir, and proposed that the intra year distribution method and improved frequency method are the most suitable calculation methods for the minimum ecological flow in this area. In 2021, gaoxueshan [22] used the Tennant method to calculate the ecological flow, defined the priority guarantee order among the functions of Maodun reservoir according to the water law of the people’s Republic of China (2016) and other laws, and prepared the operation diagram of Maodun reservoir by using the improved comprehensive operation scheme of the reservoir.
3 Overview of Yong’an River Basin
3.1 Physical Geographical Features
Yongan river is the source of Lingjiang Jiaojiang River. The main stream originates from Xitou village, Xigang Township, Xianju County, Taizhou city. It winds to the northeast, runs through the whole Xianju County from southwest to northeast, and then flows into Lingjiang River in Yongfeng Town, Linhai City. The main stream of Yong’an river is between 28.585328.8783 n, 120.3980121.0578 e, with an elevation of 1.00203 m. The natural drop is about 201 m and the average gradient is 1.20%.
Yonganxi basin is located in the eastern basin of Zhejiang Province, between 28.442929.0287 N and 120.1933121.0569 e. the basin is about 84733.89 m long from east to west and 64236.96 m wide from south to north. The terrain is high in the West and low in the East, high in the South and low in the north. The hills are generally not high, but the areal coverage is wide, accounting for about 81% of the whole basin area.
3.2 River Lake System
Yonganxi River, with a total length of 144 km, is formed by the confluence of caodiankeng and Jinxi. Following the terrain, it flows to Lingjiang River from the west, through various towns and street areas. The drainage area is 2704 km. The shape of the watershed is oval, wide in the middle and narrow at both ends. The river system is complex with many tributaries, including about 38 main tributaries, which converge from the main stream to the middle from north to south. Because Yong’an river is located in a hilly area, with large terrain drop, strong water storage capacity and discharge capacity, rapid runoff production and fast runoff velocity after precipitation, the flow reaches the peak in a short time, and the same water withdrawal process is completed in a short time. After long-term scouring by water flow, floodplains often exist on both banks of the river.
3.3 Population Status
Yonganxi River Basin mainly involves Yongjia County, Huangyan District, Pan’an County, Xianju County, Linhai City and Jinyun County. In 2019, the population of Yong’an River Basin will reach 491100, a year-on-year decrease of 0.3%, and the growth rate will drop by about 2 percentage points over the previous year. Among them, the urban population was 269200, with a year-on-year increase of 1.1%, the growth rate decreased by about 1 percentage point over the previous year, and the urban population accounted for 54.8% of the total population of the basin. The rural population was 221900, a year-on-year decrease of 2.0%, the growth rate decreased by about 3 percentage points over the previous year, and the rural population accounted for 45.2% of the total population of the basin.
3.4 Current Situation of Economic Development
In 2019, the regional GDP of Yong’an River Basin will reach 33.921 billion yuan, an increase of 2.481 billion yuan over the previous year, and the proportion of tertiary output value is 0.07:0.43:0.50, of which the added value of primary production will reach 216 million yuan, the added value of secondary production will reach 740 million yuan, and the added value of tertiary production will reach 1.52 billion yuan. The per capita GDP reached 69071 yuan, a year-on-year increase of 8.2%, and the growth rate was about 0.4 percentage points lower than that of the previous year.
3.5 Water Supply Source
There are 4 large and medium-sized reservoirs in Yong’an River Basin, with a total storage capacity of more than 40 million M. The total rainwater collection area is 949.43 km. Accounting for 35.11% of the total area of the basin, the regulation and storage capacity of the basin is relatively strong. At present, Zhengqiao, Gutan bei’ao-xi’ao reservoir and Kuocang reservoir are the main water sources for urban water use in Yong’an River Basin. For general water use such as agricultural irrigation, the Xia’an, Lilin and Kuocang reservoirs are the main water sources, supplemented by river weir dam water intake.
Table 1 Statistics of main water supply sources in Yong’an River Basin
| Reservoir | Catchment | Total | ||
| Name | Type | Category | Area (km) | Reservoir (10000 m) |
| Gutan | Small (1) type | Built | 13.50 | 956.00 |
| Beiao | Small (1) type | Built | 157.10 | 552.00 |
| Xi’ao | Small (1) type | Built | 4.40 | 645.00 |
| Lilin | medium-sized | Built | 92.30 | 1245.00 |
| Zheng Qiao | Small (1) type | Built | 16.88 | 515.00 |
| Disembark | Large (2) type | Built | 257.00 | 13500.00 |
| Kuo Cang | Small (1) type | Built | 9.35 | 946.00 |
| Yuxi | medium-sized | be under construction | 46.00 | 2119.00 |
| Zhu Xi | Large (2) type | be under construction | 168.90 | 12573.00 |
4 Study on Water Regulation of Yong’an River Basin Based on Ecological Flow Guarantee
4.1 Water Resources Allocation Sequence
According to the water law of the people’s Republic of China (revised in 2016) and the demand for ecological, production and domestic water in Yong’an River Basin, in order to give full play to the maximum benefits of water resources in the basin, the following water resources allocation rules considering ecological flow protection are determined according to priority:
(1) Domestic and industrial water shall be the most priority water supply, and its water supply guarantee rate shall be given priority.
(2) When the domestic and industrial water is met, the assurance rate of ecological water and agricultural irrigation water shall be improved without exceeding the dead water level of the reservoir.
(3) There is a competitive relationship between ecological water and agricultural irrigation water.
(4) When the basin is short of water resources, domestic, industrial, ecological and irrigation water will be destroyed.
4.2 Water Supply Dispatching Rules
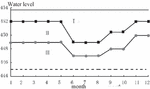
According to the operation principle of each reservoir, this paper determines the operation diagram of the reservoir group in the basin, and uses the operation line to determine the operation water level line of the reservoir to multiple operation intervals. The upper and lower limits of the dispatching interval are determined according to the water resources allocation rules of each water use target, as shown in Figure 1. In the process of scheduling, the scheduling shall be carried out according to the scheduling rules in Table 2:
(1) When the water level is in zone I, life, industry, ecology and agriculture are regulated normally;
(2) When the water level is in zone II, life, industry and ecology are regulated normally, and agricultural regulation is limited. Referring to the research results of Peng Hui [23] and Mei Chao [24, the limiting coefficient C1 is 0.8;
(3) When the water level is in Zone III, domestic water, industrial water, ecological environment water and irrigation dispatching are limited. Refer to the research results of Peng Hui [23], Mei Chao [24] and the requirements of “when the water supply of urban and rural water supply projects is insufficient, the damage depth shall not be greater than 30%” in the code for hydraulic calculation of Hydraulic Engineering (sl104-2015), and the restriction coefficients A1, B1 C2 values are 0.7, 0.6 and 0.5 respectively.
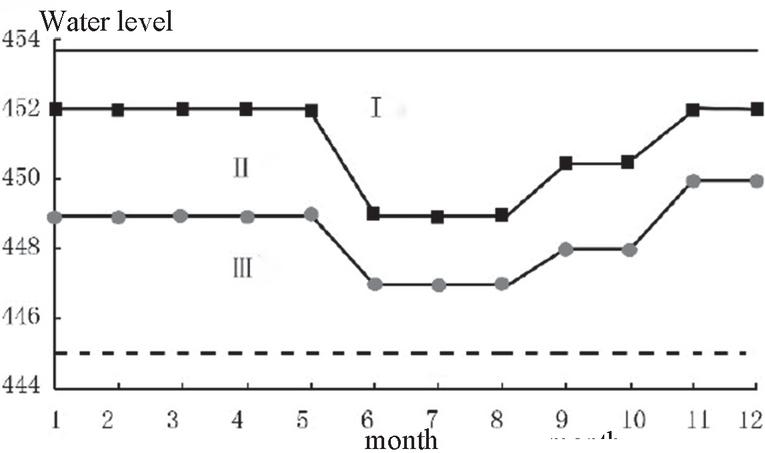
Figure 1 Schematic diagram of water supply dispatching rules.
Table 2 Water supply dispatching rules
| Water Supply Dispatching | |||
| Dispatching Area | Life and Industry | Ecology | Agriculture |
| Zone I | normal | normal | normal |
| Zone II | normal | normal | Limit C1 |
| Zone III | Limit A1 | Limit B1 | Limit C2 |
4.3 Construction of Multi-objective Scheduling Function
(1) Objective function
For reservoir group operation based on ecological flow guarantee, when setting the objective function, the assurance rate of domestic and industrial water supply, ecological water supply and agricultural water supply is taken as the objective function, and the minimum ecological water shortage is also considered. Considering that the water shortage is not only reflected in the total amount, but also in the period distribution, the water supply guarantee rate is added to the solution of multi-objective dispatching as a penalty. The specific expression of the objective function is as follows.
The assurance rate of domestic and industrial water supply is the largest.
| (1) |
The water shortage rate of ecological flow is the smallest.
| (2) |
(3) Agricultural irrigation water supply rate is the largest.
Next, we judge whether domestic and industrial water, ecological water and agricultural water meet the guarantee rate requirements. If they do not meet the guarantee rate conditions, the following formula is used to punish the objective function.
| (3) |
In the above formulas, N is the total years of long series dispatching; Qind,i,t and Pe,int,i,t are the assurance rate requirements for domestic and industrial water supply of reservoir i in period t;Qagr,i,t and Pe,agr,i,t are the requirements for agricultural water supply assurance rate of reservoir i in period t; Qeco,i,t and Pe,eco,i,t are the requirements for ecological water supply assurance rate of reservoir i in period t; Punish() is the penalty function given when the water supply target does not meet the guarantee rate; i and i is the penalty coefficient respectively.
(2) Constraints
(1) Total water supply restriction of the system:
| (4) |
(2) Constraints on the available water supply of a single reservoir:
| (5) |
Reservoir water balance constraints:
| (6) |
(3) Reservoir capacity constraints:
| (7) |
(4) Non negative constraint of reservoir water supply:
| (8) |
Where is the available water supply of reservoir group system in t period; is the available water supply of i reservoir in t period; is the water demand of j user t period; and are the storage capacity of i reservoir at the end of t period and at the beginning of t period; and are respectively the inflow, outflow and loss of water in t period of i reservoir; and are the minimum and maximum allowable storage capacity of i reservoir t period respectively.
4.4 Solution of Joint Scheduling Model
There are many methods to solve the multi-objective problem. In this paper, the multi-objective particle swarm optimization algorithm is introduced to solve the reservoir group operation problem based on ecological flow. Multi objective particle swarm optimization algorithm is a group search algorithm. Their modeling and simulation algorithm mainly uses the model of biologist Frank Heppner. PSO algorithm adopts the speed position search model. Each particle represents a candidate solution in the solution space. When searching the space, the particle flies at a certain speed, and the flight speed is dynamically adjusted according to the flight experience. Based on the solution idea of multi-objective evolutionary algorithm, Pareto dominance relation technology is applied to multi-objective particle swarm optimization algorithm, and the non inferior solution set evenly distributed in Pareto front can be obtained. The solution steps are as follows:
(1) According to the input data, determine the population size and cycle times, as well as the external set and cross variation probability.
(2) According to the constraints, select the data range of particle swarm optimization and set the initial value.
(3) The Pareto dominance relation is introduced to include some initial particles in the external set.
(4) Calculates the individual value of the initialization particle.
(5) A particle is randomly selected from the external set as the global optimal solution, and the individual optimal solution is selected from the initialized population according to the Pareto dominance relationship.
(6) Set inertia weight and particle position coefficient to update particle position.
(7) According to the dominant idea of constraints, the individual values are sorted, and the optimal particles are selected into the external set
(8) Some particles of the external set are mutated with the current particles according to the set poor mutation probability.
(9) Judge whether the maximum number of iterations is reached. If not, turn to step (6); if so, output the particle of the external set, which is the non inferior solution of the objective function.
Table 3 Scheme setting
| Scheme No | Scheduling Principle | Baizhi’ao Ecological Flow Setting |
| A1 | The reservoir shall be operated | Ecological base flow |
| A2 | according to the current operation principles | Target ecological flow |
| A3 | According to the constructed reservoir | Ecological base flow |
| A4 | group joint operation model | Target ecological flow |
4.5 Scheme Setting
Four schemes are set this time. One is comparison scheme A1, which does not consider the joint operation of reservoir groups. The reservoir is implemented according to the current operation principle, and the ecological flow of baizhi’ao section adopts ecological base flow. Second, compare scheme A2, which does not consider the joint operation of reservoir groups, the reservoir is implemented according to the current operation principle, and the ecological flow of baizhi’ao section adopts the target ecological flow. The third is optimization scheme A3, which is implemented according to the constructed reservoir group joint operation model, and the ecological flow of baizhi’ao section adopts ecological base flow. The fourth is the optimization scheme A4, which is implemented according to the constructed reservoir group joint operation model, and the ecological flow of baizhi’ao section adopts the target ecological flow.
4.6 Data Input
(1) 1961–2018 daily inflow runoff process.
(2) Basic parameters of each reservoir, including total storage capacity, normal storage capacity, flood limited storage capacity, dead storage capacity, etc.
(3) Level and guarantee rate of each water user. Domestic and industrial water is the first level, with a guarantee rate of 95%; ecological water is the second level, with a guarantee rate of 90%; agricultural irrigation is the third level, with a guarantee rate of 90%.
(4) Water demand of each water user. According to the water demand forecast, the comprehensive domestic water demand in 2025 will be 29.9359 million M, The industrial water demand is 22169900 M. The ecological base flow of baizhiao section is 2.88 M/s. The target ecological flow from April to September is 20.20 m/s. The target ecological flow from October to march of the next year is 7.30 m/s. The water demand for agricultural irrigation in normal water year is 81.2182 million?
(5) Main reservoir operation diagram: the first is the Xiaan reservoir. According to the 2021 control and operation plan of Xiaan reservoir in Xianju County, the upper limit water level of profit making in Mei flood season is 206.96 m, the upper limit water level of profit making in Taiwan flood season is 203.96 m, and the upper limit water level of profit making in non flood season is 207.96 m; considering that Xiaan reservoir is used as the lower reservoir of pumped storage power station, according to According to the agreement on the transfer of the right to use part of the capacity of Xianju lower bank reservoir, the lower limit water level of Xingli is 183.36 m. Second, Yuxi reservoir. According to the preliminary review opinions on reporting the 2021 trial operation control plan of Yuxi reservoir in Xianju County, the flood control limit water level in Taiwan flood season is 162.00 m, that in plum flood season is 164.00 m, and that in non flood season is 164.00 m. The lower limit water level of Xingli is 117.50m. The third is Zhuxi reservoir. According to the report on water resources demonstration of Zhuxi reservoir project in Taizhou City, Zhejiang Province and relevant calculations, the flood control limit water level in Taiwan flood season is 145.00 m, the flood control limit water level in Mei flood season is 148.00 m, and the upper limit water level for profit in non flood season is 148.00 m. The lower limit water level of Xingli is 104.00 m.
4.7 The Water Demand Satisfaction of Water Users in Each Scheme is Output Year by Year
According to the water demand satisfaction of each water user in a long series output in the model, the following formula is used to calculate the water guarantee rate.
| (9) |
Where, is Water assurance rate; y: Number of years in which water is used; y is Total number of long series years.
(1) Table 4 shows the annual output results of the satisfaction degree of each water user in scheme A1. The results show that the domestic and industrial water demand meets the requirements of the guarantee rate, with the guarantee rate of 98.3%; the agricultural water demand meets the requirements of the guarantee rate, with the guarantee rate of 91.4%; the ecological water demand basically meets the requirements of the guarantee rate, with the guarantee rate of 89.7%.
Table 4 Annual output results of water demand satisfaction of scheme A1
| Year | Whether Domestic and Industrial Water Demand is Met | Whether the Agricultural Water Demand is Met | Whether the Ecological Water is Satisfied | Year | Whether Domestic and Industrial Water Demand is Met | Whether the Agricultural Water Demand is Met | Whether the Ecological Water is Satisfied |
| 1961 | yes | yes | yes | 1990 | yes | yes | yes |
| 1962 | yes | yes | yes | 1991 | yes | yes | no |
| 1963 | yes | yes | yes | 1992 | yes | yes | yes |
| 1964 | yes | yes | yes | 1993 | yes | yes | yes |
| 1965 | yes | yes | yes | 1994 | yes | yes | yes |
| 1966 | yes | yes | yes | 1995 | yes | yes | yes |
| 1967 | yes | yes | yes | 1996 | yes | yes | yes |
| 1968 | yes | yes | yes | 1997 | yes | yes | yes |
| 1969 | yes | yes | yes | 1998 | yes | yes | yes |
| 1970 | yes | yes | yes | 1999 | yes | yes | yes |
| 1971 | yes | no | no | 2000 | yes | yes | yes |
| 1972 | yes | yes | yes | 2001 | yes | yes | yes |
| 1973 | yes | yes | yes | 2002 | yes | yes | yes |
| 1974 | yes | yes | yes | 2003 | yes | no | no |
| 1975 | yes | yes | yes | 2004 | yes | yes | yes |
| 1976 | yes | yes | yes | 2005 | yes | yes | yes |
| 1977 | yes | yes | yes | 2006 | yes | yes | yes |
| 1978 | yes | no | no | 2007 | yes | yes | yes |
| 1979 | no | no | no | 2008 | yes | yes | yes |
| 1980 | yes | yes | yes | 2009 | yes | yes | yes |
| 1981 | yes | yes | yes | 2010 | yes | yes | yes |
| 1982 | yes | yes | yes | 2011 | yes | no | no |
| 1983 | yes | yes | yes | 2012 | yes | yes | yes |
| 1984 | yes | yes | yes | 2013 | yes | yes | yes |
| 1985 | yes | yes | yes | 2014 | yes | yes | yes |
| 1986 | yes | yes | yes | 2015 | yes | yes | yes |
| 1987 | yes | yes | yes | 2016 | yes | yes | yes |
| 1988 | yes | yes | yes | 2017 | yes | yes | yes |
| 1989 | yes | yes | yes | 2018 | yes | yes | yes |
(2) Table 5 shows the annual output results of the satisfaction degree of each water user in scheme A2. The results show that the domestic and industrial water demand meets the requirements of the guarantee rate, with the guarantee rate of 98.3%; the agricultural water demand meets the requirements of the guarantee rate, with the guarantee rate of 91.4%; the ecological water demand does not meet the requirements of the guarantee rate, with the guarantee rate of 69.0%.
Table 5 Annual output results of water demand satisfaction of scheme A2
| Year | Whether Domestic and Industrial Water Demand is Met | Whether the Agricultural Water Demand is Met | Whether the Ecological Water is Satisfied | Year | Whether Domestic and Industrial Water Demand is Met | Whether the Agricultural Water Demand is Met | Whether the Ecological Water is Satisfied |
| 1961 | yes | yes | yes | 1990 | yes | yes | yes |
| 1962 | yes | yes | yes | 1991 | yes | yes | no |
| 1963 | yes | yes | no | 1992 | yes | yes | yes |
| 1964 | yes | yes | no | 1993 | yes | yes | no |
| 1965 | yes | yes | yes | 1994 | yes | yes | yes |
| 1966 | yes | yes | no | 1995 | yes | yes | yes |
| 1967 | yes | yes | no | 1996 | yes | yes | no |
| 1968 | yes | yes | no | 1997 | yes | yes | yes |
| 1969 | yes | yes | yes | 1998 | yes | yes | yes |
| 1970 | yes | yes | yes | 1999 | yes | yes | yes |
| 1971 | yes | no | no | 2000 | yes | yes | yes |
| 1972 | yes | yes | yes | 2001 | yes | yes | yes |
| 1973 | yes | yes | yes | 2002 | yes | yes | yes |
| 1974 | yes | yes | yes | 2003 | yes | no | no |
| 1975 | yes | yes | yes | 2004 | yes | yes | no |
| 1976 | yes | yes | yes | 2005 | yes | yes | yes |
| 1977 | yes | yes | yes | 2006 | yes | yes | yes |
| 1978 | yes | no | no | 2007 | yes | yes | yes |
| 1979 | no | no | no | 2008 | yes | yes | no |
| 1980 | yes | yes | yes | 2009 | yes | yes | no |
| 1981 | yes | yes | yes | 2010 | yes | yes | yes |
| 1982 | yes | yes | yes | 2011 | yes | no | no |
| 1983 | yes | yes | yes | 2012 | yes | yes | yes |
| 1984 | yes | yes | yes | 2013 | yes | yes | no |
| 1985 | yes | yes | yes | 2014 | yes | yes | yes |
| 1986 | yes | yes | no | 2015 | yes | yes | yes |
| 1987 | yes | yes | yes | 2016 | yes | yes | yes |
| 1988 | yes | yes | yes | 2017 | yes | yes | yes |
| 1989 | yes | yes | yes | 2018 | yes | yes | yes |
(3) Table 6 shows the annual output results of the satisfaction degree of each water user in scheme A3. The results show that the domestic and industrial water demand meets the guarantee rate requirements, and the guarantee rate is 96.6%. Agricultural water demand basically meets the requirements of guarantee rate, which is 89.7%. The ecological water demand meets the guarantee rate requirements, and the guarantee rate is 93.1%.
Table 6 Annual output results of water demand satisfaction of scheme A3
| Year | Whether Domestic and Industrial Water Demand is Met | Whether the Agricultural Water Demand is Met | Whether the Ecological Water is Satisfied | Year | Whether Domestic and Industrial Water Demand is Met | Whether the Agricultural Water Demand is Met | Whether the Ecological Water is Satisfied |
| 1961 | yes | yes | yes | 1990 | yes | yes | yes |
| 1962 | yes | yes | yes | 1991 | yes | no | yes |
| 1963 | yes | yes | yes | 1992 | yes | yes | yes |
| 1964 | yes | yes | yes | 1993 | yes | yes | yes |
| 1965 | yes | yes | yes | 1994 | yes | yes | yes |
| 1966 | yes | yes | yes | 1995 | yes | yes | yes |
| 1967 | yes | yes | yes | 1996 | yes | yes | yes |
| 1968 | yes | yes | yes | 1997 | yes | yes | yes |
| 1969 | yes | yes | yes | 1998 | yes | yes | yes |
| 1970 | yes | yes | yes | 1999 | yes | yes | yes |
| 1971 | yes | no | no | 2000 | yes | yes | yes |
| 1972 | yes | yes | yes | 2001 | yes | yes | yes |
| 1973 | yes | yes | yes | 2002 | yes | yes | yes |
| 1974 | yes | yes | yes | 2003 | no | no | no |
| 1975 | yes | yes | yes | 2004 | yes | yes | yes |
| 1976 | yes | yes | yes | 2005 | yes | yes | yes |
| 1977 | yes | yes | yes | 2006 | yes | yes | yes |
| 1978 | yes | no | no | 2007 | yes | yes | yes |
| 1979 | no | no | no | 2008 | yes | yes | yes |
| 1980 | yes | yes | yes | 2009 | yes | yes | yes |
| 1981 | yes | yes | yes | 2010 | yes | yes | yes |
| 1982 | yes | yes | yes | 2011 | yes | no | yes |
| 1983 | yes | yes | yes | 2012 | yes | yes | yes |
| 1984 | yes | yes | yes | 2013 | yes | yes | yes |
| 1985 | yes | yes | yes | 2014 | yes | yes | yes |
| 1986 | yes | yes | yes | 2015 | yes | yes | yes |
| 1987 | yes | yes | yes | 2016 | yes | yes | yes |
| 1988 | yes | yes | yes | 2017 | yes | yes | yes |
| 1989 | yes | yes | yes | 2018 | yes | yes | yes |
(4) Table 7 shows the output results of the satisfaction degree of each water user in scheme A4 year by year. The results show that the domestic and industrial water demand meets the requirements of the guarantee rate, with the guarantee rate of 96.6%; the agricultural water demand does not meet the requirements of the guarantee rate, with the guarantee rate of 82.8%; the ecological water demand does not meet the requirements of the guarantee rate, with the guarantee rate of 86.2%.
Table 7 Annual output results of water demand satisfaction of scheme A4
| Year | Whether Domestic and Industrial Water Demand is Met | Whether the Agricultural Water Demand is Met | Whether the Ecological Water is Satisfied | Year | Whether Domestic and Industrial Water Demand is Met | Whether the Agricultural Water Demand is Met | Whether the Ecological Water is Satisfied |
| 1961 | yes | yes | yes | 1990 | yes | yes | yes |
| 1962 | yes | yes | yes | 1991 | yes | no | yes |
| 1963 | yes | yes | yes | 1992 | yes | yes | yes |
| 1964 | yes | yes | yes | 1993 | yes | yes | yes |
| 1965 | yes | yes | yes | 1994 | yes | yes | yes |
| 1966 | yes | yes | yes | 1995 | yes | yes | yes |
| 1967 | yes | yes | yes | 1996 | yes | yes | yes |
| 1968 | yes | yes | yes | 1997 | yes | yes | yes |
| 1969 | yes | yes | yes | 1998 | yes | yes | yes |
| 1970 | yes | yes | yes | 1999 | yes | yes | yes |
| 1971 | yes | no | no | 2000 | yes | yes | yes |
| 1972 | yes | yes | yes | 2001 | yes | yes | yes |
| 1973 | yes | yes | yes | 2002 | yes | yes | yes |
| 1974 | yes | yes | yes | 2003 | no | no | no |
| 1975 | yes | yes | yes | 2004 | yes | yes | yes |
| 1976 | yes | yes | yes | 2005 | yes | yes | yes |
| 1977 | yes | yes | yes | 2006 | yes | yes | yes |
| 1978 | yes | no | no | 2007 | yes | yes | yes |
| 1979 | no | no | no | 2008 | yes | yes | yes |
| 1980 | yes | yes | yes | 2009 | yes | yes | yes |
| 1981 | yes | yes | yes | 2010 | yes | yes | yes |
| 1982 | yes | yes | yes | 2011 | yes | no | yes |
| 1983 | yes | yes | yes | 2012 | yes | yes | yes |
| 1984 | yes | yes | yes | 2013 | yes | yes | yes |
| 1985 | yes | yes | yes | 2014 | yes | yes | yes |
| 1986 | yes | yes | yes | 2015 | yes | yes | yes |
| 1987 | yes | yes | yes | 2016 | yes | yes | yes |
| 1988 | yes | yes | yes | 2017 | yes | yes | yes |
| 1989 | yes | yes | yes | 2018 | yes | yes | yes |
4.8 Comparison of Water Demand Satisfaction of Water Users in Each Scheme
(1) Comparing scheme A1 and scheme A2, the reservoir is implemented according to the current operation principle. The domestic and industrial water demand and agricultural irrigation water demand under the two schemes meet the guarantee rate requirements. Since most reservoirs did not particularly consider the demand of downstream river ecosystem in the previous operation process, the guarantee rate of ecological water under scheme A2 decreased with the increase of ecological flow of baizhi’ao section.
(2) Comparing scheme A3 and scheme A4, the reservoir is implemented according to the constructed reservoir group joint operation model. The domestic and industrial water demand under the two schemes meet the guarantee rate requirements, but with the increase of ecological flow at baizhi’ao section, the guarantee rates of ecological water and agricultural irrigation water demand under scheme A4 decrease.
(3) Comparing scheme A1 and scheme A3, scheme A1 reservoir is implemented according to the current operation principle, and scheme A3 reservoir is implemented according to the constructed reservoir group joint operation model. The guarantee rates of three water users under the two schemes basically meet the requirements. Compared with scheme A1, the assurance rate of ecological water in scheme A3 is slightly increased, and the assurance rate of agricultural irrigation water demand is slightly decreased. Because the ecological base flow of baizhi’ao section is small, the constructed reservoir group joint operation model does not show obvious optimization effect compared with the current operation principle.
(4) Comparing scheme A2 and scheme A4, scheme A2 reservoir is implemented according to the current operation principle, and scheme A4 reservoir is implemented according to the constructed reservoir group joint operation model. The assurance rates of domestic and industrial water demand under the two schemes meet the requirements. Compared with scheme A2, the assurance rate of ecological water in scheme A4 has been greatly improved, from 69.0% to 86.2%, and the assurance rate of agricultural irrigation water demand has decreased slightly, from 91.4% to 82.8%. Because the target ecological flow of baizhi’ao section is large and the guarantee rate under the current operation scheme is low, the constructed reservoir group joint operation model shows obvious optimization effect compared with the current operation principle.
5 Conclusion
Based on the current reservoir operation rules in Yong’an River Basin and combined with the actual demand of the basin, a multi-objective operation function considering ecological flow guarantee is established in this paper. By optimizing the regulation rules of main reservoirs, four groups of comparison schemes are set to carry out the research on basin water regulation based on ecological flow guarantee. The main conclusions are as follows:
When the ecological flow of baizhi’ao is determined as ecological base flow, because the set ecological flow is relatively small, the constructed reservoir group joint operation model does not show obvious optimization effect compared with the current operation principle. Under the current dispatching, the domestic and industrial water demand meets the guarantee rate requirements, and the guarantee rate is 98.3%. Agricultural water demand meets the guarantee rate requirements, and the guarantee rate is 91.4%. The ecological water demand basically meets the requirements of the guarantee rate, which is 89.7%. Under the condition of joint operation of reservoir groups, the domestic and industrial water demand meets the guarantee rate requirements, and the guarantee rate is 96.6%. Agricultural water demand basically meets the requirements of guarantee rate, which is 89.7%. The ecological water demand meets the guarantee rate requirements, and the guarantee rate is 93.1%. Compared with the current operation scheme, under the joint operation of the reservoir group, the guarantee rate of ecological water consumption has increased slightly, from 89.7% to 93.1%, and the guarantee rate of agricultural irrigation water demand has decreased slightly, from 91.4% to 89.7%.
When the ecological flow of baizhi’ao is set as the target ecological flow, because the set ecological flow is relatively large, the constructed reservoir group joint operation model shows obvious optimization effect than the current operation principle. Under the current dispatching, the domestic and industrial water demand meets the guarantee rate requirements, and the guarantee rate is 98.3%. Agricultural water demand meets the guarantee rate requirements, and the guarantee rate is 91.4%. The ecological water demand did not meet the guarantee rate requirements, and the guarantee rate was 69.0%. Under the condition of joint operation of reservoir groups, the domestic and industrial water demand meets the guarantee rate requirements, and the guarantee rate is 96.6%. Agricultural water demand did not meet the guarantee rate requirements, and the guarantee rate was 82.8%. The ecological water demand did not meet the guarantee rate requirements, and the guarantee rate was 86.2%. Compared with the current operation scheme, under the joint operation of reservoir groups, the assurance rate of ecological water use has been greatly improved, from 69.0% to 86.2%, and the assurance rate of agricultural irrigation water demand has decreased, from 91.4% to 82.8%.
Acknowledgments
This work was supported by Provincial cultivation project of Zhejiang Tongji Vocational College of science and Technology (FRF21PY001) & Science and technology project of Zhejiang Water Resources Department in 2020 (No. RC2031) & Natural Science Foundation of Zhejiang Province (LZJWY22E090005) & Science and technology planning project of Zhejiang Provincial Department of water resources (Research on ecological flow accounting method and supervision of small and medium-sized rivers in Zhejiang Province (RA2008)).
References
[1] Yu Xuezhong, Yang Zhifeng, Liao Wengen Preliminary study on ecological and environmental regulation of water conservancy projects [J] Water conservancy and hydropower technology, 2005 (11): 20–22
[2] Wu he Study on ecological water use regulation scheme of Taizi River [J] Water conservancy planning and design, 2020 (12): 65–68 107
[3] Zhu Xiang Study on total phosphorus pollution control of Hongze Lake based on ecological factor scheduling [J] Reform and opening up, 2017 (21): 100–102
[4] Liu Yang, Cao Shengle, Xue Shuwen Ecological regulation of medium and small flood in river based on flood diversion facilities [J] People’s Yellow River, 2017, 39 (06): 47–51
[5] Luo Yun Analysis on emergency dispatching management of sudden water pollution events in shuidongpo reservoir in Boluo County [J] Heilongjiang water conservancy science and technology, 2020, 48 (11): 190–192
[6] Lu Jinyou, Zhao jinqiong Key technologies for sediment regulation of cascade hubs in the Yangtze River Basin [J] Journal of Changjiang Academy of Sciences, 2021, 38 (01): 1–7 26
[7] Guo Yaping Study on Evaluation of water system connectivity in Sihe River Basin [D] Shandong Agricultural University, 2016
[8] James V. Ward. The Ecology of Regulated Streams [J]. two thousand and thirteen
[9] Xu Yang, Chang Fuxuan, Chen Jin, etc Summary of reservoir ecological operation research [J] Journal of Changjiang Academy of Sciences, 2008, 25 (06): 33–37
[10] Lovich J, Melis T S. The state of the Colorado River ecosystem in Grand Canyon: Lessons from 10 years of adaptive ecosystem management [J]. International Journal of River Basin Management, 2007, 5(3): 207–221
[11] Armcanz, Anzecc. National principles for the provision of water for ecosystems. Sustainable Land and Water Resources Management Committee [J]. Sub-committee on Water Resources, 1996
[12] Hughes D A, Ziervogel G. The inclusion of operating rules in a daily reservoir simulation model to determine ecological reserve releases for river maintenance [J]. Water S A, 1998, 24(4): 293–302
[13] Hu Heping, Liu Dengfeng, Tian Fuqiang, Ni guangheng Study on reservoir ecological operation method based on ecological flow hydrograph [J] Progress in water science, 2008 (03): 325–332
[14] Halleraker J H, Sundt H, Alfredsen K T, et al. Application of multiscale environmental flow methodologies as tools for optimized management of a Norwegian regulated national salmon watercourse [J]. River Research & Applications, 2010, 23(5)
[15] K, K, Gates, et al. Habitat USE of an Endemic Mollusca Assemblage in a Hydrologically Altered Reach of The Snake River, IDAHO, USA [J]. River Research and Applications, 2013
[16] Deng Xiaoya, Yang Zhifeng, long Aihua Study on ecological regulation of Tarim River Basin Based on rational allocation of water resources [J] Glacial permafrost, 2013, 35 (06): 1600–1609
[17] Scott, Steinschneider, Alec, et al. Reservoir Management Optimization for Basin-Wide Ecological Restoration in the Connecticut River [J]. Journal of Water Resources Planning and Management, 2014, 140(9)
[18] Chen yueyun, Mei Yadong, Cai Hao, Xu Xinfa Study on optimal operation of reservoirs in Ganjiang River Basin for power generation, water supply and ecological requirements [J] Journal of water conservancy, 2018,49 (05): 628–638 DOI:10.13243/j.cnki.slxb. twenty million one hundred and eighty thousand one hundred and thirty
[19] Huang Zhihong, Dong zengchuan, Zhou Tao, Lin mengran, Chen Xinxin, Gao Xiaoqi Study on multi-objective ecological operation model of reservoirs in Zhuozhang River Basin [J] Hydropower and energy science, 2019, 37 (03): 58–62
[20] Han Yu Research on reservoir ecological operation optimization method based on chaotic cloud genetic algorithm [D] Harbin Engineering University, 2020 DOI:10.27060/d.cnki.ghbcu.2020.000096
[21] Li Yang, Lin Jin Calculation of minimum ecological flow in dewatering section of small hydropower station – taking Panxi cascade hydropower station as an example [J/OL] South to North Water Transfer and water conservancy technology (Chinese and English): 1–11 [2022-01-25] http://kns.cnki.net/kcms/detail/13.1430.TV.20210909.1057.002.html
[22] Gao Xueshan, Liu Shufeng, Guan Shuai, Chen Jichen, Feng Ping Preparation and application of reservoir comprehensive operation scheme based on ecological flow guarantee [J] Journal of Changjiang Academy of Sciences, 2021, 38 (04): 19–24
[23] Peng Hui, Liu Tu, Yang Xun, Xu Wei Study on joint operation of small watershed Reservoirs Considering ecological flow [J] People’s Yangtze River, 2019, 50 (05): 196–199 216
[24] Mei Chao, Yin mingwan, Li Meng Optimal operation of Qianzhong reservoir group considering different ecological flow constraints [J] China rural water resources and hydropower, 2017 (05): 174–180
Biographies

Huifang Guo Obtained the doctor’s degree in hydrology and water resources from Hehai University in 2010 and the master’s degree in hydrology and water resources from Zhengzhou University in 2007. She is now engaged in teaching and scientific research in Zhejiang Tongji Vocational College of science and technology. Her main research interests are water resources system analysis, water ecological environment analysis, flood control and disaster reduction research, etc.

Fangfang YIN Obtained the master’s degree in environmental engineering from Beijing University of technology in 2009. Now she is engaged in teaching and scientific research in Zhejiang Tongji Vocational College of science and technology. He is now mainly engaged in sewage treatment and rural water environment treatment.

Haibo Ma Obtained the master’s degree in hydrology and water resources from Hehai University in 2006. Now, he is engage in water conservancy planning and design in Zhejiang Design Institute of Water Conservation & Hydro Electric Power Co., Ltd. His main research fields include water resources, water ecological environment, flood control and drainage in the Eastern coastal areas of Zhejiang Province Hydraulic engineering design, etc.

Chuanchong Tian Obtained the master’s degree in hydrology and water resources from Hehai University in 2013. Now, he is engage in water conservancy planning and design in Zhejiang Design Institute of Water Conservation & Hydro Electric Power Co., Ltd. His main research field is water ecological environment.

Shixia Zhang Received the doctorate from Zhejiang University in 2008. She is currently engaged in teaching and scientific research in Zhejiang Tongji Vocational College of science and technology. Main research interests: municipal engineering design and management, water supply and drainage engineering technology, project cost preparation and review, watershed hydrological ecology and disaster prevention technology research, etc.
Strategic Planning for Energy and the Environment, Vol. 41_2, 171–194.
doi: 10.13052/spee1048-5236.4123
© 2022 River Publishers