Changing Climatic Conditions Affect Snow Cover in Annapurna Region of Nepal
Susmita Shrestha1, Durga D. Poudel1,*, Timothy W. Duex2 and Rodney B. Yantis3
1Environmental Science Program, School of Geosciences, University of Louisiana at Lafayette, Lafayette, Louisiana, USA
2Geology, School of Geosciences, University of Louisiana at Lafayette, Lafayette, Louisiana, USA
3NASA/UL Lafayette Regional Application Center, University of Louisiana at Lafayette, Lafayette, LA, USA
E-mail: durga.poudel@louisiana.edu
*Corresponding Author
Received 18 February 2022; Accepted 01 March 2022; Publication 02 April 2022
Abstract
Changing climatic conditions affecting the physical environment, hydrology, forest and wildlife, agriculture, and other sectors of the economy has become a major concern worldwide. The Annapurna Range in the Central Himalayas in Nepal is experiencing impacts of climate change on various fronts, including temperature increase and change in snow cover area (SCA). The objectives of this study were to assess spatio-temporal variation in temperature, precipitation, and SCA in the Annapurna massif and establish a relationship between these variables. This study analyzed the daily maximum and minimum temperature and precipitation records of six weather stations in the region, and performed a long-term analysis (1990–2020) of snow cover over Annapurna massif analysing Satellite images from the past three decades provided by satellite 5 through 8 of the Landsat program and Geographic Information System (GIS) technology. The SCA was determined through Landsat images using the Normalized Difference Snow Index (NDSI). Temperature analysis showed that the northeast (Chame) and northwest (Jomsom) parts of the massif were undergoing a consistent increase in average temperature at the rate of 0.07 and 0.03C per year, respectively. A north-south gradient was observed in total annual precipitation with total precipitation increasing in Ghandruk and Ranipauwa (Muktinath) at 50 mm and 4.8 mm per year, respectively, and decreasing in Manang Bhot at 4.7 mm per year. The precipitation events increased during spring in the west (Lete), northwest (Jomsom), and south (Ghandruk) of the massif, whereas it decreased in the north (Manang Bhot) and northeast (Chame) for all seasons. The SCA varied from 397 km to 1735 km with a significantly decreasing trend in December. There was a non-significant SCA increase during March, indicating that more snow coverage could appear in the spring in the future. These results could help local communities, government agencies, tourism industries, and other stakeholders develop resource management plans and climate change adaptation strategies.
Keywords: Climate change, snow cover, Annapurna Region, GIS.
Introduction
One of the biggest concerns today is global climate change and its effect on the ecosystem and humanity (Shrestha et al., 2019). Evidence from the National Oceanic and Atmospheric Administration (NOAA) shows that the global temperature is rising at a rate of about 0.18C per decade since 1981 (NOAA, 2020). Climate change impacts could affect the livelihoods of the people in the poorer countries more seriously as they lack the resources to cope with the climate change consequences (Shrestha and Aryal, 2011; Pandey and Bardsley, 2015). According to IPCC 2014, there could be an increase in mean annual temperature of 2 to 6C over the high altitude of Asia by the late 21st century (Hijioka et al., 2014). This increase in temperature could highly alter the snow and glaciers of the Himalayan region of Asia.
Nepal lies in the middle of the great Himalayan curve, with high mountains stretching from west to east across the northern portion of the country. Snow melts and glaciers are major sources of surface water (Shrestha and Aryal, 2011). Studies show that between 1977 to 1994, the country was warming at the rate of 0.06C per year with even higher warming rates at high altitudes; this warming is causing the retreat of the snowline and the rapid shrinking of a majority of the glaciers in Nepal (Shrestha et al., 1999; Shrestha and Joshi, 2009). Since most of the big rivers in Nepal are glacier-fed, glaciers and snowline retreats can significantly impact the water resource, hydroelectric production, and the country’s rich biodiversity (Karki et al., 2016). The rugged terrain and remote location of the Himalayas make it very difficult to conduct rigorous field-based studies (Kulkarni et al., 2010; Shrestha et al., 2019). However, the advancement of satellite sensor technologies has helped the researchers conducting research remotely without having life-threatening trips to the mountains to perform snow cover analysis in the Himalayas.
Yin et al. (2013) suggested that Normalized Difference Snow Index (NDSI) is more suitable for snow mapping than manual interpretation or classification-based methods because of its simplicity, accuracy, and need of minimum human intervention. NDSI is a simple and established method developed by Dozer in 1989 to map SCAs using satellite images (Härer et al., 2018). Equation (1) represents the formula for NDSI calculation.
| (1) |
Where, Green band 4 and SWIR (short-wave infrared) band 6 for MODIS, Green band 2 and SWIR band 5 for Pre-Landsat 8 images, and Green band 3, and SWIR band 6 for Landsat 8 images. Fresh snow normally has the highest NDSI value, whereas, wet, dirty, and shadowed ice has the lowest NDSI value (Burns and Nolin, 2014). The NDSI decreases with snow age mainly due to reduction in reflectance of snow surface caused by the increase in snow surface impurity from atmospheric fallouts and increased grain size through melting (Dietz et al., 2012). The NDSI index value ranges between 1 to 1, and snow cover in an image is differentiated based on an NDSI threshold. The default NDSI threshold of 0.4 is generally used for automatic snow cover mapping in such that pixels with NDSI 0.4 are labeled as snow (Zhang et al., 2019). However, Riggs et al. (2017) suggested that snow can be present in a pixel as low as NDSI 0. The NDSI threshold of 0.1 was found suitable for snow cover analysis in China (Zhang et al., 2019). Yan et al. (2020) argued that the NDSI threshold is dependent on the image characteristics and using the default threshold value can compromise the result of snow cover mapping. Snow reflects a larger proportion in the visible wavelength, but as wavelength increases, the reflectance of snow declines, nearing zero in the near-infrared (IR) region. However, the reflectance of the cloud remains high even in the middle infrared region (Crawford et al., 2013).
The specific objective of this study include (1) to analyze temperature and precipitation trends and establish a relationship between changing temperature and precipitation and snow cover in the Annapurna region in Nepal from 1990–2020, and (2) to assess spatial and temporal changes in the snow cover area in the Annapurna Mountains.
Materials and Methods
Study Area
The study area includes the Annapurna massif of Nepal, which is one of the most popular tourist destinations in the country. The massif located in the center of northern Nepal, covers an area of 3257 km with a 55 km stretch of mountains from east to west. The altitude of the massif varies from 654 to 8,091 meters above mean sea level (masl) (Figure 1 and Table 1). Table 1 summarizes the meteorological stations around the massif. The massif and its surrounding area are protected under the Annapurna Conservation Area (ACA); the largest protected area in Nepal and one of the world’s most geographically and culturally diverse areas (Holden and Sparrowhawk, 2002). The massif consists of thirty mountain peaks with thirteen peaks over 7000m, and one peak is over 8000 masl (Adams Carter, 1985). The highest peak of the massif, Annapurna I Main at 8091 masl, is the tenth tallest and one of the most dangerous mountains in the world (Voiland, 2013). The top of peaks is covered by snow all year round, but the lower areas have snow only during the winter. Figure 2 shows some of the famous trekking routes of the area and climate stations within the region. Tourist visits are concentrated mainly in March to April and October to November (Holden and Sparrowhawk, 2002).

Figure 1 Map of Nepal (top left), Annapurna Conservation Area (top right) and Annapurna Massif with important mountains (bottom). Background: USGS National boundary dataset (top left) and Landsat 5 image (date:11-13-1991).
Table 1 Meteorological stations in the Annapurna massif
| Duration | ||||
| Station | Longitude, | Climate | (Temperature/ | |
| S.N. | (Elevation, Masl) | Latitude | Variable | Precipitation) |
| 1 | Chame (2680) | 84.233, 28.55 | P, T | 1990–2012 |
| 2 | Ghandruk (2100) | 83.799, 28.383 | P | 1990–2020 |
| 3 | Jomsom (2741) | 83.729, 28.784 | P, T | 1990–2020 |
| 4 | Lete (2490) | 83.609, 28.632 | P, T | (1990–2020) |
| (1998–2020) | ||||
| 5 | Manang Bhot (3556) | 84.022, 28.666 | P | 1990–2020 |
| 6 | Ranipauwa (Muktinath) (3671) | 83.862, 28.815 | P | 1990–2019 |
| T Temperature; P Precipitation. | ||||
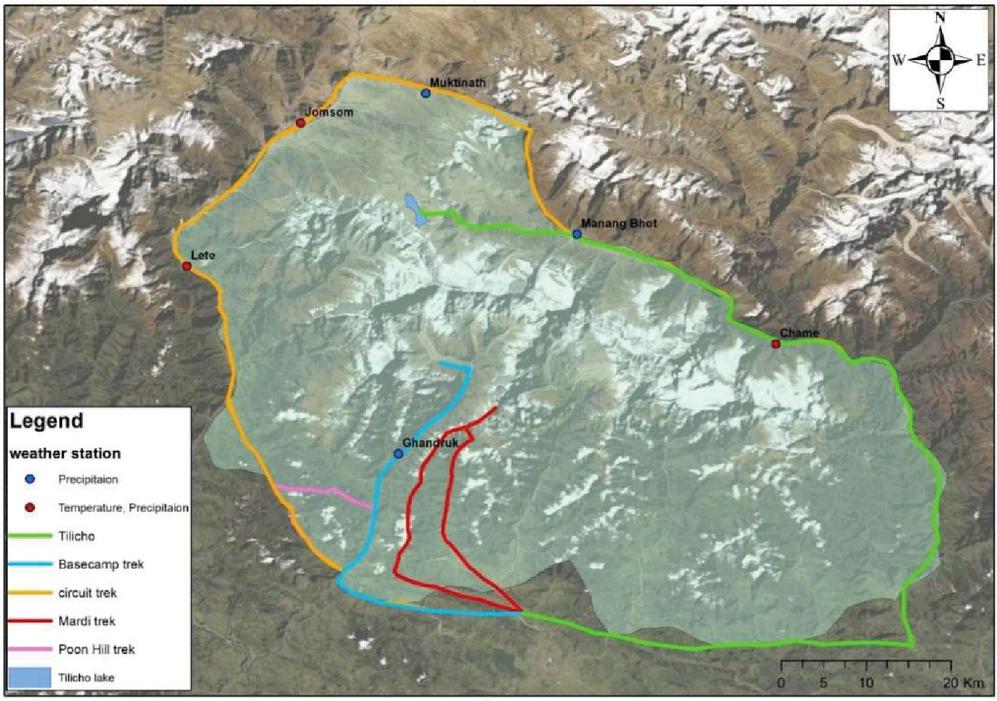
Figure 2 Trekking routes and weather stations around Annapurna massif. Background: Landsat 5 image.
Data Collection and Analyses
A total of 173 Landsat satellite images were obtained from the USGS Earth Explorer from 1990–2020 for seven months (Oct-Apr). The satellite data includes images from Landsat 4–5(TM), 7(ETM+), and 8(OLI)) with negligible cloud cover. Data from two different processing levels were used, i.e., level 1 and level 2. The level 2 images have undergone radiometric and atmospheric correction, whereas level 1 images represent raw images. Corrected images were downloaded from Landsat 5 and 7, while unprocessed images were downloaded from Landsat 8 and Landsat 7 images with scanline error. This is because raw Landsat 8 images were comparable with calibrated pre-Landsat 8 images in terms of NDSI value, and the scanline error in Landsat 7 images could only be corrected for raw images. Since the study uses data from different levels, instead of using a fixed NDSI threshold for the snow cover analysis, the NDSI value was carefully chosen for each image. Table 2 presents the characteristic of Landsat images.
Table 2 Characteristics of Landsat images used in the study
| Revisit | |||||
| Operation | Spectral | Wavelength | Period | Resolution | |
| Satellite | Duration | Bands | (m) | (Days) | (m) |
| Landsat 4–5 (TM); | 1984–2013; | Band 2 – Green | 0.52–0.60 | 16 | 30 |
| 7 (ETM) | 1999–present | Band 5 – SWIR 1 | 1.55–1.75 | ||
| Landsat 8 (OLI) | 2013–present | Band 3 – Green | 0.53–0.59 | ||
| Band 6 – SWIR 1 | 1.57–1.65 |
Table 3 Sources of primary data used in the study
| S.N. | Data | Source | Duration |
| 1 | Satellite Imagery | USGS Earth Explorer | Oct–Apr |
| 2 | Climate Data | Department of Hydrology and Meteorology | Jan–Dec |
| (DHM), Nepal |
The Meteorological (temperature and precipitation) data were collected from the Department of Hydrology and Meteorology (DHM), Nepal. Daily maximum and minimum temperature were obtained from three weather stations, and daily precipitation data were obtained from six stations. The boundary for country, conservation area, and the river were downloaded from https://pahar.in. Temperature and precipitation trends were analyzed on a monthly, season, and annual basis for maximum, minimum, and average temperature using daily recordings. The readings were converted into monthly and annual values in R studio and examined using JMP Pro 15 program. All the geospatial analyses were carried out in ArcMap version 10.7.1. The study area was delineated with the help of the district and drainage map at the distance of 5–10 km from the snow cover to minimize interference from other land covers. The images were projected to World Geodetic System 1984 (WGS84) datum using Universal Transverse Mercator (UTM) Zone 45N. Since 2003, Landsat 7 images have been affected by the presence of scanline error, an additional process of scanline removal was conducted to such images using the Landsat toolbox scanline removal function. Snow cover maps were generated using the NDSI. The images were then clipped to the study area and reclassified as snow or no snow pixels. The monthly average snow cover, mean temperature, and total precipitation were compared by dividing the study period into two halves: one from 1990 to 2004 and the next from 2005 to 2020. JMP Pro 15 was used to analyze simple linear regression of the snow cover data.

Figure 3 Maximum and minimum temperatures and trend-lines for maximum, minimum and average temperatures for the different weather stations.
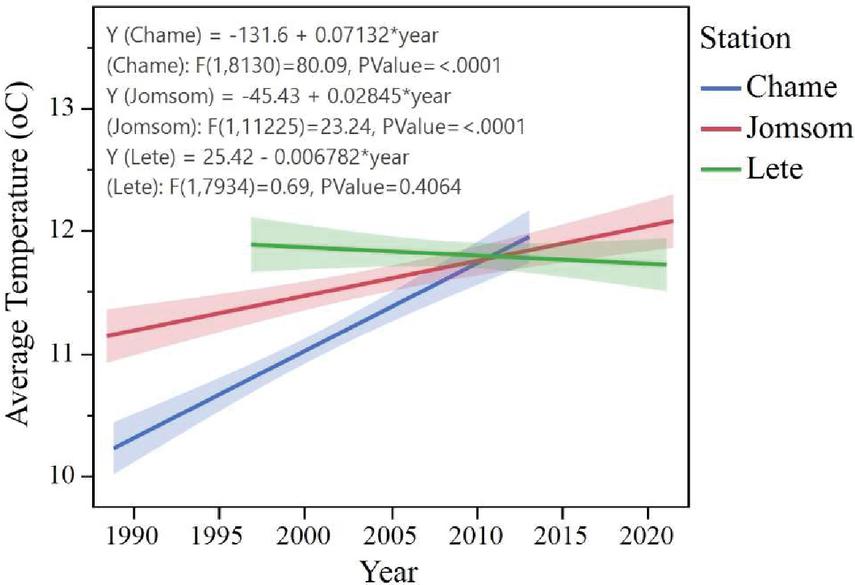
Figure 4 Average annual temperature trend for Chame, Jomsom and Lete.
Results and Discussion
Temperature
Increasing trends of annual average maximum temperature were observed in all three weather stations between 1990–2020. The highest increase rate in maximum temperature of 0.15C per year (p 0.001) was observed in Chame, increasing rate was significantly higher than that of the country’s annual average maximum temperature increase rate (0.02C per year, Shrestha et al. (2019)). The maximum temperature increase rate of 0.03C per year (p 0.001) was seen in Jomsom and it was 0.02C per year (p 0.05) in Lete. In contrast, the annual average minimum temperature was decreasing in Chame and Lete with the rate of 0.13C (p 0.001) and 0.03C per year (p 0.05), respectively. A non-significant decrease in minimum temperature was also observed in Jomsom. Among the three stations, the temperature in Chame is getting more extreme with significantly increasing maximum temperature and decreasing minimum temperature. Overall, the mean annual temperature in Chame and Jomsom is increasing at the rate of 0.07C and 0.03C per year (p 0.001), respectively, whereas Lete noted a non-significant decreasing trend. An east to west gradient was observed in average temperature in the first decade; however, after 2010, the average temperature in the east surpassed that of the west, making a west to east gradient suggesting that the eastern part is experiencing more warming. Figure 4 shows the shift in the temperature gradient. From the results, it can be inferred that the region around Annapurna Massif could be experiencing warming, especially towards the east and north-east part of the massif. This change could accelerate the retreat of the Gangapurna glacier, which is in the northern part of Annapurna III, causing expansion of the Gangapurna lake and creating the potential for GLOF event. Viste and Sorteberg (2015) also explained that higher temperatures in the future could mean a reduction in the fraction of precipitation falling as snow. The outcome of the annual mean temperature trend is consistent with the observation of Thapa et al. (2020) and Mishra et al. (2014).
Seasonal temperature analysis showed an upward trend of annual average maximum temperature for all seasons in Chame and increasing summer maximum temperature in Lete. In the case of minimum temperature, only Chame observed decreasing temperature trend in the summer season. This suggests that the northern (leeward) side of the Annapurna massif near Chame is experiencing a significant change in both minimum and maximum temperature. The occurrence of such temperature extreme could affect the biodiversity of the region due to adaptation stress. From the 21st century, the minimum temperature is sharply decreasing during summer and the maximum temperature is increasing during winter in Chame. This change might be attributed to an increase in summer precipitation and a decrease in post-monsoon to winter precipitation. The analysis of monthly temperature trends showed an increase of maximum temperature in Chame for January through April, September, and November with the highest increase rate of 0.34C per year (February) and lowest rate of 0.1C per year (September). In Jomsom, increase in maximum temperature was noted for February and August through November. Lete also observed an increase in maximum temperature in August and September. Not a single month in any of the stations observed a statistically significant decline in maximum temperature. The minimum temperature for Chame showed a decreasing trend from April to October and in December; July noted the highest decline rate of 0.35C per year, while the lowest decline rate of 0.09C per year was observed in December. No significant monthly trend was observed for minimum temperature in Jomsom. Lete noted a minimum temperature decrease in May at the rate of 0.07C per year. Although the stations observed both maximum temperature increase and minimum temperature decrease, the occurrence of an increase in maximum temperature was more common in these stations. However, the occasional decrease in minimum temperature could facilitate the accumulation of snow cover and, to some extent, compensate for the melting of snow due to rising temperature. The mean temperature shows an increasing trend in Chame from March to Aug, while the mean temperature increased in Jomsom during July and Sept and in Lete during June and August.
Precipitation
The total annual precipitation is significantly higher in Ghandruk in the south (1600–5500 mm per year) than in other stations as it lies in the windward side of the massif. Lete (west) and Chame (northeast) receives total precipitation between 400 to 2000 mm per year, whereas Jomsom (northwest), Manang Bhot (north), and Ranipauwa (north) receives lowest amount of precipitation (500 mm per year), as these three stations are located in the leeward side of the massif. A clear north-south gradient was observed in annual precipitation over the study area (Figure 5). The altitude of the weather stations varied between 2100 and 3700 masl, however, no clear relation was found between altitude and total annual precipitation. All the stations observed the highest amount of precipitation during summer (monsoon), followed by autumn, spring, and considerably less precipitation during winter. Therefore, even a small change in total precipitation during winter could make a huge difference, whereas a significant change in summer could be a common occurrence.
Out of the six weather stations, five (Chame, Ghandruk, Jomsom, Lete, and Ranipauwa) noted an increasing trend in annual precipitation with the statistically significant trend in two of the weather stations (Ghandruk and Ranipauwa). In contrast, one station in the north (Manang Bhot) observed a significantly decreasing precipitation trend. The increase in total precipitation was highest in Ghandruk with an increasing rate of 50.3 mm per year, while precipitation in Ranipauwa increased by 4.8 mm per year. The results are contrary to Mishra et al. (2014), who did not observe any precipitation trends in both Ghandruk and Ranipauwa. The difference in observation could be due to the difference in the period of analysis. The result suggests that Ghandruk and Ranipauwa could have experienced a rapid increase in precipitation intensity in the last decade, similar to the observation of Shrestha et al. (2019). Figure 6 provides the total annual precipitation trend in all six stations.
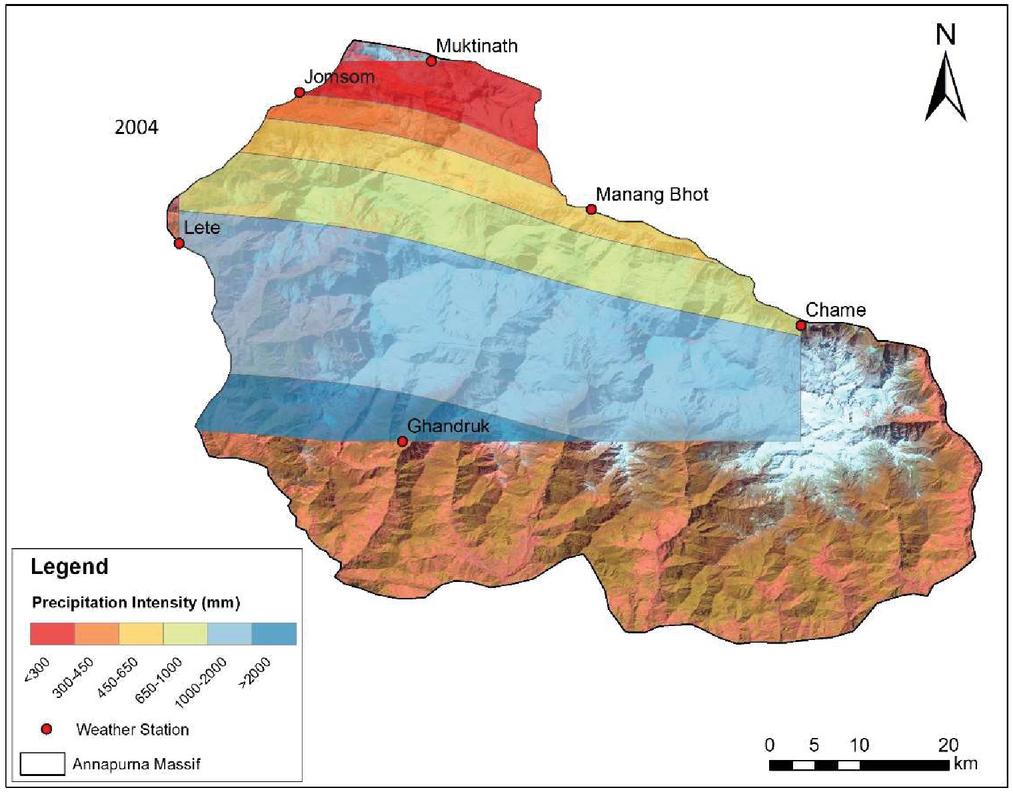
Figure 5 Precipitation gradient over Annapurna Massif for the year 2004.
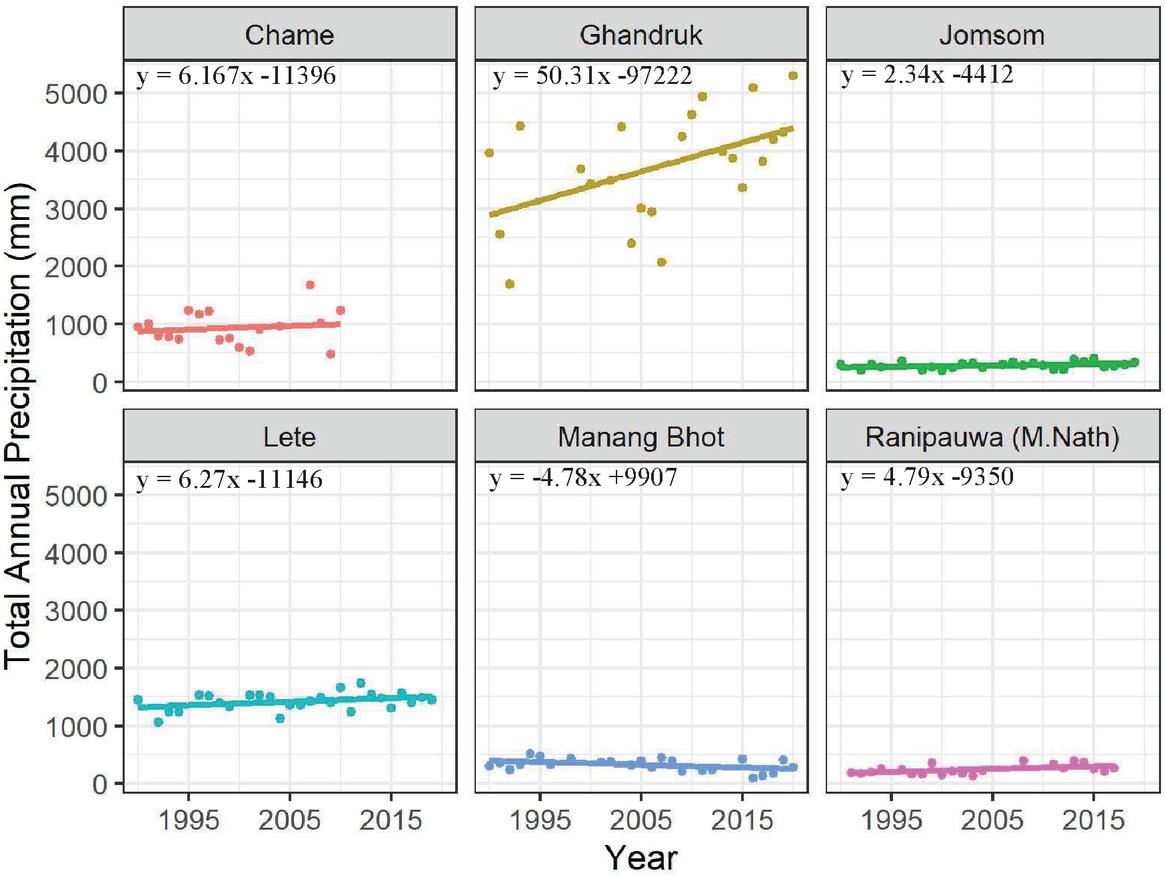
Figure 6 Total Annual Precipitation trends in different weather stations.
Ghandruk, Ranipauwa, and Lete observed a positive trend of total precipitation for all the seasons. Chame and Jomsom also noted an increasing trend in all the seasons except in autumn. The trends were significant during spring-summer in Ghandruk, summer and winter in Ranipauwa, and summer in Jomsom; no significant trends were seen in Lete and Chame. Manang Bhot noted a sharp decline in summer precipitation and a non-significant decline in other seasons. Since significantly increasing precipitation trends were observed mainly during summer, the annual increase in precipitation could have resulted from increased monsoon precipitation. The result is consistent with Karki et al. (2017) observations, who reported an increase in monsoon and pre-monsoon trend and decreasing post-monsoon precipitation in central high mountains.
Analysis was also conducted to observe the change in the number of precipitation days in all six stations. Jomsom and Lete observed an upward trend in the number of precipitation days for all seasons, while Chame and Manang Bhot noted a downward trend. During spring, the trends were significant for Ghandruk, Jomsom, and Lete, with an increase rate of 0.66, 0.37, and 0.38 days per year, respectively, while Manang Bhot observed a significant decreasing rate of 0.31 days per year. Since Chame noted an upward trend in total precipitation for spring, summer, and winter and a downward trend in the number of precipitation days for all seasons, it can be inferred that the precipitation intensity is increasing in Chame. The highest increase in the number of precipitation days was seen in Jomsom during summer, with an increase rate of 0.93 days per year.
The result suggests that Ranipauwa, Jomsom, Lete, and Ghandruk are experiencing an increase in precipitation days and total precipitation, while Manang Bhot is observing a decreasing trend in most seasons. Chame is experiencing a rise in precipitation intensity in all seasons except autumn, which is getting drier. This change in precipitation trend could cause water shortages in one area while increase river discharge in the other area. A non-significant decrease in precipitation days was observed in winter in Ghandruk, Manang Bhot, and Chame, which could significantly reduce snowfall and accumulation of snow. All stations noted a non-significant decline in precipitation days in November, and two stations (Ghandruk and Manang Bhot) noticed a significant decrease in December. During March, Ghandruk, Lete, and Jomsom observed both upward trends in total precipitation and precipitation days. Since March, November, and December are the season transition months, the continuation of the current trend of changing precipitation days in these months might change the seasonal occurrence of snow, i.e., more snowfall could appear in early spring compared to early winter. Despite the change in the amount of precipitation in different seasons, the general pattern in the precipitation cycle has not been disrupted. Figure 7 displays the precipitation pattern for each month in two different periods (1990–2004 as before and 2005–2020 as recent).
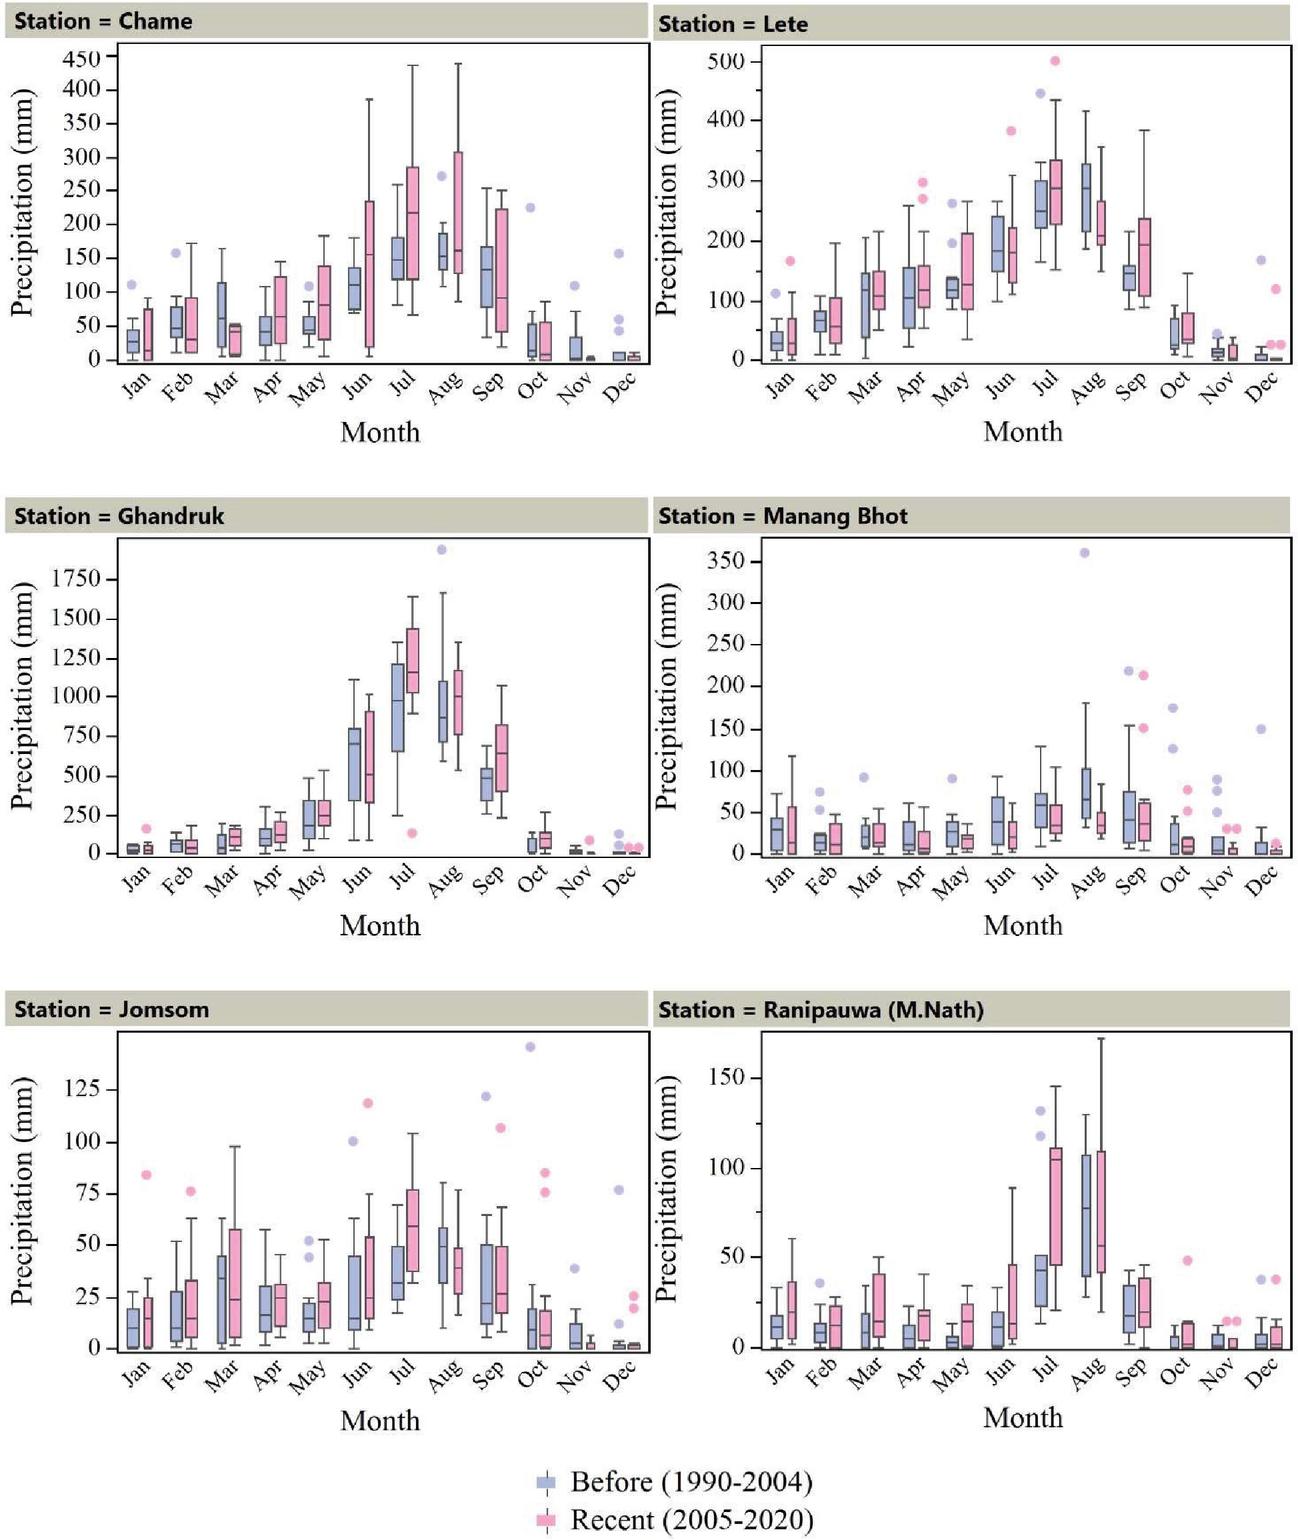
Figure 7 Comparison of monthly total precipitation patterns between two periods (1990-2004 as before and 2005-2020 as recent).
Snow Cover
The NDSI threshold of 0.1–0.15 worked best for 119 images (about 70 percent) rather than the commonly used threshold of 0.4. Higher NDSI thresholds were generally obtained for those images that had undergone scanline error correction. It was noticed that the use of images from different levels changes the NDSI threshold effective for the distinction of snow cover. The calibrated Landsat 5&7 images distinguished snow cover effectively with NDSI value 0.1–0.15, whereas the raw images required an NDSI value 0.4. The opposite was true for Landsat 8 images. This indicates that the NDSI value depends on the image characteristic and the type of image used. NDSI effectively differentiated between snow and other land covers in most cases, except for large bluish clouds and thin clouds. However, NDSI was less effective in differentiating between the water and snow-covered surfaces for both calibrated and uncalibrated images.
During the study period, the SCA in the Annapurna massif varied from minimum of 12.2 percent (October 2015) to maximum 53.3 percent (March 2019) of the total area, which is 397.4 km and 1735.8 km, respectively. The monthly variability in mean SCA for seven months from October to April for the past three decades is given in Figure 8. In January, the snow cover displayed the most variability with mean SCA at about 33 percent (1042 km) of total area. Since the snow cover analysis was carried out just for seven months thus, for this study, the maximum snow cover was observed in March, while the minimum was observed in October. Contrary to this result, some studies have observed maximum snow cover in February (Kulkarni et al., 2010; Gurung et al., 2011; Singh et al., 2018), and some studies have noted the lowest snow cover in August and September (Singh et al., 2018).The snow cover was generally higher from January to April, which may be due to gradually increasing precipitation and a temperature that is low enough to maintain snow accumulation. The monthly variation in SCA in Annapurna massif is consistent with the observation made by Kulkarni et al. (2010).
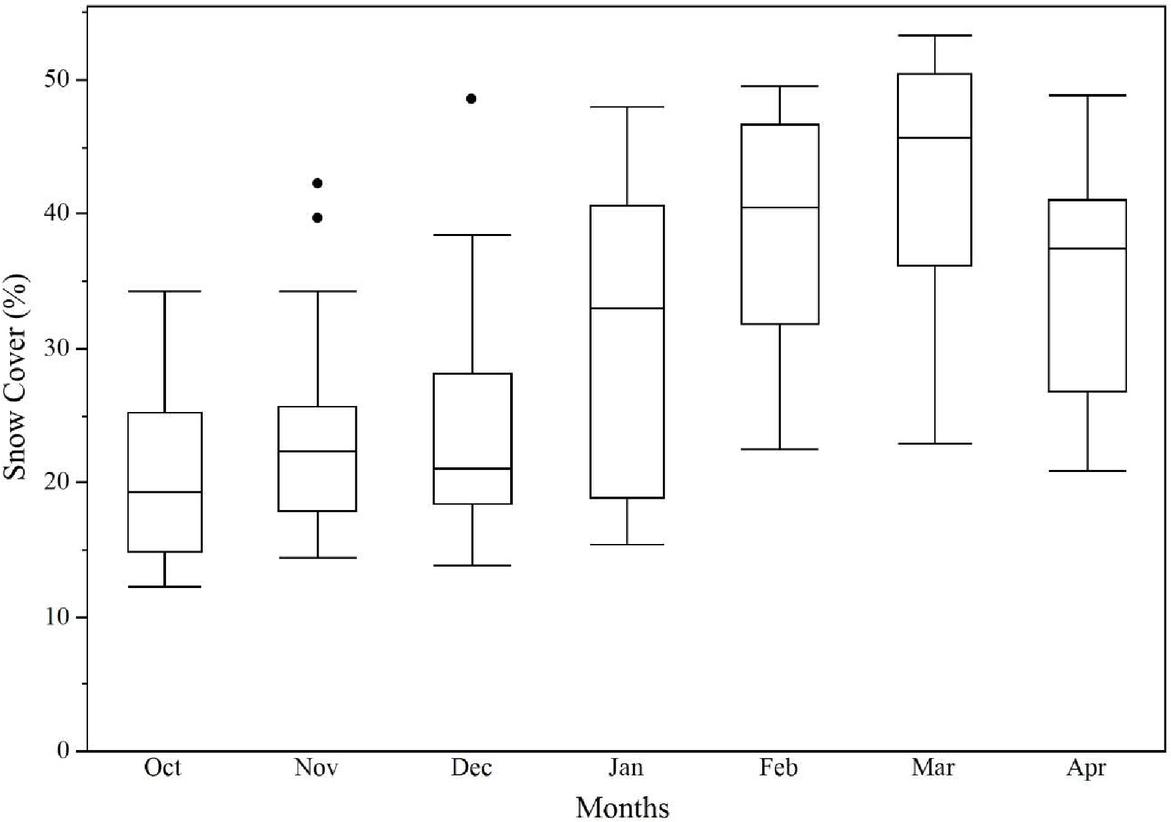
Figure 8 Distribution of percent snow cover for different months from 1990 to 2020 in Annapurna massif. The Box plot provides the first quartile, median and third quartile and whiskers represent the maximum and minimum range of the data.
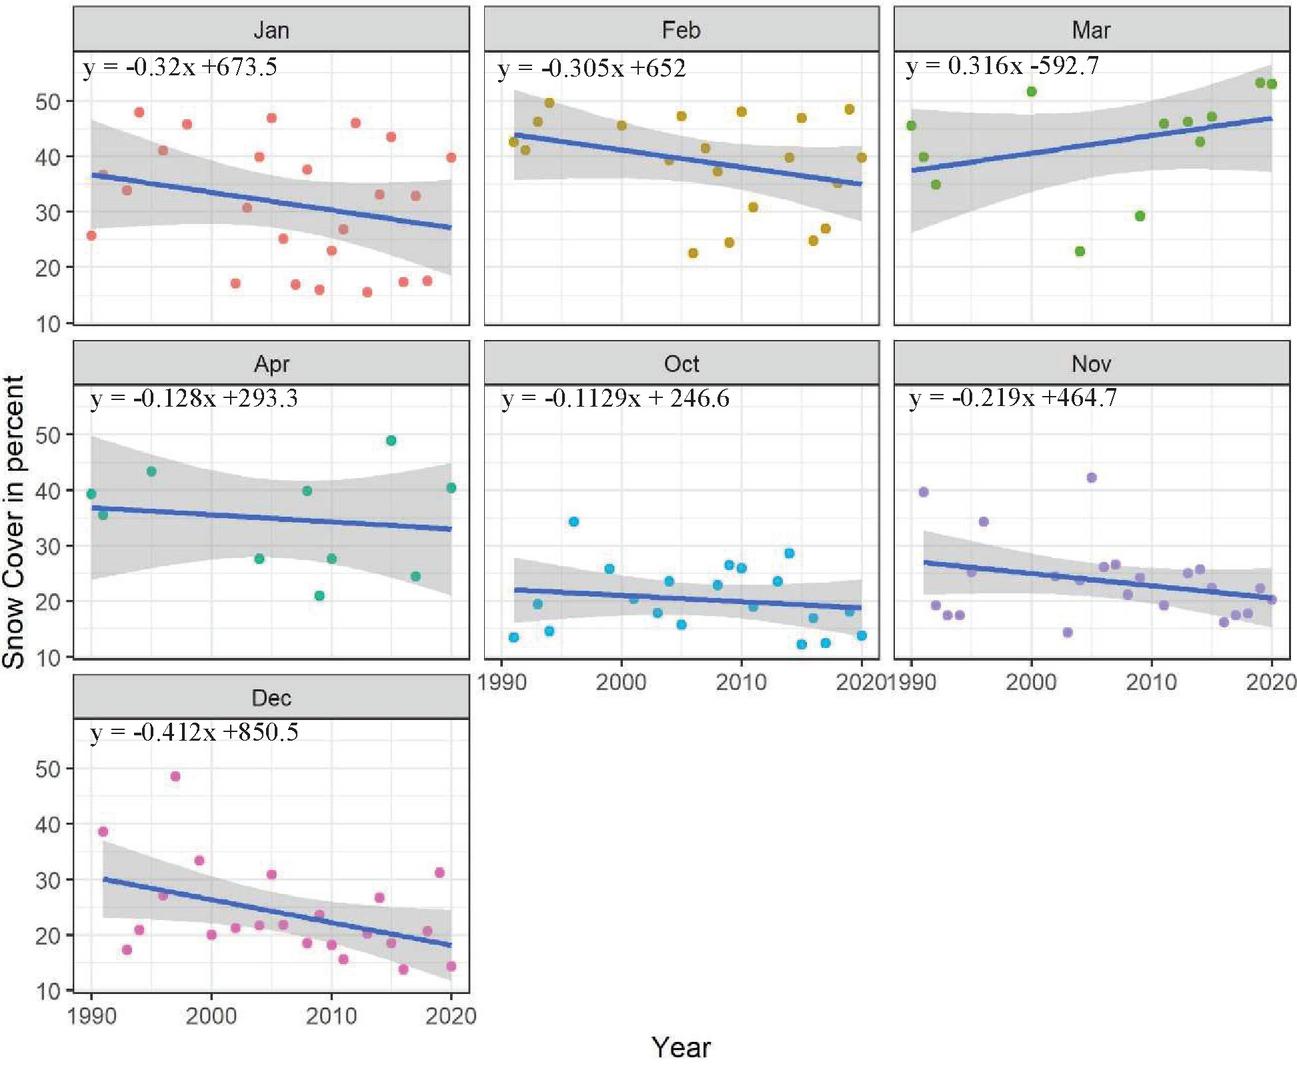
Figure 9 Monthly snow cover trends in the Annapurna massif for different years from 1990–2020. The line represents the linear regression line for each month and the gray band is the 95% confidence interval for the regression line.
A declining trend in SCA was observed over Annapurna massif for six out of seven months (Figure 9). The month of December displayed a significantly reducing SCA, with a decreasing rate of 13.4 km per year, the rest of the months (January, February, April, October, and November) showed a non-significant decline in SCA. Only the month of March had a non-significant positive trend of SCA. Mishra et al. (2011) also observed an increasing snow cover trend in March in and around the Nepalese Himalayas. The consistent decline in SCA in December and insignificant decline in other months could be due to a rise in maximum temperature and decreasing precipitation events during winter, particularly in November and December (even though the decrease in precipitation was insignificant). Nyaupane and Chhetri (2009) also observed a decline in precipitation in the form of snow during winter. In contrast, increasing SCA in March could be due to the increasing precipitation days and positive trend of total precipitation in four out of six stations during the spring season, particularly in March. However, more research is needed to understand other forces contributing to the increase in snow cover area and the potential future changes. Although most of the results were not significant, a decrease in snow cover seen in most months could affect the region’s climate and streamflow pattern. If the snow cover trend continues, the increase in SCA during the early spring could increase streamflow during summer, leading to floods and landslides. However, there could be a significant decrease in streamflow during the autumn and winter season.
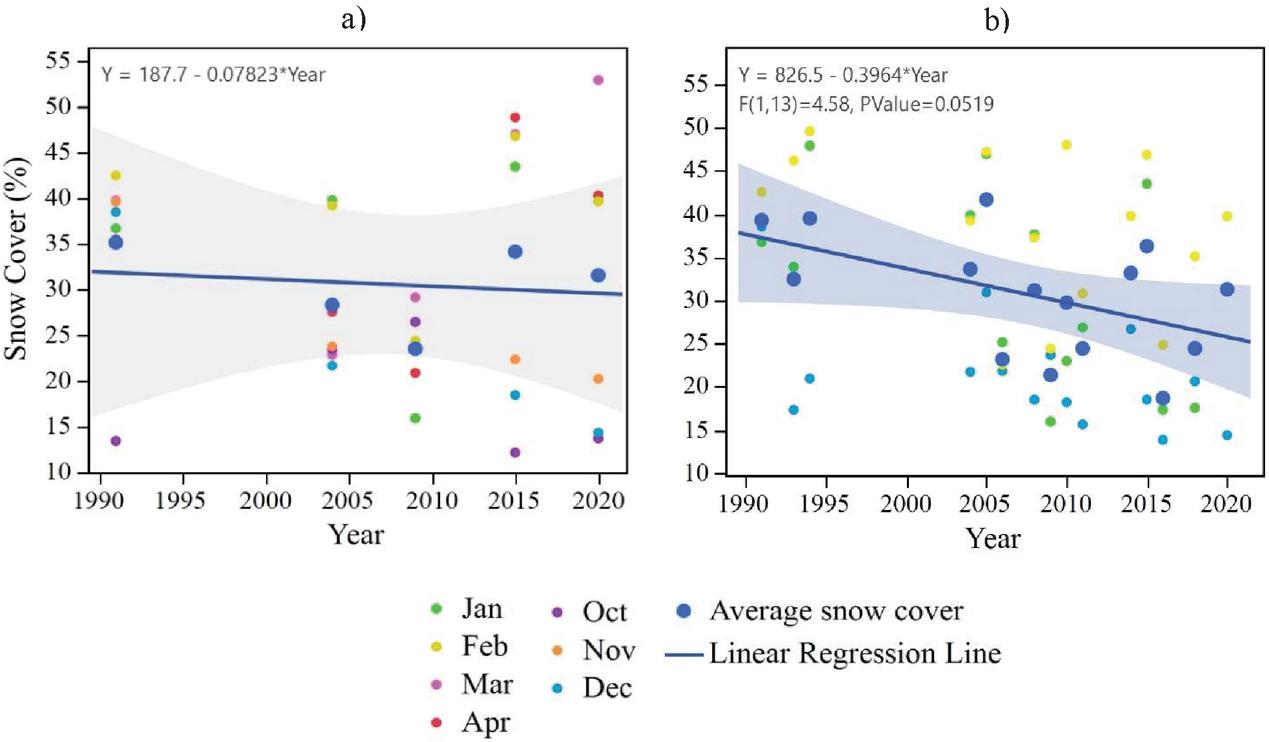
Figure 10 Snow cover trend for (a) year with complete seven-month data (b) winter months. The gray band is the 95% confidence interval for the regression line.
Due to cloud interference, a complete (seven-month) snow cover data could be obtained only for five years, i.e., 1991, 2004, 2009, 2015, and 2020. The mean of the seven-month SCA showed an insignificant decreasing trend (Figure 10(a)). In the early 90s, monthly SCA was between 35 to 43 percent of the total area for all the months except October. However, the recent decade displayed high variability, with snow cover area between 12 to 53 percent of the total area. This result suggests that there could be high irregularity in snowfall events in the most recent decade. The year 2009 observed a considerable decline in SCA for most months, consistent with the sharp rise in average temperature and precipitation in Chame from 2000 to 2007. Similarly, a significantly decreasing trend in SCA was observed during the winter (December-February) with a declining rate of 0.39 percent (12.9 km per year).
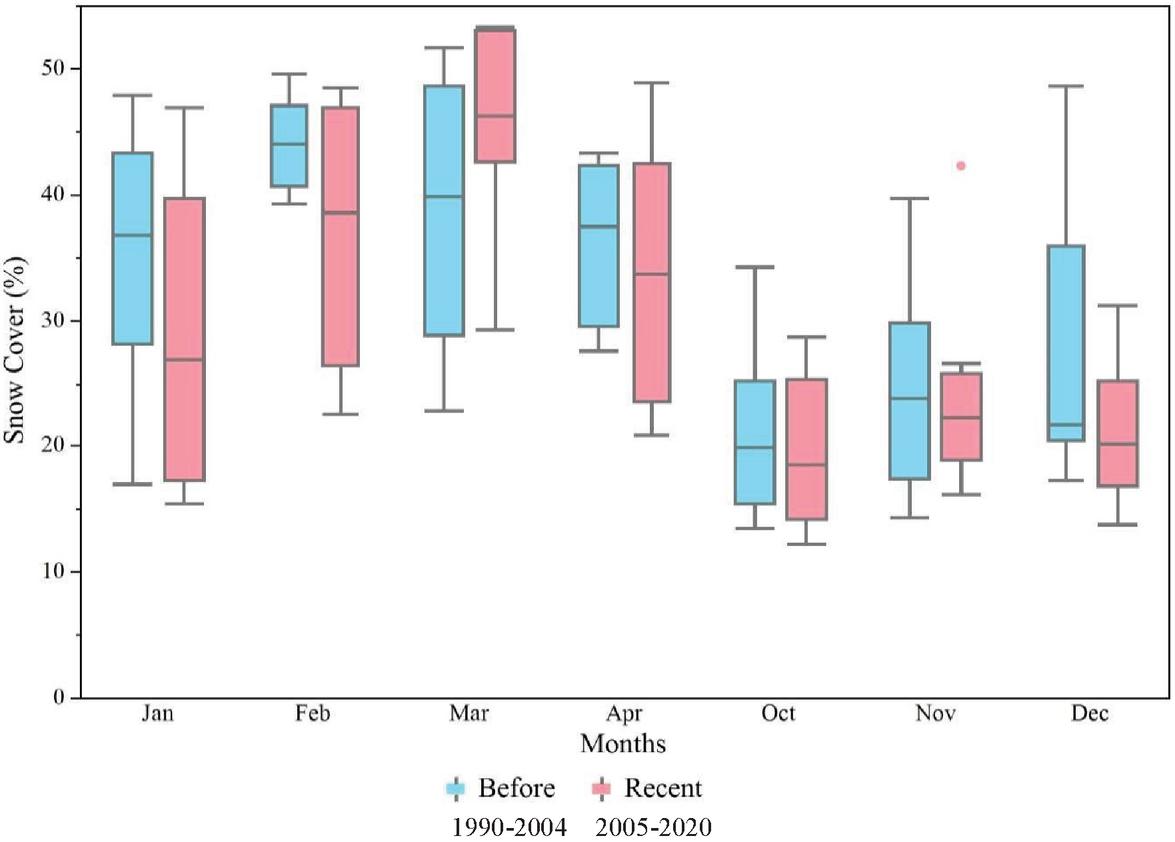
Figure 11 Comparison of changes in average monthly snowfall between two periods (1990-2004 as before and 2005-2020 as recent). The Box plot represents the first quartile, median, and third quartile and whiskers represent the maximum and minimum range of snow cover percent.
The SCA was compared by categorizing the study period into two equal periods, before (1990–2004) and after (2005–2020). The result indicated that the highest snow cover percent has shifted from February in the first half to March in the second half (Figure 11). This result may suggest a shift in the snowfall cycle, which could be due to an increase in precipitation in March; however, year-round, long-term analysis is needed to confirm this speculation. Except for March, the average snow cover percent is less in the second half than the first half indicating snowmelt acceleration in most months. The mean snow cover percent difference was highest for January, with a 10 percent reduction in mean SCA. Increased snowmelt has aided in forming a glacier lake in the recent decade towards the south of Annapurna II. The historical image of google earth reveals a few small glacier ponds in 2008, which has turned into one lake of 90,000–95,000 m area in recent years. You et al. (2017) pointed out that due to snow and ice melting, there is a shift in the peak discharge time from middle/late summer to late spring/early summer in HKH. The Annapurna region could also experience a shift in discharge if the reduction in snow cover continues, causing less reliability to local water resources in the future.
Summary and Recommendations
In Annapurna massif, Chame and Jomsom are undergoing a consistent increase in the annual average temperature at the rate of 0.07 and 0.03C per year, respectively. Chame is experiencing very high increasing rates in maximum temperature and facing a decrease in minimum temperature, leading to a more extreme climate. Based on the trend of three weather stations, the temperature gradient shows a shift from east-west to a west-east gradient in the recent decade. High spatial variability in precipitation was observed in Annapurna, with the annual precipitation increasing significantly in Ghandruk (south) and Ranipauwa (northwest) but decreasing in Manang Bhot (north). Rising annual precipitation is attributed to increasing spring and summer precipitation. Most stations also observed a decline in precipitation during November and December. The rising temperature of Annapurna massif and the changing precipitation pattern is causing an impact on the SCA of the region. A significant decrease SCA of 13.4 km per year was observed in December, along with a non-significant decrease in other months except for March, which noted a non-significant increase in SCA. The comparison of average monthly snowfall between two periods (1990–2004 and 2005–2020) showed a shift of highest snow cover from February to March, with a decline in mean snow cover percent from 44 to 38 in February and increasing in March from 39 to 46 percent of total area.
This study helped in understanding climate change trends and the status of snow cover in the Annapurna region. These observations could assist stakeholders and the government to make essential decisions regarding water resource management. Snow cover change in ACA could significantly influence the stream and river discharge; thus, it is crucial to analyze year-round SCA and find the effects of snow cover change on the area’s water resource and flora and fauna. It is also crucial to understand how different image characteristics affect NDSI values and how to effectively choose the NDSI threshold for various images. The Use of cloud elimination technique like cloud mask is recommended so that all the satellite images could be utilized to obtain higher accuracy in snow cover studies of the ACA.
Acknowledgments
We would like to express our sincere thanks to Dr. Brian A. Schubert, School of Geosciences, University of Louisiana at Lafayette, Louisiana, USA, for his valuable comments on the manuscript. We would like to acknowledge the Department of Hydrology and Meteorology, Government of Nepal, for making climate data available, which is a crucial part of this research. We would like to thank Ms. Pratiksya Koirala and Ms. Anushilan Acharya for their help in data acquisition and providing valuable field information about the study area.
References
Adams Carter, H., 1985, Classification of the Himalaya: The American Alpine Journal, p. 109–141.
Burns, P., and A. Nolin, 2014, Using atmospherically-corrected Landsat imagery to measure glacier area change in the Cordillera Blanca, Peru from 1987 to 2010: Remote Sensing of Environment, v. 140, p. 165–178, doi:10.1016/j.rse.2013.08.026.
Crawford, C. J., S. M. Manson, M. E. Bauer, and D. K. Hall, 2013, Multitemporal snow cover mapping in mountainous terrain for Landsat climate data record development: Remote Sensing of Environment, v. 135, p. 224–233, doi:10.1016/j.rse.2013.04.004.
Dietz, A. J., C. Kuenzer, U. Gessner, and S. Dech, 2012, Remote sensing of snow – a review of available methods: International Journal of Remote Sensing, v. 33, no. 13, p. 4094–4134, doi:10.1080/01431161.2011.640964.
Gurung, D. R., A. Giriraj, K. S. Aung, B. Shrestha, and A. V. Kulkarni, 2011, Snow-Cover Mapping and Monitoring in the Hindu Kush-Himalayas: The International Centre for Integrated Mountain Development, p. 1–44.
Härer, S., M. Bernhardt, M. Siebers, and K. Schulz, 2018, On the need for a time- and location-dependent estimation of the NDSI threshold value for reducing existing uncertainties in snow cover maps at different scales: Cryosphere, v. 12, no. 5, p. 1629–1642, doi:10.5194/tc-12-1629-2018.
Hijioka, Y., E. Lin, J.J. Pereira, R.T. Corlett, X. Cui, G.E. Insarov, R.D. Lasco, E. Lindgren, and A. Surjan, 2014, Asia. In: Climate Change 2014: Impacts, Adaptation, and Vulnerability. Part B: Regional Aspects. Contribution of Working Group II to the Fifth Assessment Report of the Intergovernmental Panel on Climate Change [Barros, V.R., C.B. Field, D.J. Dokken, M.D. Mastrandrea, K.J. Mach, T.E. Bilir, M. Chatterjee, K.L. Ebi,Y.O. Estrada, R.C. Genova, B. Girma, E.S. Kissel, A.N. Levy, S. MacCracken, P.R. Mastrandrea, and L.L. White (eds.)]. Cambridge University Press, Cambridge, United Kingdom and New York, NY, USA, pp. 1327–1370.
Holden, A., and J. Sparrowhawk, 2002, Understanding the motivations of ecotourists: the case of trekkers in Annapurna, Nepal: International Journal of Tourism Research, v. 4, no. 6, p. 435–446, doi:10.1002/jtr.402.
ICIMOD, 2011, Glacial lakes and glacial lake outburst floods in Nepal. Kathmandu: ICIMOD, Accessed June 16, 2021, https://www.gfdrr.org/sites/default/files/publication-/final\_report\_Glacial\%20Lakes\%20Outburst\%20Floods\%20Nepal.pdf
Immerzeel, W. W., P. Droogers, S. M. de Jong, and M. F. P. Bierkens, 2009, Large-scale monitoring of snow cover and runoff simulation in Himalayan river basins using remote sensing: Remote Sensing of Environment, v. 113, no. 1, p. 40–49, doi:10.1016/j.rse.2008.08.010.
Karki, R., R. Talchabhadel, J. Aalto, and S. K. Baidya, 2016, New climatic classification of Nepal: Theoretical and Applied Climatology, v. 125, no. 3–4, p. 799–808, doi:10.1007/s00704-015-1549-0.
Karki, R., S. ul Hasson, U. Schickhoff, T. Scholten, and J. Böhner, 2017, Rising precipitation extremes across Nepal: Climate, v. 5, no. 1, p. 1–25, doi:10.3390/cli5010004.
Maskey, S., S. Uhlenbrook, and S. Ojha, 2011, An analysis of snow cover changes in the Himalayan region using MODIS snow products and in-situ temperature data: Climatic Change, v. 108, no. 1, p. 391–400, doi:10.1007/s10584-011-0181-y.
Merrey, D. J., A. Hussain, D. D. Tamang, B. Thapa, and A. Prakash, 2018, Evolving high altitude livelihoods and climate change: a study from Rasuwa District, Nepal: Food Security, v. 10, no. 4, p. 1055–1071, doi:10.1007/s12571-018-0827-y.
Mishra, B., M. S. Babel, and N. K. Tripathi, 2014, Analysis of climatic variability and snow cover in the Kaligandaki River Basin, Himalaya, Nepal: Theoretical and Applied Climatology, v. 116, no. 3–4, p. 681–694, doi:10.1007/s00704-013-0966-1.
NOAA National Centers for Environmental Information, State of the Climate: Global Climate Report for Annual 2020, published online January 2021, Accessed June 21, 2021, https://www.ncdc.noaa.gov/sotc/global/202013.
Nyaupane, G. P., and N. Chhetri, 2009, Vulnerability to climate change of nature-based tourism in the Nepalese Himalayas: Tourism Geographies, v. 11, no. 1, p. 95–119, doi:10.1080/14616680802643359.
Pandey, R., and D. K. Bardsley, 2015, Social-ecological vulnerability to climate change in the Nepali Himalaya: Applied Geography, v. 64, p. 74–86, doi:10.1016/j.apgeog.2015.09.008.
Riggs, G. A., D. K. Hall, and M. O. Román, 2017, Overview of NASA’s MODIS and Visible Infrared Imaging Radiometer Suite (VIIRS) snow-cover Earth System Data Records: Earth System Science Data, v. 9, no. 2, p. 765–777, doi:10.5194/essd-9-765-2017.
Shrestha, A. B., and R. Aryal, 2011, Climate change in Nepal and its impact on Himalayan glaciers: v. 11, doi:10.1007/s10113-010-0174-9.
Shrestha, A. B., and S. P. Joshi, 2009, Snow Cover and Glacier Change Study in Nepalese Himalaya Using Remote Sensing and Geographic Information System: v. 6, no. 1, p. 26–36.
Shrestha, U. B., A. M. Shrestha, S. Aryal, S. Shrestha, M. S. Gautam, and H. Ojha, 2019, Climate change in Nepal: a comprehensive analysis of instrumental data and people’s perceptions: Climatic Change, no. Weber 2010, doi:10.1007/s10584-019-02418-5.
Shrestha, A. B., C. P. Wake, P. A. Mayewski, and J. E. Dibb, 1999, Maximum temperature trends in the Himalaya and its vicinity: An analysis based on temperature records from Nepal for the period 1971–94: Journal of Climate, v. 12, no. 9, p. 2775–2786, doi:10.1175/1520-0442(1999)012<2775:MTTITH>2.0.CO;2.
Singh, D. K., H. S. Gusain, V. Mishra, and N. Gupta, 2018, Snow cover variability in North-West Himalaya during last decade: Arabian Journal of Geosciences, v. 11, no. 19, p. 1–12, doi:10.1007/s12517-018-3926-3.
Tariyal, K., D. M. Bartwal, and U. Melkania, 2013, Glacial melting in Himalaya: Local Impacts of Climate Change on Mountain Ecosystems and Livelihoods: Journal of Advanced Laboratory Research in Biology, v. 4, no. 6, p. 99–104.
Thapa, S., B. Li, D. Fu, X. Shi, B. Tang, H. Qi, and K. Wang, 2020, Trend analysis of climatic variables and their relation to snow cover and water availability in the Central Himalayas: a case study of Langtang Basin, Nepal: Theoretical and Applied Climatology, v. 140, no. 3–4, p. 891–903, doi:10.1007/s00704-020-03096-5.
Viste, E., and A. Sorteberg, 2015, Snowfall in the Himalayas: An uncertain future from a little-known past: Cryosphere, v. 9, no. 3, p. 1147–1167, doi:10.5194/tc-9-1147-2015.
Voiland, B. A., 2013, The Eight-Thousanders: p. 1–35. Accessed November 15, 2020, https://www.earthobservatory.nasa.gov/features/8000MeterPeaks
Xu, J., R. E. Grumbine, A. Shrestha, M. Eriksson, X. Yang, Y. Wang, and A. Wilkes, 2009, The melting Himalayas: Cascading effects of climate change on water, biodiversity, and livelihoods: Conservation Biology, v. 23, no. 3, p. 520–530, doi:10.1111/j.1523-1739.2009.01237.x.
Yan, D., C. Huang, N. Ma, and Y. Zhang, 2020, Improved landsat-based water and snow indices for extracting lake and snow cover/glacier in the Tibetan plateau: Water (Switzerland), v. 12, no. 5, doi:10.3390/W12051339.
Yin, D., X. Cao, X. Chen, Y. Shao, and J. Chen, 2013, Comparison of automatic thresholding methods for snow-cover mapping using Landsat TM imagery: International Journal of Remote Sensing, v. 34, no. 19, p. 6529–6538, doi:10.1080/01431161.2013.803631.
You, Q. L., G. Y. Ren, Y. Q. Zhang, Y. Y. Ren, X. B. Sun, Y. J. Zhan, A. B. Shrestha, and R. Krishnan, 2017, An overview of studies of observed climate change in the Hindu Kush Himalayan (HKH) region: Advances in Climate Change Research, v. 8, no. 3, p. 141–147, doi:10.1016/j.accre.2017.04.001.
Zhang, H., F. Zhang, G. Zhang, T. Che, W. Yan, M. Ye, and N. Ma, 2019, Ground-based evaluation of MODIS snow cover product V6 across China: Implications for the selection of NDSI threshold: Science of the Total Environment, v. 651, p. 2712–2726, doi:10.1016/j.scitotenv.2018.10.128.
Biographies

Susmita Shrestha earned her Master’s of Science degree in Environmental Resource Science from the University of Louisiana at Lafayette, LA, USA, and Bachelor’s of Science degree in Environmental Science from Kathmandu University, Nepal. She currently works as a GIS Analyst in Tetra Tech. Her research interest lies in climate change studies and water resource management. She is also passionate about the use of GIS and remote sensing technology in resource management.

Durga D. Poudel is a Professor of Environmental Science at University of Louisiana at Lafayette, Lafayette, USA. He received his B.Sc. degree in Agriculture from University of Agriculture, Faisalabad, Pakistan, M.Sc. in Natural Resource Development and Management from Asian Institute of Technology, Bangkok, Thailand, and Ph.D. in Soil Science from the University of Georgia, Athens, GA, USA. Dr. Poudel’s professional experience consists of Research Fellow at Asian Vegetable Research and Development Center, Taiwan; Graduate Research Assistant in Sustainable Agricultural and Natural Resource Management Collaborative Research Support Program, University of Georgia, Athens, GA, USA; and Visiting Research Scholar, University of California Davis, USA. Dr. Poudel joined the University of Louisiana at Lafayette, USA, as an Assistant Professor of Soil Science in August 2000. Dr. Poudel is a Board of Regents Professor in Applied Life Sciences at the University of Louisiana at Lafayette, Louisiana, USA. As an Associate Editor, Dr. Poudel has been serving the Strategic Planning for Energy and the Environment journal since 2020. He is the Founder of Asta-Ja Framework and the Founding President of Asta-Ja Research and Development Center (Asta-Ja RDC) Kathmandu, Nepal, and Asta-Ja USA.

Timothy W. Duex has been at the University of Louisiana at Lafayette since 1984 where he is Associate Professor in the School Geosciences. He is a member of several professional societies, including the Lafayette Geological Society, in which he served as President, the American Association of Petroleum Geology, Division of Environmental Geology, where he is Secretary-Treasurer, the Geological Society of America, and the Baton Rouge Geological Society. He is also the University of Louisiana representative since 2001 on the Water Advisory Task Force of the Louisiana Department of Natural Resources. He teaches courses in Hydrology, Environmental Geology, Mineralogy, Petrology, and Field investigations.

Rodney B. Yantis is the Director of the NASA/UL Lafayette Regional Application Center at the University of Louisiana at Lafayette. Having a degree in Agriculture and a Master’s in Landscape Architecture: Landscape Ecology/GIS and Remote Sensing, he is the current Board Chair of the National AmericaView program; Director of LouisianaView; State GeoSpatial Contractor to the Louisiana Army National Guard and USGS; and is a member, past President, of the Mid-South ASPRS and member of the Louisiana and Caribbean chapters of URISA working in emergency response since 2001. He hosts training for Natural Disaster and Emergency Response held annually for 22 years. His affiliation with the International Charter for Disaster Response as a Project Manager since 2006 has led to working with Hurricanes Ida, Laura, Delta, Rita, Katrina, Ike, Gustav, Andrew, Florence, Michael, Dorian (to name a few) and Oil Spill response to the DeepWater Horizon, along with flood mapping in Nepal.
Strategic Planning for Energy and the Environment, Vol. 41_2, 215–240.
doi: 10.13052/spee1048-5236.4125
© 2022 River Publishers