Energy, Environment, and Sustainability: A Multi-criteria Evaluation of Countries
Ahmet Aytekin
Department of Business Administration, Faculty of Economics and Administrative Sciences, Artvin Çoruh University, 08100, Hopa, Artvin, Turkey
E-mail: ahmetaytekin@artvin.edu.tr
Received 27 January 2022; Accepted 07 April 2022; Publication 24 May 2022
Abstract
Energy, the environment, and sustainability are all strongly intertwined concerns. While humanity aims to spread the comfort and welfare it has achieved on a global scale, as well as to achieve more development and comfort through technological advances, it is caught in a stalemate caused by the world’s use of resources as if they are limitless, as well as irrevocable environmental damage. The major topic of this dilemma is energy. Using ARAT, CRITIC, SOWIA, CRADIS, and CODAS-Sort, this study aims to evaluate countries on the basis of energy, environment, and sustainability triangle. The results reveal that developed countries are in a better situation than developing and underdeveloped countries in terms of sustainable energy and environmental concerns. The Nordic countries notably lead the rankings and classification results. The primary reason for this is that Nordic countries have strong climate and energy policies. Given the limitations of fossil fuels, the fact that they’ll be exhausted in a few decades, and the environmental damage they cause, the development and effective use of renewable energy sources is considered a critical solution option. Because it appears that humanity will struggle to give up its existing level of comfort or lower its energy use. The importance of energy efficiency, diversification of renewable energy sources, raising societal awareness, unity in global sustainable environmental policies, aiding societies that are falling behind in achieving welfare and fighting poverty and focusing on energy savings emerge at this point. A strong will and community support will be necessary to adopt and implement these policies.
Keywords: Sustainability, energy, environment, ARAT, CRITIC, SOWIA, CRADIS, CODAS-Sort.
1 Introduction
For decades, the limitation of resources and the irreversible damage to the environment have been the subject of discussion. Humans wish to continue progressing indefinitely while benefiting from the improved living conditions brought about by technology. In this setting, we are confronted with a significant dilemma. It is becoming increasingly difficult to answer the question of whether human beings will be able to make further progress by better utilizing resources and conserving the environment. Energy and the environment are two critical components on both sides of the dilemma. The relationship between energy, the environment, and sustainable development is highlighted by the requirement for a society seeking sustainable development to ideally focus solely on energy sources that do not have negative environmental consequences [1].
As the world’s population grows, so does the demand for more energy [2]. In the context of environmental pollution and transmitting natural resources to future generations, the ever-growing global population, and the increasing energy requirements for the maintenance of technological advancements force academics, companies, and countries to look for new solutions. Environmentally friendly energy sources, such as the usage of renewable resources like water, sun, wind, biomass, geothermal, hydrogen, and fuel cells, are among the studies’ focus points [2].
One of the dimensions that will be considered, along with energy and environmental dimensions, is economic development and welfare. Development and energy are strongly interrelated. Many different indicators, such as the human development index and economic growth metrics, are used to try to measure the development of societies. Also, per capita energy consumption is regarded as a measure of a country’s wealth. The demand for energy consumption for high development is gradually increasing in developing countries. The desire to enhance energy access remains a significant motivator of poverty reduction in developing countries. Modern energy supply makes it easier to increase human living conditions and industry efficiency. It also contributes by lowering the amount of time spent on biomass collection, particularly for women and children, and thus provides an opportunity for children’s education and promoting gender equality [3]. The widespread use of fossil energy has allowed developed countries to achieve their current levels. However, it is now clear that fossil fuels or fuels with adverse environmental effects cannot be used to promote sustainable development [2, 4]. Sustainable development can be achieved through the use of renewable energy and assuring citizens’ access to inexpensive, reliable, sustainable, and contemporary energy [5]. At this point, assessing countries in terms of their energy consumption and environmental impacts will serve as critical due diligence. Countries will be assessed using a multi-criteria decision-making methodology in the context of energy and environmental data in this study. ARAT (Interval and Iterative Preference/Priority Scale) and CRITIC (Criteria Importance Through Inter-criteria Correlation) methods will be combined and used to weight the criteria in this context. In the integration phase, the SOWIA (Subjective and Objective Weight Integrated Approach) method will be employed. The countries will be ranked using the CRADIS (Compromise Ranking of Alternatives from Distance to Ideal Solution) method and be classified employing the CODAS-Sort (COmbinative Distance-based Assessment-Sort) method.
By combining subjective and objective criterion weights in the evaluation of countries based on energy, environmental, and sustainability performances, the study aims to provide a comparative analysis of countries from different perspectives. The literature on research investigating energy usage, environmental effects, and sustainability issues will be included in the following section of the study. Following that, details on the study’s methodology will be presented. The findings, conclusions, and suggestions will be given at the end of this study.
2 Literature
Energy-related technological developments, which began with the industrial revolution, are continuing to increase. The current agreement that fossil fuels are not sustainable, as well as concerns about environmental protection and resource transfer to future generations, need a thorough examination of the energy issue. The next part will go over some of the most important research on energy, the environment, and sustainability.
Dinçer and Rosen [1] concluded that energy efficiency would contribute more to sustainability than a mix of non-fossil, nuclear, and renewable energy sources in their study related to energy, environment, and sustainable development. Carbon and fuel taxes, it was noted, will continue to be a critical component of measures aimed at lowering carbon dioxide and other pollution emissions. It was suggested that governments should create incentives for consumers to use energy-efficient and ecologically friendly products.
Rees [6] stated that the global economy’s ecological footprint is greater than the planet’s capacity to absorb it, and hence humanity has reached a critical juncture. Given that one-quarter of the population lives in poverty and that population and material demands are increasing, it has been noted that ensuring sustainability requires overcoming major challenges.
Fossil fuels, according to Cook [7], will be critical in meeting the world’s energy demands soon, although natural gas will be the favored fossil fuel. Nuclear power has the potential to play a role, but it will not be able to do so in most countries unless societal attitudes shift dramatically. Cook [7] believes that the change to solar energy will have an impact on the mining industry, and that there is an implicit link between energy and minerals. Even though resource development has been at an all-time high in recent years, most countries’ exploration programs have fallen due to low commodity prices, expanding reserves, and decreasing commodity demand.
Goldemberg [8] stated that diversifying energy carriers for heat, fuel, and electricity generation, improving access to clean energy sources, balancing the use of fossil fuels, saving fossil fuels or non-renewable resources for other applications and future generations, and providing flexibility of power systems as electricity demand changes are all advantages of using renewable energy sources in a modern and effective way. The renewable energy was viewed as the main solution to reduce pollution and emissions caused by traditional energy systems, reduce reliance on imported fuels and cut costs, create new jobs, and give energy to areas that are not connected to the utility grid. It was underlined that the natural energy flow in the world’s ecosystem has significantly greater potential than the energy consumption required for human requirements.
Chappells and Shove [9] examined the detrimental effects on the environment of energy consumed for comfort via air conditioning and how these negative effects might be addressed by building design. It was suggested that communities should consider the definition of comfort and the lifestyles that go with it. Also, the importance of avoiding an unsustainable future was emphasized.
Omer [2] highlighted that buildings account for 40% of global yearly energy consumption, hence there are some recommendations for optimal building energy usage. The importance of designing more energy-efficient buildings in terms of heating, lighting, cooling, ventilation, and hot water supply was emphasized, as was switching to natural or hybrid ventilation instead of air conditioning, using renewable energy in buildings and agricultural greenhouses, and reducing reliance on fossil fuels. Furthermore, it was argued that encouraging innovative renewable practices and developing the renewable energy market will contribute to ecosystem protection by lowering emissions at both the local and global levels.
Given the predominance of energy usage, its relevance in economic development and living standards, and its impact on the environment, according to Rosen [10], energy sustainability is critical for overall sustainability. The need of using sustainable energy sources, employing sustainable energy carriers, enhancing efficiency, reducing environmental effect, and improving socioeconomic acceptability was underlined to ensure energy sustainability. Furthermore, it was suggested that the use of modern technologies such as exergy analysis for improving efficiency and life cycle analysis for reducing pollution gives considerable benefits in attempts to attain energy sustainability.
Dale and Ong [4] stated that human well-being is highly dependent on energy supply. The authors predicted that fossil fuels will become increasingly scarce and expensive, and that liquid biofuels may be a suitable option for low-cost, long-term energy. Cellulosic biomass was viewed as a possible liquid fuel source in this context.
The importance of cogeneration systems in energy savings and efficiency, as well as the analysis of gas-powered cogeneration systems, were discussed by Çakır et al. [11]. It was also claimed that employing sustainable energy will assure resource protection without having negative consequences for future generations.
Jorgenson et al. [12] looked at the energy intensity of human well-being and economic progress in Central and Eastern European countries. They asserted that nonrenewable energy and other natural resources are depleting, and that humans rely on a variety of ecosystem services to support human well-being for economic development. To promote sustainability, the energy intensity should be decreased for human well-being. The Central and Eastern European countries have transitioned from socialist command economies to market demand economies, and while human wellbeing has risen, energy intensity has dropped as energy efficiency has increased.
Dinçer and Acar [13] evaluated clean energy solutions based on a variety of sustainability factors. Nuclear energy was said to be the best option for power generation, while geothermal energy was said to be the best option for non-air pollution criteria. The initial alternatives in terms of heating and cooling modes were geothermal and biomass energies. Furthermore, nuclear power was ranked first among hydrogen-producing energy sources.
Sarkodie and Adams [14] stated that the quality of political institutions plays a significant role in social, governance, and economic preparedness to mitigate the effects of climate change. It was stated that structural adjustments in total energy consumption, economic growth, and political institutional quality all play a crucial influence in environmental quality. It was suggested that fossil fuel-rich countries should diversify their energy portfolios by adding renewable energy sources, which will promote environmental sustainability, enhance air quality, and minimize their economies’ exposure to price fluctuations. Also, it was emphasized that a paradigm shift away from energy and carbon-intensive industries and toward a service-oriented economy will result in structural economic transformation, which will aid in mitigating climate change and its effects.
Despite the incentives for renewable energy, Qazi et al. [15] claimed that the world’s reliance on fossil fuels remains high. It was emphasized that a low level of awareness is a major barrier to the adoption of renewable energy technologies. It was also claimed that integrating renewable energy sources into power generating can help relieve global energy crises.
Asongu [16] said that most African countries appear to be unable to achieve economic and environmental sustainability, as well as consistent economic growth and stable energy supply. According to the study, economic growth, urbanization, electricity use, fossil fuel energy consumption, and total natural resource rent all had an impact on pollutant emissions in Africa. Pollutant emissions and urbanization, as well as electricity consumption and non-renewable energy consumption, were all claimed to be related. It was suggested for African countries to decouple pollutant emissions from economic growth, make a paradigm shift from fossil fuels to renewables, as well as the utilization of carbon storage and capture systems.
Armin Razmjoo et al. [17] emphasized that one of the most important targets for sustainable development that can be met with renewable energy and UN-Habitat III goals is electricity generation for residential areas. The significance of renewable energy in ensuring energy sustainability was highlighted in this context.
Bekun et al. [18] investigated China’s economic growth in light of globalization, energy consumption, and environmental sustainability. Energy saving strategies are said to have a detrimental influence on economic growth, whereas energy consumption has a negative impact on the environment. Renewable energy sources such as hydro, wind, photovoltaic, and biomass energy sources should be adopted in China’s energy portfolio mix by utilizing more efficient and up-to-date energy technologies. The authors stated that the renewable energy provides the reduction of air pollution in China. Furthermore, with the establishment of renewable energy sources, it was emphasized that considerable capital is required to run the industry with little or no environmental risks. In this context, focusing on environmental policy would necessitate a strong political will and widespread public support. The government and other stakeholders should find alternative substitute solutions for energy consumption in the short term to ensure economic growth while minimizing environmental impact.
To ensure sustainability and solve resource shortages, Zhang et al. [19] underlined the necessity of remanufacturing and life cycle assessment. Remanufacturing was recognized as a cost-effective method of reducing energy and material consumption while also lowering emissions.
In their assessment of Belt and Road Initiative (BRI) countries, Shakib et al. [20] said that increases in energy consumption, economic growth, population, and foreign direct investment inflows increase CO emissions and have detrimental environmental consequences. However, it was argued that using renewable energy sources, which are cleaner than fossil fuels, and encouraging agricultural development can reduce emissions and considerably increase environmental welfare.
The concepts of energy, environment, and sustainability are interconnected, as evidenced by studies from the literature, and their profound relationships with one another are investigated from various perspectives. The impact of energy on economic growth and comfort, as well as renewable energy sources that can be used instead of fossil energy, are reviewed in these studies. This study will add to this by conducting the assessment of countries in the sustainable energy-environment dichotomy. Hence, the important criteria in the energy, environment, and sustainability spiral are expected to be determined, as well as the relative strengths and weaknesses of the countries based on comparative evaluations. To achieve these aims, multi-criteria decision-making methods such as ARAT, CRITIC, SOWIA, CRADIS, and CODAS-Sort will be used. These methods have been used in the literature to evaluate different problems. For instance, SOWIA has been used to evaluate bio-medical waste disposal methods, Indian technical institution performance, usability evaluation of live auction portal, supply chain strategy determination, and optimal site selection of electric vehicle charging station problems [21–25]. ARAT was used in studies of rental house selection and assessing countries based on citizen trust in government administration [26, 27]. The CRITIC method has been successfully applied in a variety of fields, including urban rail transit operation safety evaluation, location planning of electric vehicle charging stations, hospital site selection, evaluation of the financial performance of tourism companies, blockchain platform evaluation, and 5G industry evaluation [28–33]. CRADIS method was used to assess the markets of pear varieties, and select healthcare waste incinerators [34, 35]. CODAS-Sort was used in the examination of environment quality, province entrepreneurship classification, natural resource evaluation, and supplier selection [36–39]. ARAT, CRADIS, and CODAS-Sort are among the most recently created methods, and as a result, they are not widely used. It is believed that this aspect of the study will contribute to the literature. Also, with these methods, it is expected that a comprehensive evaluation will be obtained from various perspectives. Detailed information about the study’s methodology will be provided in the next section.
3 Methodology
Multi-criteria decision-making includes all the processes involved in evaluating multiple criteria and alternatives in the solution of decision problems. It may be able to rank, classify, eliminate, assign alternatives, or determine the weight values of the criteria at the end of this process. Multi-criteria decision-making methods ARAT, CRITIC, SOWIA, CRADIS and CODAS-Sort will be used to evaluate countries in the context of sustainability, energy, and the environment. For this purpose, ARAT and CRITIC will be used in the SOWIA integrated model to determine the weights of the criteria. CRADIS will be used to rank the countries, and CODAS-Sort will be used to classify them. The methodology employed in the study is depicted in Figure 1 in such a way that the application processes connected with the methods can be seen.

Figure 1 The scheme of methodology.
The criteria were weighted using SOWIA based on ARAT and CRITIC, as seen in Figure 1. SOWIA aims to benefit from the advantages of both objective and subjective weighting methods. CRITIC, which is based on the correlations between criteria and standard deviation, was employed for objective weighting. As a result, it is expected that the data structure will be effectively reflected in the weighing process using CRITIC. Because of its iterative evaluation process, ability to compare pair and multiple criteria, transitivity, intelligibility, and ease of use, ARAT was chosen for subjective weighting. To rank the countries, the CRADIS method will be used, which combines the benefits of the ARAS, MARCOS, and TOPSIS methods. CODAS-Sort, based on the anti-ideal solution, was chosen for the classification process because it allows for the determination of central profiles and the assignment of the class that is closest to the central profile.
The methodology used in the study ensures that the structure of the data and expert evaluations are used together by integrating the benefits of subjective and objective weighting processes in determining the criteria weight values. Furthermore, the results of ranking and classification processes will be used to perform comparative evaluations from different perspectives. The next subsections will provide explanations for SOWIA, ARAT, CRITIC, CRADIS, and CODAS-Sort methods.
3.1 SOWIA
The regulation of the important levels of the criteria on the solution of the problem by assigning values directly by the decision maker(s) or expert(s) or by values calculated by techniques created for this purpose is known as weighting. In other words, the weighting allows the effects of the criteria on the problem solution to be calibrated. In this context, objective weighting methods that consider solely the decision matrix values and subjective weighting methods that consider the evaluator’s importance levels are often used in the weighting process. There are also mixed weighting methods, which combine weight values derived using multiple methods [40–42]. In this study, CRITIC from objective methods and ARAT from subjective methods are used in the weighing process. Then, SOWIA from mixed methods will be employed to combine these two methods’ results.
Das et al. [22] developed SOWIA for combining the results of subjective and objective weighting methods. is the subjective weight value, is the objective weight value, and Equation (1) is used to calculate the integrated weight value () in SOWIA.
| (1) |
The decision maker uses the value in Equation (1) to regulate the effect of subjective-objective weight values. takes a value in the range of 0–1. In this case, demonstrates that subjective and objective weight values are given equal weight. Because of the weight values obtained using SOWIA, both objective and subjective weighing methods will be effective in solving the problem.
3.1.1 CRITIC
CRITIC is a method developed by Diakoulaki et al. [43] to weight criteria objectively by considering their correlations and standard deviations. The application of the CRITIC can be applied in four steps as explained below [43].
Step 1. Constructing the decision matrix: The decision matrix is constructed as specified in Equation (1), where the performance or attribute of alternative i in the criterion j is denoted by .
| (2) |
Step 2. Normalizing the decision matrix: Equation (3) is used to normalize the decision matrix, where denotes benefit criteria and cost criteria.
| (3) |
Step 3. Calculating the criteria’s information values: Each criterion’s correlations () with the other criteria are determined using the Pearson correlation coefficient. For criteria with ordinal measures, the Spearman rank correlation coefficient can be employed. Over the correlation values, conflict values () are determined. The amount of information of each j criterion, , is then calculated with Equation (4) using the standard deviation value () of each criterion as a contrast measure.
| (4) |
Step 4. Calculating criteria weights: The quantity of information contained in the criterion will rise as the value increases. In the final stage, the normalized values are used to calculate the weight value of each criterion, as shown in the equation Equation (5).
| (5) |
The aim of the CRITIC is to objectively reflect the importance levels of related or conflicting criteria on the solution of the problem. To put it another way, CRITIC’s fundamental assumption is that a criterion with a poor correlation with other criteria and a high variability includes more information, hence the weight value should be larger in this case.
3.1.2 ARAT
Aytekin [44] developed the Interval and Iterative Preference/Priority Scale (ARAT, as the abbreviation of the Turkish phrase “ARalıklı ve Aşamalı Tercih önem ölçeği”) to represent the preferences of decision-makers. Also, ARAT gives a proper data format for the solution of the problem by scaling the criteria in multi-criteria decision problems according to the preferences of the decision-maker or expert and determining the importance levels of the criteria.
ARAT ensures that the decision maker’s preferences for each criterion are determined iteratively. Preferences are rated from 0 to 10 on a scale that is theoretically infinitely divisible. In the first phase, the values on this scale range from 0 to 10, with 0 representing the most negative and 10 representing the most positive value. Hence, the veto value in ARAT is zero, indicating that the relevant criterion or alternative is not considered in the problem. A score of 10 denotes strong preference, whereas a score of five denotes moderate preference. Iterations are used to complete the finalization of preference-importance values. The next section summarizes the ARAT’s implementation steps for weighting the criteria [26, 27, 44].
Step 1. Defining the criteria: The criteria to be employed in solving the decision problem () are defined.
Step 2. Assigning the criteria’s initial importance values: Each criterion’s importance levels on the decision problem are represented by importance values () assigned by the decision maker. The ARAT scale with values ranging from 0 to 10 is employed for this purpose.
Step 3. Evaluating criteria by grouping them according to their previous importance levels: First, criteria with the same importance level are grouped together in this step. Then it is presented to the decision maker again to determine fractional importance values and to review the previous importance values. The important values determined in the previous step might be revised by the decision maker. The decision maker, on the other hand, may state that the importance values determined in the previous step are satisfactory for all criteria. The finalization of the important values of the criteria is completed in this scenario. Otherwise, until the decision maker is satisfied, the process of defining important values is continued in stages.
Step 4. Determination of the weight values of the criteria: Equation (6) is used to obtain the weight values of criteria, where shows the exact importance value determined for criterion j. While the weight values are in the range of 0–1, the importance levels of the criteria increase as their weights approach one.
| (6) |
The details of the CRADIS and CODAS-Sort methods to be used for sorting and classification will be described in the following sub-sections after the explanations of the methods used for the weighting process.
3.2 CRADIS
Puška et al. [35] developed the CRADIS method to solve decision problems by evaluating ideal and anti-ideal solutions. The CRADIS method is described as a combination of the ARAS, MARCOS, and TOPSIS methods. The CRADIS process steps are given below [35].
Step 1. Constructing the decision matrix: The decision matrix is constructed as specified in Equation (1).
Step 2. Normalizing the decision matrix: The 0–1 Interval Normalization Using Max-Min technique is used in the CRADIS method to conduct normalization. For this purpose, Equation (3) is used to normalize the decision matrix. If the criteria include 0 and negative values, this technique will not be able to achieve proper normalization [45]. If the decision matrix contains 0 and negative values, a transformation process will be required for the positive value decision matrix [27]. The T-score specified in Equation (7) can be employed for this purpose, where is the arithmetic mean, and is the standard deviation of the criterion .
| (7) |
If transformation is needed, and when this process has been completed, the normalized decision matrix is obtained using Equation (8). Otherwise, is used instead of in Equation (8).
| (8) |
Step 3. Weighting the normalized decision matrix: The weighted normalized decision matrix is constructed using Equation (9).
| (9) |
Step 4. Determination of ideal and anti-ideal solution vectors: Artificial solution vectors, denoting ideal and anti-ideal solutions, are formed after the weighting process, and will be used as references in the evaluation of alternatives. In this context, denotes the ideal solution, and shows the anti-ideal solution. and are obtained using Equations (10)–(11).
| (10) | ||
| (11) |
Step 5. Calculation the deviations from ideal and anti-ideal solutions: The deviations of the alternatives from the ideal solution are computed using Equation (12), and their deviations from the anti-ideal solution are determined by Equation (13).
| (12) | ||
| (13) |
Step 6. Obtaining the deviation grades of alternatives: The deviation grades are defined as the sum of the deviations of the alternatives from the ideal and anti-ideal solutions. For this purpose, Equation (14) calculates the grades of deviation of the alternatives from the ideal solution, while Equation (15) calculates the grades of deviation from the anti-ideal solution.
| (14) | ||
| (15) |
Step 7. Calculating the utility function for alternatives: Equations (16)–(17) are used to compute the grades of deviation for alternatives from optimal alternatives (), where , and .
| (16) | ||
| (17) |
Step 8. Ranking alternatives: The average deviation of the alternatives from the degree of utility () is obtained using Equation (18).
| (18) |
The alternatives are ranked according to values in descending order [35].
3.3 CODAS-Sort
Keshavarz Ghorabaee et al. [46] developed the CODAS method on the assumption that the alternative farthest from the negative ideal would be the best. Ouhibi and Frikha [47] later developed the CODAS derivative/extension CODAS-Sort, which is applicable in classification problems. The CODAS-Sort implementation steps are detailed below [37, 47].
Step 1. Constructing the decision matrix: The decision matrix is constructed as specified in Equation (1).
Step 2. Determining the classes and constructing the profile matrix for each class: The process of assigning alternatives to predetermined classes is carried out in multi-criteria sorting methods. The decision maker, expert person or group can determine the number of classes and their characteristics. Also, scientific methods can be used for this purpose. As a result, profiles for each class are determined in criteria, while classes are denoted as . According to Ouhibi and Frikha [47], the profiles can be determined using either the border or center profiles. The boundary profiles indicate the threshold values between classes, whereas the center profiles represent the general characteristic of the relevant class. If a boundary profile is employed, the alternative is assigned the class based on whether its overall assessment score exceeds or falls below the boundary profiles. If the center profile is applied, the alternative is assigned the class based on the closeness of its general evaluation score to the general evaluation scores of the profiles. In this study, center profiles were employed. After determining the number of classes, profile values for each criterion are specified. The profile matrix is presented in Equation (19), where [37].
| (19) |
Step 3. Normalizing the decision and profile matrices: The 0–1 Interval Normalization Using Max-Min technique is used in the CODAS method to conduct normalization. As stated in the CRADIS method’s implementation steps, this normalization technique does not provide effective results in decision matrices with 0 and negative values. In this case, in Equation (7), the transformation process is used to ensure that the decision and profile matrices have positive values. Assuming that the decision and profile matrices have positive values, Equations (20)–(21) are used for normalization.
| (20) | ||
| (21) |
Step 4. Weighting the decision and profile matrices: Normalized decision and profile matrices are weighted using Equations (22)–(23).
| (22) | ||
| (23) |
Step 5. Obtaining negative ideal solution values: To obtain negative ideal solutions for each criterion, values are acquired using Equation (24), whereas values are produced using Equation (25).
| (24) | ||
| (25) |
While assigning alternatives to classes, the CODAS-Sort method takes into account class profiles and anti-ideal solution values. This reduces the impact of class profiles on class assignment.
Step 6. Calculating the Euclidean and Taxicab distances: From negative ideal solution values, Equations (26)–(27) are used to determine the Euclidean () and Taxicab () distances of the alternatives, and Equations (28)–(29) are used to calculate the Euclidean () and Taxicab () distances of the profiles.
| (26) | ||
| (27) | ||
| (28) | ||
| (29) |
Step 7. Constructing the relative evaluation matrix: The relative evaluation (G) matrix is obtained using Equations (30)–(31).
| (30) | ||
| (31) |
is the threshold function in Equation (31). The function ensures that Taxicab distances are also taken into account, as a result of comparing the value with the Euclidean distance value of the profile and the alternative . Keshavarz Ghorabaee et al. [46] suggested to set the value between 0.01 and 0.05. Equation (32) defines the function.
| (32) |
Step 8. Completing the classification process: If center profiles are employed in the classification process, Equation (33) assigns alternatives to the classes.
| (33) |
Equation (33) assigns the alternative to the class whose value is the smallest in absolute value. Equation (34), on the other hand, is employed in classification when boundary profiles are used. The value used in the evaluation at this point is the smallest absolute value in the matrix, as in the center profiles.
| (34) |
Thus, the assignment of alternatives to classes is completed in CODAS-Sort.
4 Results
Data from the World Bank, UN and EPI were used to evaluate countries in terms of sustainable energy and the environment [48–50]. The values acquired from the objective and subjective weighting methods were combined with SOWIA in the criteria weighting. In the subjective criteria weighting using ARAT, the evaluations of two experts were obtained. Table 1 displays the importance ratings of criteria determined by the experts and the subjective weight values using ARAT, the weight values derived by CRITIC, and the final weight values provided by SOWIA.
Table 1 The weights of criteria
| ARAT Importance Ratings | Weights | |||||
| Notation | Criteria | Expert 1 | Expert 2 | ARAT | CRITIC | SOWIA |
| C1 | Access to electricity | 7.4311 | 6.1 | 0.0407 | 0.0459 | 0.0433 |
| C2 | Adjusted savings: energy depletion | 8.4211 | 9 | 0.0526 | 0.0512 | 0.0519 |
| C3 | CO2 emissions from gaseous fuel consumption | 5.3221 | 5.2 | 0.0318 | 0.0495 | 0.0407 |
| C4 | CO2 emissions from liquid fuel consumption | 7.1312 | 7.1 | 0.0430 | 0.0495 | 0.0462 |
| C5 | Fuel exports | 8.3422 | 8.2 | 0.0500 | 0.0487 | 0.0494 |
| C6 | Fuel imports | 7.5421 | 8.8 | 0.0492 | 0.0452 | 0.0472 |
| C7 | Methane emissions in energy sector | 7.4122 | 7.9 | 0.0462 | 0.0491 | 0.0477 |
| C8 | Nitrous oxide emissions in energy sector | 8.2212 | 9 | 0.0520 | 0.0483 | 0.0501 |
| C9 | Pump price for diesel fuel | 8.2311 | 7 | 0.0459 | 0.0531 | 0.0495 |
| C10 | Pump price for gasoline | 7.2411 | 7.2 | 0.0436 | 0.0540 | 0.0488 |
| C11 | Renewable energy consumption | 8.2111 | 7.1 | 0.0461 | 0.0516 | 0.0488 |
| C12 | Time required to get electricity | 8.2112 | 8.2 | 0.0496 | 0.0467 | 0.0481 |
| C13 | Energy supply | 7.6212 | 7.9 | 0.0469 | 0.0527 | 0.0498 |
| C14 | Contribution of renewables to electricity production | 9.3211 | 9.4 | 0.0566 | 0.0449 | 0.0507 |
| C15 | Renewable electricity production | 8.6211 | 7.9 | 0.0499 | 0.0453 | 0.0476 |
| C16 | Environmental performance | 7.4211 | 8.2 | 0.0471 | 0.0428 | 0.0450 |
| C17 | Air quality | 8.6112 | 9.8 | 0.0555 | 0.0425 | 0.0490 |
| C18 | Ozone exposure | 7.7112 | 7.9 | 0.0472 | 0.0427 | 0.0449 |
| C19 | Waste management | 6.2211 | 9.4 | 0.0462 | 0.0436 | 0.0449 |
| C20 | Biodiversity habitat index | 9.11 | 7 | 0.0482 | 0.0486 | 0.0484 |
| C21 | Climate change | 9.31 | 7.9 | 0.0518 | 0.0441 | 0.0480 |
C3, C4, C5, C6, C7, C8, C9, C10, C12 are cost criteria, while the others are benefit-oriented. The expert evaluations were integrated by the geometric mean during weighting process performed using ARAT. Table 1 demonstrates that C14 is the most important criterion as a result of subjective weighting, while C10 is the most important criterion as a result of objective weighting. The most important criterion, according to the weight values obtained by determining with SOWIA, is C2. C14 is the second most important criterion, and C10 is the ninth most important criterion according to SOWIA results. The ratio of the value of the stock of energy resources to the remaining reserve lifetime is known as energy depletion (capped at 25 years). It is relevant to coal, crude oil, and natural gas [50]. In this context, the designation of the C2 criterion as the most important criterion shows the importance of the remaining resources for long-term energy and environmental sustainability. C14, the second most important criterion, indicates the beneficial influence of renewable energy over environmentally hazardous and unsustainable energy sources.
The class profiles to divide countries into high (S1), medium (S2), and poor (S3) classes in terms of sustainable environment and energy were determined using the formulas as given below.
Table 2 shows the center profile values for each class.
Table 2 The central profiles for classes
| C1 | C2 (Million USD) | C3 | C4 | C5 | C6 | C7 | |
| 95,6 | 114329,1 | 5,6 | 106634,9 | 5 | 2,2 | 36979 | |
| 77,8 | 90259,8 | 28,2 | 531986,4 | 25 | 9,5 | 184895 | |
| 15,5 | 6017,3 | 107,1 | 2020716,5 | 95 | 34,7 | 702601 | |
| C8 | C9 | C10 | C11 | C12 | C13 | C14 | |
| 2373 | 0,2 | 0,3 | 91,6 | 29,2 | 117418,5 | 95 | |
| 11865 | 0,6 | 0,6 | 72,3 | 117,8 | 92700,5 | 75 | |
| 45087 | 2,0 | 1,7 | 4,8 | 427,9 | 6187,5 | 5 | |
| C15 | C16 | C17 | C18 | C19 | C20 | C21 | |
| 95 | 79,6 | 94,4 | 75,5 | 95 | 79,8 | 90,9 | |
| 75 | 68,2 | 76,6 | 59,6 | 75 | 69,4 | 74,3 | |
| 5 | 28,0 | 14,3 | 4,0 | 5 | 33,0 | 16,2 |
In the analyzes performed with CRADIS and CODAS-Sort, Equation (7) was employed to construct a positive-valued decision matrix. Table 3 shows the rankings acquired using CRADIS and the classes obtained with CODAS-Sort.
Table 3 Ranking and classification results
| Code | Country | Ranking | Class | Code | Country | Ranking | Class | Code | Country | Ranking | Class |
| A1 | Afghanistan | 120 | S2 | A47 | France | 29 | S2 | A93 | New Zealand | 7 | S2 |
| A2 | Albania | 27 | S2 | A48 | Gambia | 132 | S2 | A94 | Nicaragua | 49 | S2 |
| A3 | Algeria | 45 | S2 | A49 | Georgia | 58 | S2 | A95 | Niger | 121 | S2 |
| A4 | Angola | 109 | S2 | A50 | Germany | 31 | S2 | A96 | Nigeria | 133 | S2 |
| A5 | Argentina | 64 | S2 | A51 | Ghana | 114 | S2 | A97 | North Macedonia | 41 | S2 |
| A6 | Armenia | 116 | S2 | A52 | Greece | 72 | S2 | A98 | Norway | 2 | S1 |
| A7 | Australia | 18 | S1 | A53 | Guatemala | 33 | S2 | A99 | Oman | 102 | S2 |
| A8 | Austria | 8 | S2 | A54 | Guinea | 122 | S3 | A100 | Pakistan | 129 | S2 |
| A9 | Azerbaijan | 119 | S2 | A55 | Honduras | 53 | S2 | A101 | Panama | 12 | S2 |
| A10 | Bahrain | 98 | S2 | A56 | Hungary | 110 | S2 | A102 | Paraguay | 17 | S2 |
| A11 | Bangladesh | 137 | S2 | A57 | Iceland | 1 | S1 | A103 | Peru | 36 | S2 |
| A12 | Belarus | 79 | S2 | A58 | India | 138 | S2 | A104 | Philippines | 54 | S2 |
| A13 | Belgium | 66 | S2 | A59 | Indonesia | 88 | S2 | A105 | Poland | 61 | S2 |
| A14 | Belize | 52 | S2 | A60 | Iran, Islamic Rep. | 95 | S2 | A106 | Portugal | 34 | S2 |
| A15 | Benin | 131 | S3 | A61 | Iraq | 125 | S2 | A107 | Qatar | 89 | S2 |
| A16 | Bolivia | 86 | S2 | A62 | Ireland | 22 | S2 | A108 | Romania | 39 | S2 |
| A17 | Bosnia and Herzegovina | 68 | S2 | A63 | Israel | 97 | S2 | A109 | Russian Federation | 40 | S2 |
| A18 | Botswana | 105 | S2 | A64 | Italy | 71 | S2 | A110 | Rwanda | 111 | S3 |
| A19 | Brazil | 42 | S2 | A65 | Jamaica | 107 | S2 | A111 | Saudi Arabia | 28 | S2 |
| A20 | Brunei Darussalam | 65 | S2 | A66 | Japan | 46 | S2 | A112 | Senegal | 136 | S2 |
| A21 | Bulgaria | 92 | S2 | A67 | Jordan | 56 | S2 | A113 | Serbia | 93 | S2 |
| A22 | Burkina Faso | 134 | S2 | A68 | Kazakhstan | 94 | S2 | A114 | Sierra Leone | 87 | S3 |
| A23 | Burundi | 130 | S3 | A69 | Kenya | 57 | S2 | A115 | Singapore | 69 | S2 |
| A24 | Cambodia | 100 | S2 | A70 | Korea, Rep. | 63 | S2 | A116 | Slovak Republic | 47 | S2 |
| A25 | Cameroon | 104 | S2 | A71 | Kuwait | 44 | S2 | A117 | Slovenia | 23 | S2 |
| A26 | Canada | 11 | S1 | A72 | Kyrgyz Republic | 38 | S2 | A118 | South Africa | 101 | S2 |
| A27 | Central African Republic | 117 | S2 | A73 | Lao PDR | 84 | S2 | A119 | Spain | 50 | S2 |
| A28 | Chile | 21 | S2 | A74 | Latvia | 20 | S2 | A120 | Sri Lanka | 78 | S2 |
| A29 | China | 124 | S2 | A75 | Lebanon | 96 | S2 | A121 | Sudan | 75 | S2 |
| A30 | Colombia | 14 | S2 | A76 | Lesotho | 76 | S2 | A122 | Sweden | 3 | S1 |
| A31 | Congo, Dem. Rep. | 43 | S2 | A77 | Lithuania | 19 | S2 | A123 | Switzerland | 6 | S2 |
| A32 | Congo, Rep. | 118 | S2 | A78 | Luxembourg | 5 | S2 | A124 | Tajikistan | 51 | S2 |
| A33 | Costa Rica | 9 | S2 | A79 | Madagascar | 128 | S2 | A125 | Thailand | 90 | S2 |
| A34 | Cote d’Ivoire | 135 | S2 | A80 | Malawi | 83 | S2 | A126 | Timor-Leste | 127 | S2 |
| A35 | Croatia | 35 | S2 | A81 | Malaysia | 30 | S2 | A127 | Tunisia | 82 | S2 |
| A36 | Cyprus | 99 | S2 | A82 | Mali | 115 | S2 | A128 | Turkey | 103 | S2 |
| A37 | Czech Republic | 32 | S2 | A83 | Malta | 70 | S2 | A129 | Uganda | 62 | S2 |
| A38 | Denmark | 10 | S2 | A84 | Mexico | 67 | S2 | A130 | Ukraine | 108 | S2 |
| A39 | Dominican Republic | 85 | S2 | A85 | Mongolia | 126 | S2 | A131 | United Arab Emirates | 112 | S2 |
| A40 | Ecuador | 15 | S2 | A86 | Montenegro | 59 | S2 | A132 | United Kingdom | 26 | S1 |
| A41 | Egypt, Arab Rep. | 48 | S2 | A87 | Morocco | 91 | S2 | A133 | United States | 80 | S2 |
| A42 | El Salvador | 25 | S2 | A88 | Mozambique | 74 | S2 | A134 | Uruguay | 16 | S2 |
| A43 | Estonia | 13 | S2 | A89 | Myanmar | 113 | S2 | A135 | Uzbekistan | 123 | S2 |
| A44 | Ethiopia | 81 | S2 | A90 | Namibia | 24 | S2 | A136 | Vietnam | 55 | S2 |
| A45 | Fiji | 37 | S2 | A91 | Nepal | 60 | S2 | A137 | Zambia | 77 | S2 |
| A46 | Finland | 4 | S1 | A92 | Netherlands | 73 | S2 | A138 | Zimbabwe | 106 | S2 |
Australia, Canada, Finland, Iceland, Norway, Sweden, and United Kingdom are the countries in the higher sustainable environment-energy class (S1), as seen in Table 3. Benin, Burundi, Guinea, Rwanda, and Sierra Leone are the countries in the low-energy-sustainable-environment class (S3). Other countries are classified as having a medium level of environmental and energy sustainability (S2). According to the CRADIS results, Iceland, Norway, and Sweden are ranked first, second, and third, respectively, whereas India, Bangladesh, and Senegal are ranked in the last three places.
In terms of sustainable energy and environmental standards, the results show that developed countries are in a better situation than developing and underdeveloped countries. This finding is consistent with literature [12, 14, 16, 20, 51–58]. The Nordic countries are obviously at the top of the rankings and classification results. The main reason for this is that Nordic countries have implemented effective climate and energy policies. Denmark is a pioneer in the usage of wind power, bioenergy in Finland and Sweden, hydropower in Norway, and geothermal energy in Iceland. By 2050, the Nordic countries want to be ”fossil-free”. Also, Nordic countries implement solid regulations in the areas of power, heating, and building decarbonization [57, 58]. Carbon pricing or tax has been in place for about two decades in Australia, the United Kingdom, and Canada, among the most prominent countries in the results. Furthermore, these countries pursue policies related to energy efficiency, clean technology innovation, electricity market reform, and clean technology industry support [54]. In comparison to other countries, Benin, Burundi, Rwanda, Sierra Leone, and Senegal performed low. The fact that these countries are all from Sub-Saharan Africa is the most common characteristic they share. Although it has been said that energy consumption plays an important role in increasing both economic growth and financial development in Sub-Saharan African countries, excessive pollution has been noticed as a result [52]. The fact that more than two-thirds of the population is not connected to the electricity system, has limited access to natural gas, and has a low share of renewable energy in the total energy supply are all factors contributing to Bangladesh’s poor performance [51]. With its reliance of coal-based energy, India is one of the world’s major producers of greenhouse gas emissions among the poor performing countries [55].
While tackling climate change has become a central subject of many policy initiatives, European Union (EU) member states are working hard to meet their emission goals [53]. The reduction in carbon dioxide emissions in industrialized countries is related to a paradigm shift and structural transformation from high energy-intensive and carbon-intensive industries to service and information-intensive economy. Agriculture, transportation, and services, according to Sarkodie and Strezov [56], are driving up CO emissions in developing and least developing countries. Also, because environmental policies and regulations in emerging and underdeveloped countries are weaker than in developed countries, nonrenewable energy resources and carbon-intensive sectors are allowed to spread. In developed countries, increased awareness of environmental sustainability, technological advancement, and strong environmental rules and policies result in a reduction in the use of nonrenewable energy resources and carbon dioxide emissions [56].
The results implicitly show that the Kuznets curve may be valid on a global scale. According to the Kuznets curve, environmental pollution increases when economic growth increases initially. After a certain threshold value, the increase in the level of economic development also provides an increase in environmental awareness, and thus environmental pollution begins to decrease [59]. On the other hand, in this era of climate change, new ways that are both sustainable and environmentally friendly are required for the development, and welfare of developing and underdeveloped countries. Decision-makers in developing and underdeveloped countries should prioritize energy efficiency, renewable energy and nuclear energy investments and research, as well as policies that promote economic development. According to experts, the growth of renewable and nuclear energy sources would assist meet industrialization’s energy needs while also reducing pollution [60].
4.1 Validation of Results
The validity and reliability of the solution to the decision problem, which is the subject of the study, will be examined using a comparative sensitivity analysis. Sensitivity analysis explores how the solution to a decision problem changes as the parameters or model inputs change. The decision maker can use sensitivity analysis to determine which parameter, data, and component in the decision problem is functional or critical to the solution. As a result, he has the option of changing his preferences or judgments throughout the problem-solving process [61, 62]. In this context, the consequences of changing the weights of criteria on ranking and classification results and the solutions acquired by other methods compared to the study’s methodology are investigated. Twenty different sets were created to investigate the effects of criteria weight changes. As shown in Table 4, these sets were created by taking the weight values of the other criteria only once for each criterion.
Table 4 Changing criteria weights for sensitivity analysis
| C1 | C2 | C3 | C4 | C5 | C6 | C7 | C8 | C9 | C10 | C11 | C12 | C13 | C14 | C15 | C16 | C17 | C18 | C19 | C20 | C21 | |
| SET 0 | 0,0433 | 0,0519 | 0,0407 | 0,0462 | 0,0494 | 0,0472 | 0,0477 | 0,0501 | 0,0495 | 0,0488 | 0,0488 | 0,0481 | 0,0498 | 0,0507 | 0,0476 | 0,0450 | 0,0490 | 0,0449 | 0,0449 | 0,0484 | 0,0480 |
| SET 1 | 0,0519 | 0,0407 | 0,0462 | 0,0494 | 0,0472 | 0,0477 | 0,0501 | 0,0495 | 0,0488 | 0,0488 | 0,0481 | 0,0498 | 0,0507 | 0,0476 | 0,0450 | 0,0490 | 0,0449 | 0,0449 | 0,0484 | 0,0480 | 0,0433 |
| SET 2 | 0,0407 | 0,0462 | 0,0494 | 0,0472 | 0,0477 | 0,0501 | 0,0495 | 0,0488 | 0,0488 | 0,0481 | 0,0498 | 0,0507 | 0,0476 | 0,0450 | 0,0490 | 0,0449 | 0,0449 | 0,0484 | 0,0480 | 0,0433 | 0,0519 |
| SET 3 | 0,0462 | 0,0494 | 0,0472 | 0,0477 | 0,0501 | 0,0495 | 0,0488 | 0,0488 | 0,0481 | 0,0498 | 0,0507 | 0,0476 | 0,0450 | 0,0490 | 0,0449 | 0,0449 | 0,0484 | 0,0480 | 0,0433 | 0,0519 | 0,0407 |
| SET 4 | 0,0494 | 0,0472 | 0,0477 | 0,0501 | 0,0495 | 0,0488 | 0,0488 | 0,0481 | 0,0498 | 0,0507 | 0,0476 | 0,0450 | 0,0490 | 0,0449 | 0,0449 | 0,0484 | 0,0480 | 0,0433 | 0,0519 | 0,0407 | 0,0462 |
| SET 5 | 0,0472 | 0,0477 | 0,0501 | 0,0495 | 0,0488 | 0,0488 | 0,0481 | 0,0498 | 0,0507 | 0,0476 | 0,0450 | 0,0490 | 0,0449 | 0,0449 | 0,0484 | 0,0480 | 0,0433 | 0,0519 | 0,0407 | 0,0462 | 0,0494 |
| SET 6 | 0,0477 | 0,0501 | 0,0495 | 0,0488 | 0,0488 | 0,0481 | 0,0498 | 0,0507 | 0,0476 | 0,0450 | 0,0490 | 0,0449 | 0,0449 | 0,0484 | 0,0480 | 0,0433 | 0,0519 | 0,0407 | 0,0462 | 0,0494 | 0,0472 |
| SET 7 | 0,0501 | 0,0495 | 0,0488 | 0,0488 | 0,0481 | 0,0498 | 0,0507 | 0,0476 | 0,0450 | 0,0490 | 0,0449 | 0,0449 | 0,0484 | 0,0480 | 0,0433 | 0,0519 | 0,0407 | 0,0462 | 0,0494 | 0,0472 | 0,0477 |
| SET 8 | 0,0495 | 0,0488 | 0,0488 | 0,0481 | 0,0498 | 0,0507 | 0,0476 | 0,0450 | 0,0490 | 0,0449 | 0,0449 | 0,0484 | 0,0480 | 0,0433 | 0,0519 | 0,0407 | 0,0462 | 0,0494 | 0,0472 | 0,0477 | 0,0501 |
| SET 9 | 0,0488 | 0,0488 | 0,0481 | 0,0498 | 0,0507 | 0,0476 | 0,0450 | 0,0490 | 0,0449 | 0,0449 | 0,0484 | 0,0480 | 0,0433 | 0,0519 | 0,0407 | 0,0462 | 0,0494 | 0,0472 | 0,0477 | 0,0501 | 0,0495 |
| SET 10 | 0,0488 | 0,0481 | 0,0498 | 0,0507 | 0,0476 | 0,0450 | 0,0490 | 0,0449 | 0,0449 | 0,0484 | 0,0480 | 0,0433 | 0,0519 | 0,0407 | 0,0462 | 0,0494 | 0,0472 | 0,0477 | 0,0501 | 0,0495 | 0,0488 |
| SET 11 | 0,0481 | 0,0498 | 0,0507 | 0,0476 | 0,0450 | 0,0490 | 0,0449 | 0,0449 | 0,0484 | 0,0480 | 0,0433 | 0,0519 | 0,0407 | 0,0462 | 0,0494 | 0,0472 | 0,0477 | 0,0501 | 0,0495 | 0,0488 | 0,0488 |
| SET 12 | 0,0498 | 0,0507 | 0,0476 | 0,0450 | 0,0490 | 0,0449 | 0,0449 | 0,0484 | 0,0480 | 0,0433 | 0,0519 | 0,0407 | 0,0462 | 0,0494 | 0,0472 | 0,0477 | 0,0501 | 0,0495 | 0,0488 | 0,0488 | 0,0481 |
| SET 13 | 0,0507 | 0,0476 | 0,0450 | 0,0490 | 0,0449 | 0,0449 | 0,0484 | 0,0480 | 0,0433 | 0,0519 | 0,0407 | 0,0462 | 0,0494 | 0,0472 | 0,0477 | 0,0501 | 0,0495 | 0,0488 | 0,0488 | 0,0481 | 0,0498 |
| SET 14 | 0,0476 | 0,0450 | 0,0490 | 0,0449 | 0,0449 | 0,0484 | 0,0480 | 0,0433 | 0,0519 | 0,0407 | 0,0462 | 0,0494 | 0,0472 | 0,0477 | 0,0501 | 0,0495 | 0,0488 | 0,0488 | 0,0481 | 0,0498 | 0,0507 |
| SET 15 | 0,0450 | 0,0490 | 0,0449 | 0,0449 | 0,0484 | 0,0480 | 0,0433 | 0,0519 | 0,0407 | 0,0462 | 0,0494 | 0,0472 | 0,0477 | 0,0501 | 0,0495 | 0,0488 | 0,0488 | 0,0481 | 0,0498 | 0,0507 | 0,0476 |
| SET 16 | 0,0490 | 0,0449 | 0,0449 | 0,0484 | 0,0480 | 0,0433 | 0,0519 | 0,0407 | 0,0462 | 0,0494 | 0,0472 | 0,0477 | 0,0501 | 0,0495 | 0,0488 | 0,0488 | 0,0481 | 0,0498 | 0,0507 | 0,0476 | 0,0450 |
| SET 17 | 0,0449 | 0,0449 | 0,0484 | 0,0480 | 0,0433 | 0,0519 | 0,0407 | 0,0462 | 0,0494 | 0,0472 | 0,0477 | 0,0501 | 0,0495 | 0,0488 | 0,0488 | 0,0481 | 0,0498 | 0,0507 | 0,0476 | 0,0450 | 0,0490 |
| SET 18 | 0,0449 | 0,0484 | 0,0480 | 0,0433 | 0,0519 | 0,0407 | 0,0462 | 0,0494 | 0,0472 | 0,0477 | 0,0501 | 0,0495 | 0,0488 | 0,0488 | 0,0481 | 0,0498 | 0,0507 | 0,0476 | 0,0450 | 0,0490 | 0,0449 |
| SET 19 | 0,0484 | 0,0480 | 0,0433 | 0,0519 | 0,0407 | 0,0462 | 0,0494 | 0,0472 | 0,0477 | 0,0501 | 0,0495 | 0,0488 | 0,0488 | 0,0481 | 0,0498 | 0,0507 | 0,0476 | 0,0450 | 0,0490 | 0,0449 | 0,0449 |
| SET 20 | 0,0480 | 0,0433 | 0,0519 | 0,0407 | 0,0462 | 0,0494 | 0,0472 | 0,0477 | 0,0501 | 0,0495 | 0,0488 | 0,0488 | 0,0481 | 0,0498 | 0,0507 | 0,0476 | 0,0450 | 0,0490 | 0,0449 | 0,0449 | 0,0484 |
The original weight values obtained in this study are represented by Set 0 in Table 4. Changing the criteria weighting coefficients had no effect on the CODAS-Sort results.Consequently, the CODAS-Sort results can be described as stable and reliable. Figure 2 depicts the variations of the results obtained using CRADIS based on changing the criteria weight coefficients in the analysis carried out in the context of the ranking results.
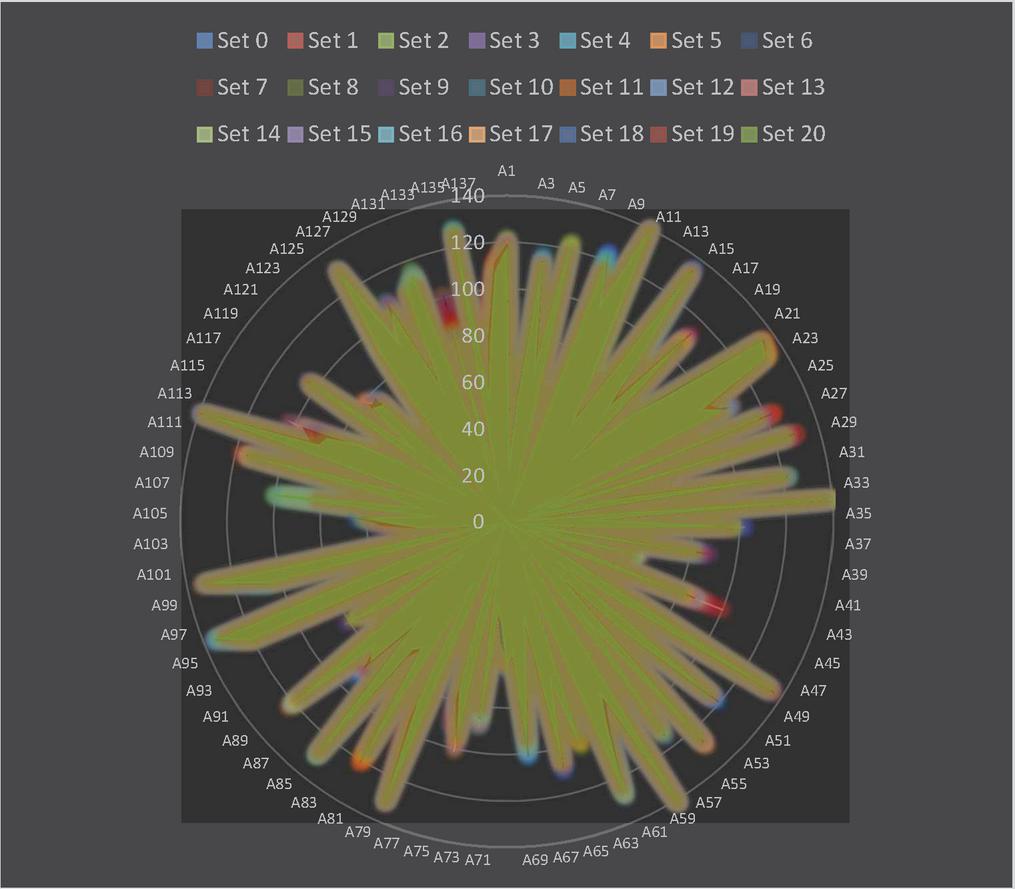
Figure 2 The effect of changing the criteria weighting coefficients on the CRADIS ranking results.
The different colours of the rays in Figure 2 represent the ranking differences of alternatives between the sets. In this context, it is clear to say that, in general, set changes do not have a significant impact on the rankings of the alternatives. Also, Set 0 has a strong rank connection with the Set 1–20 (). The results show that the CRADIS method is consistent across changes in set of criteria weight coefficients.
By conducting classification and ranking operations using different methods, the validity and reliability of the solutions obtained by the CODAS-Sort and CRADIS methods were investigated. The TOPSIS-Sort-C [63, 64] method was used in the classification process, which allows for the employment of central profiles. As a result, all countries were assigned to the S2 class via the TOPSIS-Sort-C method. CODAS-Sort, in this context, can be said to provide a more effective classification for the decision problem solved in this study. The ranking results obtained via CRADIS were compared to the ARAS [65], MARCOS [66], TOPSIS [67] methods on which the CRADIS method is based, as well as the integrated structured CoCoSo [68] and WASPAS [69] methods, as part of a comparative sensitivity analysis. In CoCoSo and WASPAS applications, the parameter is set to 0.5. Figure 3 illustrates the results obtained.
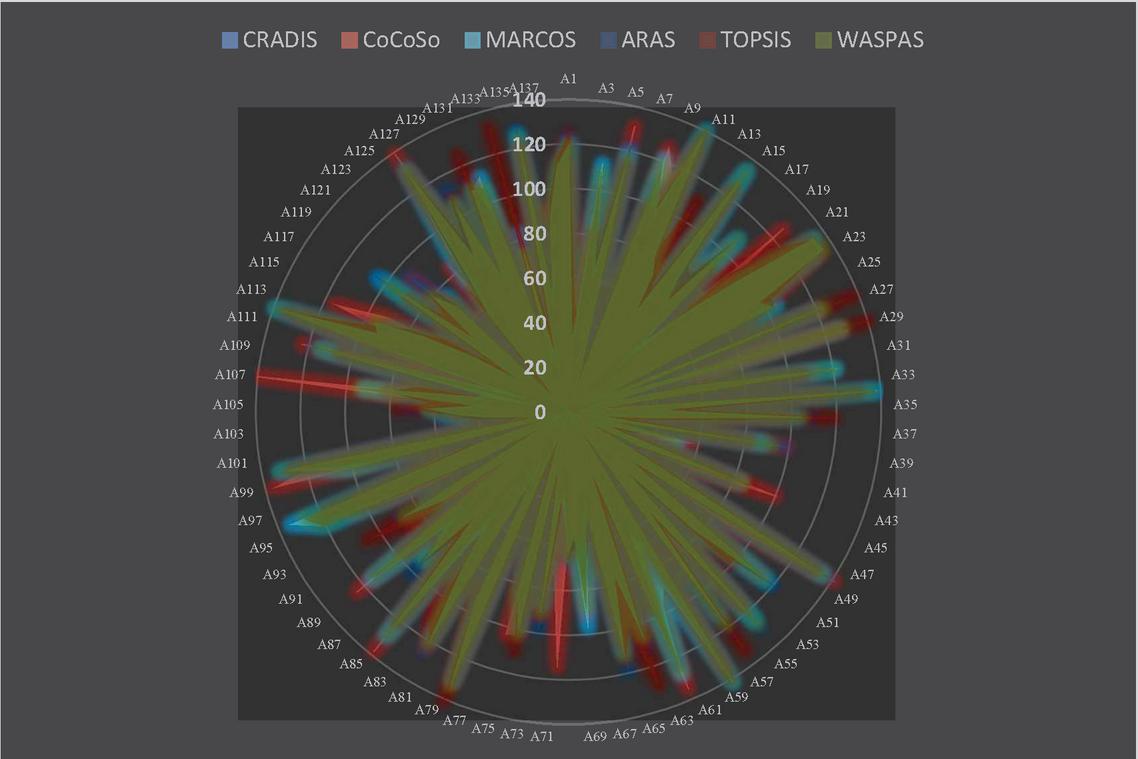
Figure 3 Comparative analysis of ranking results using different methods and CRADIS.
Figure 3, which depicts the ranking results, indicates the validity of the rankings obtained by CRADIS. As seen in Figure 3, CoCoSo produced slightly different results from the other methods. The rank correlation coefficients of the methods also shed light on the similarity and validity of the rankings. As a result, the CRADIS method results has strong rank coefficients with CoCoSo (), WASPAS (), MARCOS (), ARAS (), TOPSIS () ranking results. The ranking results obtained with CRADIS are valid and reliable for the nature of the problem.
5 Conclusions
Energy, environment, and sustainability are all interconnected concepts that are deeply intertwined. In fact, it is necessary to look at energy and sustainability policies for the protection of the environment, environmental impact and sustainability for energy efficiency, and environmental impact and use of energy for sustainability. In this context, the study used MCDM methodology to evaluate countries within the energy, environment, and sustainability triangle.
The CODAS-Sort classification results revealed that the majority of the countries performed similarly. However, Nordic countries Sweden, Finland, Iceland, and Norway, as well as Commonwealth countries Australia, Canada, and the United Kingdom, outperformed the rest of the world. These countries’ success can be attributed to strong environmental protection and renewable energy policies. Countries and regions such as Sub-Saharan Africa, Bangladesh, and India, on the other hand, are negatively differentiated due to a lack of infrastructure and a reliance on nonrenewable energy. The CRADIS results generally correlate with the CODAS-Sort results. Nordic countries placed first on the ranking obtained using CRADIS. In general, the results indicate that developed and wealthy countries differed from the rest of the world in a positive way. Examining top countries’ policies and practices can assist underdeveloped and developing countries in identifying and resolving their problems in this context. Furthermore, important lessons must be drawn, particularly for developing countries, from waste of resources, low productivity, a lack of innovation, inadequate infrastructure, a lack of awareness, and political instability in countries that performed poorly in terms of the criteria and within the period considered.
While humanity seeks to spread the comfort and welfare it has achieved on a global scale, to achieve more development and comfort through technological advances, it is locked in a stalemate caused by the world’s use of resources as if they are limitless, as well as irrecoverable environmental damage. The main subject of this dilemma is energy. In the last few centuries, fossil fuels or nonrenewable source have primarily been used for energy. Considering the limitation of fossil fuels, the fact that they will be depleted in a few decades, and the environmental damage they do, the development and effective use of renewable energy sources is viewed as a key solution option. Because humanity will find it difficult to give up its current level of comfort or reduce its energy consumption. At this point, the importance of energy efficiency, diversification of renewable energy sources, raising societal awareness, unity in global sustainable environmental policies, providing assistance to societies that are falling behind in achieving welfare and fighting poverty, and focusing on energy savings emerges. To establish and implement the aforementioned policies, strong will and community support will be required.
The study is limited to the period, countries and data examined. However, more research into the numerous dimensions and effects of sustainability is required. Future research may focus on specific renewable energy sources and assess their effects on the environment, sustainability, and welfare. In-depth research in the context of regions or a specific geographic location will also be beneficial. The comparative analysis results, on the other hand, show that the study’s methods can be successfully implemented in a variety of fields.
List of Notations and Abbreviations
| ARAS | Additive Ratio Assessment |
| ARAT | Interval and Iterative Preference/Priority Scale |
| BRI | Belt and Road Initiative |
| CoCoSo | Combined Compromise Solution |
| CODAS-Sort | Combinative Distance-based Assessment |
| CRADIS | Compromise Ranking of Alternatives from Distance to Ideal Solution |
| CRITIC | Criteria Importance Through Inter-criteria Correlation |
| MARCOS | Measurement of alternatives and ranking according to Compromise solution |
| SOWIA | Subjective and Objective Weight Integrated Approach |
| TOPSIS | Technique for Order Preference by Similarity to Ideal Solution |
| WASPAS | The Weighted Aggregated Sum Product ASsessment |
References
[1] Dincer I, Rosen MA. Energy, environment and sustainable development. Appl Energy 1999; 64: 427–440.
[2] Omer AM. Energy, environment and sustainable development. Renew Sustain Energy Rev 2008; 12: 2265–2300.
[3] Thiam DR. Renewable energy, poverty alleviation and developing nations: Evidence from Senegal. J Energy South Afr 2011; 22: 23–34.
[4] Dale BE, Ong RG. Energy, wealth, and human development: why and how biomass pretreatment research must improve. Biotechnol Prog 2012; 28: 893–898.
[5] Majid MA. Renewable energy for sustainable development in India: current status, future prospects, challenges, employment, and investment opportunities. Energy Sustain Soc 2020; 10: 1–36.
[6] Rees WE. Achieving sustainability: reform or transformation? J Plan Lit 1995; 9: 343–361.
[7] Cook PJ. Sustainability and nonrenewable resources. Environ Geosci 1999; 6: 185–190.
[8] Goldemberg J. World energy assessment. Energy and the challenge of sustainability.
[9] Chappells H, Shove E. Debating the future of comfort: environmental sustainability, energy consumption and the indoor environment. Build Res Inf 2005; 33: 32–40.
[10] Rosen MA. Energy sustainability: A pragmatic approach and illustrations. Sustainability 2009; 1: 55–80.
[11] Çakır S. An integrated approach to machine selection problem using fuzzy SMART-fuzzy weighted axiomatic design. J Intell Manuf 2018; 29: 1433–1445.
[12] Jorgenson AK, Alekseyko A, Giedraitis V. Energy consumption, human well-being and economic development in central and eastern European nations: A cautionary tale of sustainability. Energy Policy 2014; 66: 419–427.
[13] Dincer I, Acar C. A review on clean energy solutions for better sustainability. Int J Energy Res 2015; 39: 585–606.
[14] Sarkodie SA, Adams S. Renewable energy, nuclear energy, and environmental pollution: accounting for political institutional quality in South Africa. Sci Total Environ. Epub ahead of print 2018. DOI: https://doi.org/10.1016/j.scitotenv.2018.06.320.
[15] Qazi A, Hussain F, Rahim NA, et al. Towards sustainable energy: a systematic review of renewable energy sources, technologies, and public opinions. IEEE Access 2019; 7: 63837–63851.
[16] Asongu SA, Agboola MO, Alola AA, et al. The criticality of growth, urbanization, electricity and fossil fuel consumption to environment sustainability in Africa. Sci Total Environ 2020; 712: 136376.
[17] Armin Razmjoo A, Sumper A, Davarpanah A. Energy sustainability analysis based on SDGs for developing countries. Energy Sources Part Recovery Util Environ Eff 2020; 42: 1041–1056.
[18] Bekun FV, Yalçiner K, Etokakpan MU, et al. Renewed evidence of environmental sustainability from globalization and energy consumption over economic growth in China. Environ Sci Pollut Res 2020; 27: 29644–29658.
[19] Zhang X, Zhang M, Zhang H, et al. A review on energy, environment and economic assessment in remanufacturing based on life cycle assessment method. J Clean Prod 2020; 255: 120160.
[20] Shakib M, Yumei H, Rauf A, et al. Revisiting the energy-economy-environment relationships for attaining environmental sustainability: evidence from Belt and Road Initiative countries. Environ Sci Pollut Res 2021; 1–18.
[21] Narayanamoorthy S, Annapoorani V, Kang D, et al. A novel assessment of bio-medical waste disposal methods using integrating weighting approach and hesitant fuzzy MOOSRA. J Clean Prod 2020; 275: 122587.
[22] Das MC, Sarkar B, Ray S. On the performance of Indian technical institutions: a combined SOWIA-MOORA approach. Opsearch 2013; 50: 319–333.
[23] Gupta D, Ahlawat A. Usability evaluation of live auction portal. Int J Control Theory Appl 2016; 9: 491–499.
[24] Sreekumar V, Rajmohan M. Supply chain strategy decisions for sustainable development using an integrated multi-criteria decision-making approach. Sustain Dev 2019; 27: 50–60.
[25] Mishra AR, Rani P, Saha A. Single-valued neutrosophic similarity measure-based additive ratio assessment framework for optimal site selection of electric vehicle charging station. Int J Intell Syst 2021; 36: 5573–5604.
[26] Gündoğdu HG, Aytekin A. Vatandaşların kamu yönetimine güveni: Ampirik bir araştırma. İktisadi ve İdari Bilim Teori ve Araştırmalar II 2020; 1: 297–338. https://doi.org/10.6084/m9.figshare.16652002.v2
[27] Aytekin A, Durucasu H. Çok kriterli karar problemlerine yönelik yeni bir ölçek: Aralıklı ve aşamalı tercih-önem ölçeği. In: Sosyal ve Beşerî Bilimlerde Teori ve Araştırmalar. Ankara: Gece Kitaplığı, 2020, pp. 453–474. https://doi.org/10.6084/m9.figshare.16651900.v1
[28] Wu H-W, Zhen J, Zhang J. Urban rail transit operation safety evaluation based on an improved CRITIC method and cloud model. J Rail Transp Plan Manag 2020; 16: 100206.
[29] Wei G, Lei F, Lin R, et al. Algorithms for probabilistic uncertain linguistic multiple attribute group decision making based on the GRA and CRITIC method: application to location planning of electric vehicle charging stations. Econ Res-Ekon Istraživanja 2020; 33: 828–846.
[30] Wang S, Wei G, Lu J, et al. GRP and CRITIC method for probabilistic uncertain linguistic MAGDM and its application to site selection of hospital constructions. Soft Comput 2022; 26: 237–251.
[31] Aytekin A. Evaluation of the financial performance of tourism companies traded in BIST via a hybrid MCDM model. Int J Appl Res Manag Econ 2019; 2: 20–32.
[32] Lai H, Liao H. A multi-criteria decision making method based on DNMA and CRITIC with linguistic D numbers for blockchain platform evaluation. Eng Appl Artif Intell 2021; 101: 104200.
[33] Peng X, Zhang X, Luo Z. Pythagorean fuzzy MCDM method based on CoCoSo and CRITIC with score function for 5G industry evaluation. Artif Intell Rev 2020; 53: 3813–3847.
[34] Puška A, Nedeljković M, Prodanović R, et al. Market Assessment of Pear Varieties in Serbia Using Fuzzy CRADIS and CRITIC Methods. Agriculture 2022; 12: 139.
[35] Puška A, Stević Ž, Pamuèar D. Evaluation and selection of healthcare waste incinerators using extended sustainability criteria and multi-criteria analysis methods. Environ Dev Sustain 2021; 1–31.
[36] Ouhibi A, Frikha HM. Evaluating environmental quality in Tunisia using Fuzzy CODAS SORT method. In: 2020 International Conference on Decision Aid Sciences and Application (DASA). IEEE, 2020, pp. 1115–1119.
[37] Aytekin A. CODAS-Sort ve çok boyutlu ölçekleme analizi ile illerin girişimcilik sınıflandırması. Sakarya: Sakarya University, pp. 411–421. https://doi.org/10.6084/m9.figshare.16652053.v1
[38] Ouhibi A, Frikha H. Interval-valued intuitionistic fuzzy CODAS-SORT method: Evaluation of natural resources in Tunisia. In: 2020 International Multi-Conference on:“Organization of Knowledge and Advanced Technologies”(OCTA). IEEE, 2020, pp. 1–5.
[39] Ouhibi A, Frikha HM. An intuitionistic fuzzy extension of the codas-sort method. Mult Criteria Decis Mak 2021; 16: 110–121.
[40] Mukhametzyanov I. Specific character of objective methods for determining weights of criteria in MCDM problems: Entropy, CRITIC and SD. Decis Mak Appl Manag Eng 2021; 4: 76–105.
[41] Žižović M, Miljković B, Marinković D. Objective methods for determining criteria weight coefficients: A modification of the CRITIC method. Decis Mak Appl Manag Eng 2020; 3: 149–161.
[42] Aytekin A. Efficiency and performance analyses of food companies via IDOCRIW, REF-II, and OCRA methods. In: Business Studies and New Approaches. Lyon: Livre de Lyon, pp. 7–24. https://doi.org/10.6084/m9.figshare.16669432.v1
[43] Diakoulaki D, Mavrotas G, Papayannakis L. Determining objective weights in multiple criteria problems: The critic method. Comput Oper Res 1995; 22: 763–770.
[44] Aytekin A. Çok kriterli karar problemine uzaklık ve referans temelli çözüm yaklaşımı. Doktora Tezi, Anadolu Üniversitesi, https://openaccess.artvin.edu.tr/xmlui/handle/11494/2558 (2020).
[45] Aytekin A. Comparative Analysis of the Normalization Techniques in the Context of MCDM Problems. Decis Mak Appl Manag Eng 2021; 4: 1–25.
[46] Keshavarz Ghorabaee M, Zavadskas EK, Turskis Z, et al. A new combinative distance-based assessment (CODAS) method for multi-criteria decision-making. Econ Comput Econ Cybern Stud Res; 50.
[47] Ouhibi A, Frikha H. CODAS-SORT: A new CODAS based method for sorting problems. In: 6th International Conference on Control, Decision and Information Technologies (CoDIT). IEEE, 2019, pp. 855–860.
[48] EPI. Environmental performance index. Yale Univ Columbia Univ N Hav CT USA, https://epi.yale.edu/ (2022).
[49] UN. UNSD Environmental Indicators. Environ Stat, https://unstats.un.org/unsd/envstats/qindicators.cshtml (2022).
[50] World Bank. The World Bank Databank. Environ Data, https://databank.worldbank.org/home.aspx (2022).
[51] Ahmed S, Islam MT, Karim MA, et al. Exploitation of renewable energy for sustainable development and overcoming power crisis in Bangladesh. Renew Energy 2014; 72: 223–235.
[52] Al-Mulali U, Sab CNBC. The impact of energy consumption and CO2 emission on the economic growth and financial development in the Sub Saharan African countries. Energy 2012; 39: 180–186.
[53] Alola AA, Bekun FV, Sarkodie SA. Dynamic impact of trade policy, economic growth, fertility rate, renewable and non-renewable energy consumption on ecological footprint in Europe. Sci Total Environ 2019; 685: 702–709.
[54] Bubna-Litic K, Stoianoff NP. Carbon pricing and renewable energy innovation: A comparison of Australian, British and Canadian carbon pricing policies. Bubna-Litic Karen Stoianoff Natalie 2014Carbon Pricing Renew Energy Innov Comp Aust Br Can Carbon Pricing Policies Environ Plan Law J 2014; 31: 368–384.
[55] Ikram M, Zhang Q, Sroufe R, et al. Towards a sustainable environment: The nexus between ISO 14001, renewable energy consumption, access to electricity, agriculture and CO2 emissions in SAARC countries. Sustain Prod Consum 2020; 22: 218–230.
[56] Sarkodie SA, Strezov V. Empirical study of the environmental Kuznets curve and environmental sustainability curve hypothesis for Australia, China, Ghana and USA. J Clean Prod 2018; 201: 98–110.
[57] Sovacool BK. Contestation, contingency, and justice in the Nordic low-carbon energy transition. Energy Policy 2017; 102: 569–582.
[58] Sovacool BK, Noel L, Kester J, et al. Reviewing Nordic transport challenges and climate policy priorities: Expert perceptions of decarbonisation in Denmark, Finland, Iceland, Norway, Sweden. Energy 2018; 165: 532–542.
[59] Erataş F, Uysal D. Çevresel Kuznets eğrisi yaklaşımının “BRICT” ülkeleri kapsamında değerlendirilmesi. İstanbul Üniversitesi İktisat Fakültesi Mecm 2014; 64: 1–25.
[60] Akram R, Chen F, Khalid F, et al. Heterogeneous effects of energy efficiency and renewable energy on carbon emissions: evidence from developing countries. J Clean Prod 2020; 247: 119122.
[61] Aytekin A, Durucasu H. Nearest solution to references method for multicriteria decision-making problems. Decis Sci Lett 2021; 10: 111–128.
[62] Biswas T, Chatterjee P, Choudhuri B. Selection of commercially available alternative passenger vehicle in automotive environment. Oper Res Eng Sci Theory Appl 2020; 3: 16–27.
[63] Faraji Sabokbar H, Hosseini A, Banaitis A, et al. A novel sorting method TOPSIS-SORT: an applicaiton for Tehran environmental quality evaluation.
[64] de Lima Silva DF, de Almeida Filho AT. Sorting with TOPSIS through boundary and characteristic profiles. Comput Ind Eng 2020; 141: 106328.
[65] Zavadskas EK, Turskis Z. A new additive ratio assessment (ARAS) method in multicriteria decision-making. Technol Econ Dev Econ 2010; 16: 159–172.
[66] Stević Ž, Pamuèar D, Puška A, et al. Sustainable supplier selection in healthcare industries using a new MCDM method: Measurement of alternatives and ranking according to COmpromise solution (MARCOS). Comput Ind Eng 2020; 140: 106231.
[67] Hwang C-L, Yoon K. Methods for multiple attribute decision making. In: Lecture notes in economics and mathematical systems no. 186: Multiple attribute decision making. Springer, 1981, pp. 58–191.
[68] Yazdani M, Zarate P, Zavadskas EK, et al. A Combined Compromise Solution (CoCoSo) method for multi-criteria decision-making problems. Manag Decis.
[69] Zavadskas EK, Turskis Z, Antucheviciene J, et al. Optimization of weighted aggregated sum product assessment. Elektron Ir Elektrotechnika 2012; 122: 3–6.
Biography

Ahmet Aytekin is a researcher at Artvin Çoruh University, the Hopa Faculty of Economics and Administrative Sciences, the Business Administration Department, Turkey. Dr. Ahmet Aytekin obtained his MSc and PhD degrees in Quantitative Methods from Anadolu University in Eskişehir, Turkey. His research interest includes the fields of decision analysis, multi-criteria decision-making, fuzzy set theory, multivariate statistical analysis, and data analysis. Dr. Aytekin has also been serving on the review and editorial board for several international journals. He has published many research papers in indexed journals and books.
Strategic Planning for Energy and the Environment, Vol. 41_3, 281–316.
doi: 10.13052/spee1048-5236.4133
© 2022 River Publishers