Household Characteristics and Energy Provision of Rural Households in Central Nepal
Bishnu Pariyar1,*, Bishnu Rijal2, Jon C. Lovett3, Rozy Bisunke4 and Krishna Kumar Shrestha5
1Goatland Group, Rainas – 6, Lamjung, Nepal and School of Geography, University Leeds, United Kingdom, LS2 9JT
2Central Department of Botany, Tribhuvan University, Kathmandu, Nepal
3School of Geography, University Leeds, United Kingdom, LS2 9JT
4Samata Foundation, Kathmandu, Nepal
5Central Department of Botany, Tribhuvan University, Kathmandu, Nepal
E-mail: bpariyar.goatland@gmail.com
*Corresponding Author
Received 20 July 2021; Accepted 06 January 2022; Publication 23 March 2022
Abstract
Access to affordable, reliable and modern energy services is the primary aim of Sustainable Development Goal 7 and underpins other SDGs for improving health and welfare. In keeping with the SDG objectives, national governments and development agencies have been advocating reduction of households’ dependency on traditional sources of energy and encourage the transition to clean energy. Whilst policy interventions for this have had some success, a large proportion of households, especially in the rural areas of developing countries still continue to face energy shortages and lack of access to clean energy continues to be a major developmental challenge. This study investigates the energy use of 295 rural households in three rural villages in central Nepal. Results demonstrate that households continue to depend on traditional sources of energy with limited access to clean energy. Furthermore, access to clean energy amongst households in rural Nepal is determined by households and community socio-economic status. The paper argues that much more needs to be done to enhance households’ access to clean energy and reduce their dependency on traditional sources of energy and the distributional implications of such measures need to be properly considered.
Keywords: Traditional fuel, energy poverty, inequity, rural households, bioenergy, Nepal.
Highlights
• We study energy use in rural areas of Nepal using a household survey method.
• Rural households continue to overwhelmingly rely on traditional fuel sources.
• Access to clean fuel depends on household socio-economic status.
• Lack of access to clean fuel impacts on people’s health and wellbeing.
• Energy interventions should have imbedded equity considerations.
1 Introduction
Energy supply is a fundamental input for economic activities, securing a reasonable standard of living, promoting human health, enhancing technological innovation and achieving sustainable development [1–4]. Although the Millennium Development Goals (MDGs) did not explicitly mention energy, it was included as Goal 7 in the Sustainable Development Goals (SDGs) and underpins almost all the other SDGs including reducing poverty, improving women’s and maternal welfare, reducing child mortality rate, enhancing access to education and maintaining environmental sustainability [5, 6]. However, more than 3 billion people, mostly from developing countries, lack access to “adequate, affordable, reliable, high quality, safe and environmentally benign energy services to support economic and human development” [7]. About one billion people, mostly in Africa, lack access to electricity [8]. In Nepal, even those communities connected to the grid experience constant electricity black-outs due to chronic load shedding. Many rural communities in developing countries have been experiencing an energy crisis to the extent that it is almost impossible to achieve the SDGs [8, 9]. Published statistics indicate that the incidence of poverty is high in communities where access to modern clean energy remains low and dependency in traditional fuels is high, highlighting the importance of access to modern clean energy for poverty reduction, livelihood sustenance, improving the well-being of women and children, and environmental protection [10, 11].
The advantages of access to affordable clean energy are well documented [12–14]. Provision of clean energy has a positive impact for achieving sustainability right across the supply chain from the energy source to the production system to service delivery and use. The sources of clean energy are clean, abundant, affordable and available, and the production system will have improved efficiency, integrated production, multigenerational and waste recovery. Over reliance on traditional fuels such as fuelwood has led to deforestation and coal burning has environmental problems reducing the welfare of not only this generation, but also of future generation causing issues of intergenerational equity and justice [15]. Also, the use of biogas plants has provided opportunity to recycle wastes [16, 17]. At the service delivery level the clean energy is considered to be more dependable, efficient, practical and clean and efficient [18]. However, despite multiple advantages, a large proportion of the global population especially from developing countries still lack access to affordable modern clean energy where they rely on traditional fuels such as firewood, agricultural residues and animal dung cakes for cooking, heating and lighting. A growing body of evidence suggests that inefficient burning of traditional fuels leads to indoor air pollution (IAP) with detrimental effects on human health causing diseases such as eye infections, lung cancer, bronchitis, chronic obstructive pulmonary disease (COPD) and acute lower respiratory infection (ALRI) [19–21]. IAP ranks as the third major contributor to morbidity and mortality, only after malnutrition and unsafe water and sanitation [22], causing more than 1.5 million deaths per year, mostly amongst children and women across the developing world [23] for which it is also called the “killer in the kitchen” [24]. In addition to respiratory and eye diseases, dependency on firewood has other health implications. Many women and children carry heavy bundles of firewood orwooden logs on their shoulders, head and back causing muscular strain, head, neck and back pains when transporting fuel from the forests to home and local markets [25–27].
In many developing countries, access to education can be also be influenced by not only having access to resources such as books, stationary, schools and teachers, but also access to energy. Development interventions to electrify rural communities, such as the Humla district in Western Nepal, has the potential to double the district’s combined “education” HDI factor from 0.23 to 0.46 within a decade [28]. Similarly, a growing body of literature has found direct and positive impacts of access to electricity on education [29–31] in many developing countries. Case studies from India [32]; Africa [33]; the Philippines [34]; Bangladesh and Vietnam [35] and Zambia [36] noted that rural electrification, either through biogas or photo-voltaic solar power, significantly contributed to lighting and thermal energy facilities in the schools, mainly in rural areas. Similarly, another study demonstrated that recurrent load shedding in Nepal until recent past has impacted all sectors: residential, commercial and educational making access to clean energy a major developmental challenge [37]. As a result, many school children, especially girls, are kept out of school to assist in fuelwood collection [38] sometimes walking more than 20 kilometres daily, contributing to a gender imbalance in schools [3]. Furthermore, time saved from not having to go to the forest to collect firewood, and preparing dung for cooking and heating, can be used by reading and educational activities. A similar study in Nepal reported that 11.5% of women in rural areas used the time saved due to the availability of biogas in their houses for reading in the evening, particularly for adult education, which has contributed towards reducing adult illiteracy in Nepal [40]. Because communities and household members, especially women, spend more time on the provision of fuel for households, they lack sufficient time to be involved in income generating activities, adding to their level of poverty.
This paper has three main objectives. Firstly, an investigation of issues pertaining to energy provision and distribution amongst rural households in Nepal. Secondly, a study of various aspects of rural households impacted by insecure energy supply. Thirdly, the paper investigates the level of households’ access to renewable and alternative sources of energy. This paper seeks to answer two specific questions. Firstly, what are the energy provisions across rural households in Nepal and secondly, which socio-economic factors influence households’ access to modern clean energy in rural Nepal. Fieldwork was conducted in three rural villages in central Nepal where 300 households were interviewed, yielding a useable sample of 295 households.
The paper is divided into six sections. Section 1 introduces the topic and outlines research questions. The status of Nepal’s energy consumption is presented in Section 2, whilst Section 3 presents the research methods including data collection and study sites. Section 4 presents the analysis of energy consumption patterns amongst the sample households whilst Section 5 presents a model for the households’ dependency on traditional fuel. Some conclusions are drawn and recommendations are made in Section 6.
2 Energy Scenario in Nepal
Nepal has a huge potential for energy generation. There are an estimated 6000 perennial rivers and rivulets and small tributaries with an average water runoff of 225 billion cubic meters. Studies of Nepalese energy potential have estimated Nepal’s theoretical hydropower potential to be 83 GW, of which 42 GW is considered technically and economically feasible [41, 42]. However only 1.53 per cent of Nepal’s total potential hydropower has been utilised so far [43]. Data on Nepal’s energy requirements are still sparse and patchy because an overwhelming proportion (80 per cent) of the Nepalese population live in rural areas where recording of energy demand and supply is virtually non-existent. Nepal’s energy demand is met by a range of the sources, which can broadly be categorised into three categories namely traditional, commercial and alternatives. The majority of Nepal’s energy demand (87 per cent) is met through traditional sources such as fuelwood (77.7 per cent), agricultural residues (3.7 per cent) and animal dung (5.7 per cent) for most household activities including cooking, heating and lighting [44].
The proportion of energy generated through commercial sources is about 12 per cent of national fuel consumption with coal (1.9 per cent), grid electricity (2 per cent) and petroleum products (8 per cent) [45]. Aside from hydropower, Nepal does not have domestic feedstocks for commercial energy generation, Nepal’s energy generation is characterised by dependency on imported fossil fuels costing 116.8 billion Nepalese Rupee in 2018. Nepal imported 2.07 million kL (kilo-litres) of petroleum in 2017/18 and the demand for petroleum has been increasing steadily at a rate of 13.8 per cent annually, which has contributed to the trade deficit with India [46]. Data indicate that the proportion of Nepalese using LPG for cooking and heating increased from 18 per cent in 2015 to 26.6 per cent in 2018/19 and the per capita electricity consumption has also increased from 80 kilowatt-hour (KWh) in 2015 to 260 KWh [46].
Nepal is still at an early stage of the Renewable and Alternative Energy Technologies revolution as most RET technologies were not introduced until the early 2000s. Although the use of RETs such as micro-hydro, solar and biogas are in increasing, the share of RETs in the national energy supply remains rather modest with RETs contributing to only 1 per cent of national energy consumption [47]. However, the growth of RETs has been rather slow mainly because of an ineffective institutional framework, political instability, a lack of incentives, and equity and distribution concerns. Nepal imports a large amount of energy from other countries in the form of oil, gas and coal. For example, Nepal imported about 250 million litres of petrol, 810 million litres of diesel, 18.5 million litres of kerosene, 125 million litres of aviation turbine fuel (ATF) and 230,000 metric tonnes of LPG, which cost Nepal about 150 billion Nepali Rupees in 2018 [48].
The demand for electricity is increasing by more than 11.7 per cent yearly [49]. Whilst Nepal has been officially declared an electricity surplus country since 2018, only 77.45 per cent of peak electricity demand could be met by the National Electricity Authority (NEA). The remaining 22.55 per cent was reported to have been adjusted through seasonal adjustment to power distribution and purchase from India particularly during the winter months [50]. Furthermore despite having a huge hydro potential, only 58 per cent of Nepalese households are connected to the national electricity grid whilst another 9 per cent rely on off-grid renewable supplies [51]. More than 6.6 million Nepalese remain without electricity, despite Nepal officially being declared an electricity surplus country [52]. Nepal has one of the world’s most expensive electricity prices with NRs 10.92/kWh making it unaffordable for many Nepalese [53]. As such, many Nepalese, especially in rural areas, use electricity only for absolutely necessary purposes such as lighting. The rate of electrification in Nepal demonstrates a clear urban-rural divide. Of the people without access to electricity 10 per cent and 90 per cent for urban and rural areas respectively [53]. More than a quarter of Nepal’s electricity production (28 per cent) is consumed in the nation’s capital city Kathmandu [54]. Nepal’s inability to harness its hydropower has been attributed to a number of factors such as lack of resources both financial and technical, political instability, prolonged political transition, lack of political commitment and accountability [55]. However, investments in the power sector, especially hydro-power, is increasing in Nepal with 898 energy projects supported by India and 629 by China [56].
Published statistics for energy consumption indicate the clear dominance of the residential sector as 48 per cent of the country’s energy demands arise from it. Despite being an agricultural country, agriculture is still subsistence consuming only 2 per cent of the country’s total energy consumption. Increasing population and expansion of the road network in the country has meant that the share of the transport sector and industrial sector remains at 38 per cent whilst the commercial and service sector consumes 12 per cent of country’s energy [57].

Figure 1 Urban and rural household level energy consumption for cooking. Source: [58].
Figure 1 provides an overview of household energy consumption for cooking for rural and urban households in Nepal. An overwhelming proportion of rural households’ energy needs for cooking (81.4 per cent) are met through fuelwood and animal dung (9.1 per cent) whilst a smaller proportion of rural households have access to clean fuels such as LPG gas (3.9 per cent) and biogas (2.4 per cent) for cooking. Rural households also rely on other fuels such as charcoal (0.1 per cent) and kerosene (1 per cent) and agricultural residues (1.8 per cent). However, a higher proportion (40.2 per cent) of urban households had access to LPG gas as cooking fuel. Other clean fuels used by rural households are biogas (3.2 per cent), and biogas (0.2 per cent). The proportion of households using kerosene and fuelwood for cooking stands at around 36.2 per cent and 15.8 per cent respectively. A small portion of urban households relied on animal dung (2.5 per cent), agricultural residues (0.2 per cent), charcoal (0.2 per cent) and electricity (0.4 per cent) for cooking. These statistics demonstrate that whilst a wide range of cooking fuels are used at the household level, rural households primarily utilise traditional sources of fuels whilst households in urban areas have access to cleaner fuels for cooking. Indoor Air Pollution caused by burning traditional fuels accounts for 2.7 per cent of the national disease burden accounting for more than 8700 deaths every year in Nepal [59].
3 Methodology
A mixed methods approach was used to investigate household and community provision of energy in the mid-hills region of Nepal. The following section describes the project sites, data collection and sample characteristics.
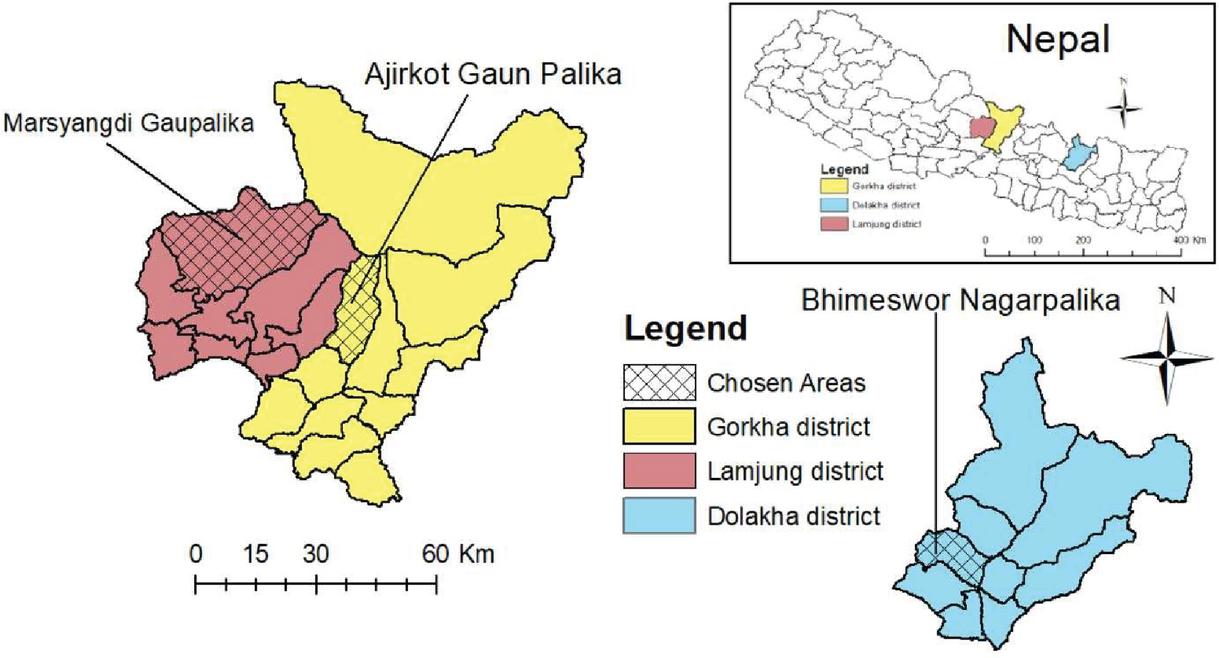
Figure 2 Study sites.
3.1 Study Sites
The fieldwork for this research took place in three villages namely Lakuri Danda village in Bhimeswor Municipality (Dolakha), Khudi village in Marsyangdi Rural Municipality (Lamjung) and Bhachchek village in Ajirkot Rural Municipality (Gorkha) in the mid-hills region of central Nepal (Figure 2). All three villages were typical rural villages with agriculture as the main occupation. Farmers in Lakuri Danda grew mainly potato, maize and millet in pakho bari, and some farmers grew monsoon paddy in areas with irrigation facilities called the khet land. The main crops grown in Khudi and Bhachchek were Monsoon paddy and winter wheat in Khet land and maize, millet and potato in areas without irrigation facilities called the pakho bari. Many youths from the study villages were working abroad mainly in the Middle East and remittance was an important part of the economy at household level. Whilst all the villages were ethnically mixed, castes such as Tamang, Gurung and Brahmin/Chhertri were prominent in Lakuri Danda, Khudi and Bhachchek villages respectively. A large number of the Thami caste (a highly indigenous ethnic group) were also living in Lakuri Danda village. The climatic conditions of the three districts were similar but varied within the districts ranging from sub-tropical in the southern parts, temperate and sub temperate (in the mid-high hills) and tundra in the northern mountains. As such, the major vegetation in all three villages was mostly similar due to almost similar environmental conditions and altitudes.
A number of community forests were present in the study villages. These provided fuelwood, fodder, timber and many non-timber forest products (NTFP) for the communities. The communities were served by local market places such as Bhachchek, Khudi and Mude bazaars for the villages of Bhachchek, Khudi and Lakuri Danda respectively where people could buy daily essentials including food, clothes and other household items including energy such as batteries, kerosene, candles. However, LPG gas was sold only in bigger market places such as the district headquarters Besishahar, Gorkha bazaar and Charikot for Khudi, Bhachchek and Lakuri Danda village respectively and had to be transported often by porters and mules particularly during the Monsoon season when ad-hoc rural roads were damaged.
3.2 Data Collection Method
Data for the research were gathered using a stratified random sampling survey method. The research covered various aspects of community and household energy provision, socio-economic aspects, gender and power relationships.
In order to capture community heterogeneities, households were selected using a stratified random sampling procedure from different caste/ethnic groups, wealth groups, household sizes and gender. For rural households, fuel consumption mainly depends on two factors: the number of individuals and cattle holding. In general, households cooked food for the family four times a day including morning tea, lunch, snack and evening dinner. They also prepared animal feed once a day. The PRA process revealed that households spend about 20 per cent of the fuelwood collected for cooking animal feed (kudo) for cattle whilst the remaining 80 per cent of the fuelwood is spent on cooking food for the family annually. Households with access to LPG used it only for cooking food for the family. The size of the cattle holding were given 20 per cent weighting whilst the number of individuals were given 80 per cent weighting in dividing the households into different categories. Households were divided into two groups namely ‘small’ and ‘large’ households based on the composite index of appropriately weighting for cattle and individuals in the family as mentioned above. The national average of household size (4.6 members) and average number of cattle per household (3.4 cattle) were used as a boundary for this purpose [60, 61]. For example, if the size of the households fell below the national average for number of cattle and family members then they were grouped in small household category and if they were above the national average then they were grouped into large household category. Similarly, income from various sources such as agriculture, business, wage labour, sale of animals, and remittance were combined together to create two categories – poor and rich households. Based on the PRA exercise, 70 per cent of an average rural household’s annual income (NRs 173,215) was used as a boundary [62]. Samples were also drawn from across different caste groups and gender on proportional basis to obtain a representative sample reflecting the socio-economic heterogeneities of the communities.
The questionnaire was administered to household heads in the study villages after being piloted in a randomly selected village outside the sample frame. The pre-testing helped the research team to identify new and irrelevant issues and refine/remove “difficult to answer” questions. Most households are headed by men. However, in some cases households are headed by widows or women whose husbands have left in search of employment in other countries. In female headed households women carry out almost all the work customarily assigned to men. However, usually women and children are involved in collecting fuelwood for the household despite a male household head. Women and children usually prune dry tree branches using sickles to bring home fuelwood whilst men usually carry heavy wooden logs and use axes to split them to make fuelwood. Similarly, household chores especially cooking was usually undertaken by women. Men were often hesitant to go into kitchen to cook in open fire cookstoves but if they did undertake cooking they preferred LPG or biogas.
4 Results and Observations
4.1 Sample Characteristics
A total of five research assistants were involved during the development of the sampling procedure and the data collection process. A total of 300 households were surveyed, with 295 valid responses used in the final analysis as 5 questionnaires were discarded for being incomplete. The incomplete questionnaires resulted primarily from two factors. Firstly, although almost all the participants were generally eager to answer the survey questionnaire, a small proportion of respondents did not have sufficient information to answer some of the questions being asked partly because of individual memory failure, or the inaccurate recall of past events as well as from memory distortions. Secondly, a small proportion of the household survey questionnaires were not fully completed, which were excluded from the final analysis due to incomplete information
Among the valid 295 households considered for analysis, the majority of the sampled households (84.4 per cent) were large households and the remaining 15.6 per cent were small households. This is characteristic of many rural households as they have large family sizes and agriculture remains the main occupation for the majority of the residents. They also keep animals for milk and manure. Dalit castes comprised 14.2 per cent of households surveyed, while 85.8 per cent belonged to non-Dalit higher castes including Brahmins/Chhetris and ethnic groups.
As expected, a greater proportion (54.2 per cent) of households were headed by men while the remaining 45.8 per cent households were headed by women. Generally, household members followed traditional family roles with women undertaking household activities including collecting fuelwood from forests and men were involved in non-household activities. The proportion of female headed households in the villages considered for this research was found to be higher than in many rural villages in Nepal. This could be because many men from the sampled villages were away in foreign employment, many of them working as labourers in India and Middle Eastern countries.
Samples were also drawn from different wealth categories namely poor and richer households. The proportion of rich households in the sample was 58.3 per cent whilst 41.7 per cent of households belonged to the poorer household group. The majority of households (71.5 per cent) were absolutely dependent on fuelwood and agricultural residues for cooking and heating. Whilst the remaining 28.5 per cent of respondents had access to LPG gas, they still used fuelwood for cooking as LPG was comparatively very costly. The majority of the sampled households engaged in agricultural practices (78 per cent), but they still had someone working abroad and sending remittance (27.6 per cent), which has become a major source of household income. Nonetheless, even though farmers reported alternative sources of employment such as business (8.8 per cent), the service sector (8.8 per cent), waged labour (1.7) and a traditional ethnic job (1.7 per cent), they still retained their agricultural practices reflecting the dominance of the sector in rural households.
4.2 Household Energy Consumption
4.2.1 Biomass-based fuel
Table 1 shows the amount of fuelwood and agricultural residues consumption amongst the sample households. The amount and type of fuels consumed varied across different categories of respondent such as gender, household size, wealth, caste and access to alternative fuel sources. Data indicate that male headed households (M 110.80, S.E. 6.51, N 158) consumed statistically significant [t (295) 2.96, p 0.05] more bhari (head load) of about 50 kg of fuelwood from forests compared to female headed households (M 85.72, S.E. 5.38, N 135).
Table 1 Biomass-based fuel sources
| Traditional Biomass-based Fuels | Improved Biomass-based | |||||
| Category | Fuelwood (Bhari)/Year | Agricultural Residues (Bhari)/Year | Total (Bhari)/Year | Weekly Time Spent in Fuelwood/ Agricultural Residue Collection (Hr) | Charcoal (Kg)/Year | Household with Biogas (Per cent) |
| Male | 110.80 (81.87) | 9.74 (33.21) | 120.79 (89.94) | 13.76 (7.19) | 28.42 (82.24) | 5.2 |
| Female | 85.72 (62.50) | 5.17 (9.61) | 100.08 (72.63) | 11.77 (7.74) | 26.72 (75.98) | 1.9 |
| Large | 103. 80 (75.19) | 8.51 (27.45) | 112.48 (81.54) | 13.61 (7.42) | 30.39 (82.57) | 4.0 |
| Small | 74.78 (66.39) | 2.90 (3.25) | 77.57 (67.55) | 8.77 (8.58) | 27.14 (78.83) | nil |
| Higher Caste | 94.76 (72.80) | 8.25 (27.23) | 103.19 (80.10) | 12.17 (7.20) | 29.10 (81.80) | 3.6 |
| Lower Caste | 126.02 (79.90) | 4.06 (6.38) | 130.08 (79.45) | 17.02 (7.99) | 19.17 (62.35) | 2.4 |
| Rich | 93.19 (74.12) | 6.44 (9.26) | 99.77 (75.81) | 12.65 (7.76) | 31.50 (92.57) | 5.2 |
| Poorer | 107.85 (74.56) | 9.35 (37.84) | 117.49 (85.84) | 13.13 (7.13) | 22.15 (55.10) | 0.8 |
| LPG users | 71.42 (66.43) | 6.28 (8.44) | 77.70 (67.62) | 7.87 (7.87)* | 30.39 (80.71) | 9.5 |
| LPG-non users | 110.43 (74.82) | 8.20 (29.56) | 119.00 (82.28) | 11.03 (8.19) | 26.53 (78.88) | 0.9 |
| SD in Parenthesis. | ||||||
As mentioned in the Methodology section, both the number of individuals and the number of cattle in the household was associated with the amount of fuel consumption annually. Therefore, larger households not only had more individuals but also larger animal holdings requiring more energy consumption compared to smaller households in the sample. As such, large households (M 103.80, S.E. 4.78, N 247) consumed significantly more fuelwood ([t (295) 2.44, p 0.05] from forests compared to smaller households (M 74.78, S.E. 9.79, N 48).
Similarly, Dalit households were usually involved in their traditional occupations such as ploughing, tailoring and making utensils and had fewer animals compared to higher castes. Despite a common assumption that Dalits have larger family sizes compared to non-Dalits [62], the sample demonstrated that in fact the size of Dalit households was smaller (5.1) compared to non-Dalits (5.3). This might be because the selected household consisted of a larger number of ethnic groups such as Tamang, Gurung and Thami, which tend to have a larger family size historically and culturally as the practice of using birth control measures such as contraception has only recently been adopted. However, the average number of animal holdings amongst the Dalits was 3.9 cattle compared to 5.8 cattle amongst the higher castes. Despite their smaller family size and animal holding, Dalit households (M 126.02, S.E. 12.33, N 42) consumed a significantly larger amount of fuelwood [t (295) 2.54, p 0.05] compared to households from the higher caste group (M 94.76, S.E. 4.59, N 253). A number of factors contributed to this. Firstly, Dalit households had a smaller landholding, which means they had access to less agricultural residues that could be used as fuel. Secondly, a high rate of poverty amongst Dalits has meant that they were unable to afford alternative fuels such as LPG. Lack of savings for a cash deposit has meant that Dalits also missed out on government subsidies for biogas installation. Thirdly, many Dalit households brewed local alcohol (raksi) for their own consumption and selling in local markets as a way of increasing their household income. The amount of fuelwood required for brewing alcohol is significantly higher than cooking meals and the food for the animals. Fourthly, because most of the Dalits households were living in areas of low productivity called Khoriya, which were usually next to the forests. This gave them easy access to fuelwood as they could collect dry tree branches and twigs from the local forests to be used as fuelwood.
Similarly, as richer households were able to afford clean fuels such as LPG from local markets and biogas plant installations in their homes, they consumed less traditional fuel such as fuelwood from the forest compared to poorer households. Despite being statistically non-significant, the amount of fuelwood consumed by richer households (M 93.19, S.E. 5.65, N 172) relied on less bhari fuelwood [(t 295) 1.66, p 0.09] compared to their poorer counterparts (M 107.85, S.E. 6.78, N 121). Table 1 also reveals that a small proportion (about 27 per cent) of the sampled households had access to LPG gas for cooking. Households with LPG gas consumed less fuelwood (M 71.42, S.E. 7.25, N 84) compared to those households without access to LPG (M 110.43, S.E. 5.18, N 209) per year. The result of the t-test indicates that the difference is statistically significant [(t 295) 4.16, p 0.05]. Although households with access to LPG gas consumed less agricultural residues (6.28 bhari) compared to those without access to LPG (8.20 bhari) annually, the difference is not statistically significant.
Table 1 also indicates that well off households such as male headed households, richer households, higher castes, households with access to LPG also have access to locally available and relatively cleaner fuels such as charcoal and biogas. Charcoal was mostly used for heating purposes, particularly during winter months, and considered to be a luxury by many respondents as charcoal is more expensive than fuelwood. The amount of charcoal used by higher castes (28.42 kg) is higher than female headed households (26.72 kg) per year. Similarly, larger households consumed 30.39 kg of charcoal whilst smaller households consumed 27.14 kg of charcoal per year. Households belonging to the higher caste category consumed 29.10 kg of charcoal compared to only 19.10 kg of charcoal by Dalit households per year. Poorer households consumed a small amount (22.15 kg) of charcoal compared to their richer counterparts (31.50 kg) per year. Interestingly, households using LPG gas were also using more charcoals (30.39 kg) compared to 26.53 kg per year by those without access to LPG gas.
Table 1 shows that a higher proportion (5.2 per cent) of male headed households had access to biogas compared to female headed households (1.9 per cent). None of the small households had access to biogas compared to 4 per cent of the larger households. Only 2.4 per cent of Dalit households had access to biogas compared to 3.6 per cent of higher caste households. Similarly, the richer household had a significantly higher level (5.2 per cent) of access to biogas compared to a 0.8 per cent from poorer households. Interestingly, a higher proportion (9.5 per cent) of households with access to LPG were also using biogas whilst less than one percent of those households without access to LPG gas for household were using biogas. Despite biogas remaining a policy priority for the Government of Nepal, only 3.4 per cent of the respondents were using biogas in the sample villages, which is very low despite government policy of promoting the use of biogas in rural areas. Whilst the uptake of biogas in Lakuri Danda was virtually non-existent mainly due to the cold climate where anaerobic digestion is slow, biogas uptake in Khudi and Bhachchek was also low despite being climatically viable. However, the proportion of households with access to biogas facilities differed greatly across different heterogeneities considered in this study.
In addition to the climatic constraint due to low temperature and higher altitude, the different level of access to biogas could be attributed to a number of other factors. Firstly, the costs of installation of a biogas plant can range between US$ 340 and US$ 440, which is considered expensive for rural households with annual per capita income of less than US$ 1000 for rural areas [63]. Furthermore, the distribution of such interventions has not been equitable as available subsidies have been targeted mainly at accessible areas and for those who could afford the initial upfront costs. Secondly, the tradition of keeping cattle particularly cows, bulls and buffaloes has been declining in recent times resulting in a lack of sufficient dung for biogas plants. The decline in cattle breeding in rural area is mainly due to a lack of labour as many men are abroad in foreign employment. Also, income from remittance in rural areas has reduced incentives for rural residents to continue doing labour intensive jobs such as keeping cattle. Unreliable supply and growing price of fertilizers have meant that the dung produced is mostly used as agricultural manure in farming. Thirdly, culturally dung is considered “dirty or filthy” and villagers mentioned that they are reluctant to use biogas for cooking food. In addition to economic and technical constraints, socio-cultural factors also play an important role in technology adoption as demonstrated by numerous previous studies such in India [64], Nigeria [65], Bangladesh [66] and Uganda [67].
Table 1 also presents information on time spent by sample households in making provisions for fuel for household. It is clear that households spend a considerable amount of time in providing fuel. On average households spend more than 12.85 hours a week on collecting fuelwood from forests whilst they spend 4.1 hours on collecting agricultural residues. Results of t-test [(t 295) 2.294, p 0.05] indicate that male headed households spend significantly more time (M 13.76, S.E. 0.568, N 160) compared to female headed household (M 11.77, S.E. 0.665, N 135). Similarly, Dalit households spend significantly more time in fuelwood collection (M 17.02, S.E. 1.23, N 42) compared to households from higher castes (M 12.17, S.E. 0.45, N 253). The result of the t-test indicates that the difference is statistically significant [(t295) 3.968, p 0.05]. On average, large households spend more time on fuelwood collection (M 13.61, S.E. 0.47, N 249) compared to small households (M 8.77, S.E. 0.97, N 46), which is statistically significant [t(295) 4.132, p 0.05]. Similarly, non-LPG users spend considerably more time (M 11.03, S.E. 0.57, N 210) compared to LPG user households (M 7.87, S.E. 0.87, N 82) in collecting fuelwood, which was statistically different [t(295) 2.996, p 0.05].
4.2.2 Non biomass-based fuel
In addition to biomass-based fuels such as fuelwood, agricultural residues, charcoal and biogas, the households in the study sites had other sources of energy including hydro-electricity, LPG gas, kerosene, candle and solar power as shown in Table 2.
Data indicate that whilst in general households consumed a modest amount of LPG, its consumption was varied along the different categories of household group. Male headed households used almost twice the amount of LPG (2.32 cylinders) compared to 1.34 cylinders a year amongst female headed households.
Table 2 Non-biomass based fuel sources
| Household | |||||
| with | |||||
| LPG | Kerosene | Electricity | Candle | Solar | |
| Categories | Cylinder/Year | (Litres)/Year | (KWh)/Year | (Pack)/Year | (Per cent) |
| Male | 2.32 (12.88) | 9.78 (14.19) | 27.37 (35.88) | 17.39 (60.60) | 5 |
| Female | 1.34 (2.82) | 8.18 (12.73) | 25.03 (24.30) | 14.56 (24.91) | 2.2 |
| Large | 1.97 (10.46) | 9.1 (14.27) | 27.10 (31.93) | 15.70 (46.39) | 4 |
| Small | 1.32 (2.63) | 8.8 (8.54) | 21.93 (25.74) | 18.2 (54.06) | 2.2 |
| Higher Caste | 2.14 (10.41) | 7.97 (11.89) | 27.19 (32.69) | 17.19 (49.10) | 4.8 |
| Lower Caste | 0.23 (0.82) | 15.45 (19.86) | 20.98 (18.19) | 9.47 (37.16) | 3.6 |
| Rich | 2.66 (12.38) | 7.21 (11.73) | 28.03 (35.15) | 17.83 (56.15) | 4.7 |
| Poorer | 0.76 (2.75) | 11.6 (15.44) | 23.82 (24.01) | 13.60 (31.61) | 2.4 |
| LPG users | 6.25 (17.36) | 3.77 (6.23) | 35.91 (48.26) | 30.33 (76.87) | 4.8 |
| LPG-non users | Nil | 11.16 (15.03) | 22.42 (19.27) | 10.56 (26.50) | 3.3 |
| SD in Parenthesis. | |||||
Large households consumed nearly 2 cylinders of LPG a year compared to 1.35 cylinders by small households. Similarly, owing to costs, the amount of LPG consumed by Dalit households (M 0.23, S.E. 1.25, N 42) was significantly lower [t(295) 2.85, p 0.05] compared to higher caste households (M 2.15, S.E. 0.66, N 252). Similarly, as richer households could afford LPG, their use of LPG was five times (M 2.66, S.E. 0.94, N 172) compared to only 0.76 cylinder for poorer households (S.E. 0.25, N 122). The difference in the amount of LPG used between rich and poor households was statistically significant [t(295) 1.94, p 0.05].
Table 2 also shows that a small proportion (3.7 per cent) of sample households used solar power for meeting some of their household energy demands. However, a much larger proportion of better-off households such as large households (4 per cent), high caste households (4.8 per cent), rich households (4.7per cent), households using LPG gas (4.8 per cent) are using solar power compared to worse off households such as small households (2.2 per cent), Dalit households (3.6 per cent) and households with no access to LPG (3.3 per cent). The cost of a 100 Wp solar power system costs about 46,000 Nepalese Rupee and the average annual household income of NRs 173,215 for the area. Therefore, solar power installations are very costly and only the households with good economic standing can benefit from available technologies. These differences indicate worse off households are far from having access to modern technologies such as solar power due to financial constraints.
Despite Nepal being officially declared an electricity surplus country [39], households in many rural communities were finding it extremely difficult to meet some of the energy demands and had to rely on kerosene lamps and candles for lighting due to unpredictable power-cuts. Whilst kerosene has been used for both cooking and lighting purposes historically when it was cheaper, it is mainly only used for lighting purposes these days because it is considered very expensive. The price of kerosene was reported to be about 119 rupees per litre costing more than 1066 rupees a year for households. Table 2 indicates that worse off households such as Dalits, poorer households and those with no access to LPG were using considerably higher amounts of kerosene than households which are comparatively already better off such as those from higher castes, richer and those with access to LPG. The difference in the kerosene use amongst Dalit households (M 15.45, S.E. 3.1, N 42) is statistically significant [t(295) 2.37, p 0.05] compared to higher caste households (M 7.97, S.E. 0.75, N 251). Similarly, poorer households (M 11.65, S.E. 1.40, N 121) consumed significantly more kerosene [t(295) 2.66, p 005] compared to richer households (M 7.21, S.E. 0.89, N 172). Generally well off households, who could afford LPG and wax candles, consumed less kerosene (M 3.77, S.E. 0.68, N 84) compared to households with no access to LPG (M 11.16, S.E. 1.04, N 209). The differences between those are statistically significant [t(295) 5.95, p 0.05].
Respondents also relied on wax candles for lighting especially during the power cuts. Although statistically non-significant, Table 2 contains some interesting insights as Dalits, and poorer households consume fewer wax candles for lighting, which is considered less harmful than kerosene [68, 69]. On average, Dalits households consumed 9.47 packs of candles a year compared to 17.19 packs by higher caste households. Similarly, poorer households consumed only 13.60 packs of candles per year compared to 17.83 packs by richer households. The t-test results [t(295) 2.32, p 0.05] that households with access to LPG (M 30.33, S.E. 8.39, N 84) consumed a significantly higher amounts of candles per year compared to those households without access to LPG (M 10.56, S.E. 1.83, N 209).
Table 3 Household energy security
| Availability: Abundance/Reliability/Purchaseability of Fuel Supply | ||||||||
| in the Villages (Per cent) | ||||||||
| Agricultural | Biogas | |||||||
| Categories | Electricity | Fuelwood | Residues | Charcoal | LPG | Kerosene | Candle | Subsides |
| Male | 26.4 | 76.1 | 36.5 | 15.7 | 17.6 | 18.9 | 65.4 | 1.9 |
| Female | 32.8 | 78.5 | 30.6 | 16.6 | 19.3 | 28.9 | 74.6 | 5.2 |
| Large | 28.3 | 77.4 | 35.2 | 13.3 | 17.7 | 20.6 | 70 | 4 |
| Small | 34.8 | 76.1 | 26.1 | 28.3 | 21.7 | 39.1 | 67.4 | Nil |
| Higher Caste | 31.1 | 77 | 34.3 | 17.5 | 20.6 | 24.2 | 72.9 | 3.6 |
| Lower Caste | 19 | 78.6 | 31 | 4.8 | 4.2 | 19.0 | 50.0 | 2.4 |
| Rich | 36.6 | 80.2 | 30.4 | 16.9 | 22.7 | 22.1 | 70.2 | 5.2 |
| Poorer | 19 | 73 | 38.5 | 13.9 | 12.3 | 25.4 | 68.9 | 0.8 |
| LPG users | 33.3 | 71.4 | 28.6 | 20.2 | 50.0 | 20.2 | 83.3 | 9.5 |
| LPG-non users | 27.8 | 79.5 | 35.9 | 13.8 | 5.7 | 24.8 | 64.1 | 0.9 |
| Overall | 29.4 | 77.2 | 33.8 | 15.6 | 18.4 | 23.5 | 69.6 | 3.1 |
4.3 Energy Security Amongst Sample Households
Despite Nepal being declared load-shedding free officially [39], and villages considered for this research being connected to the national grid, residents of the sample villages continue to suffer from severe energy crisis with frequent, intermittent and unpredictable power cuts. Such power cuts are frequent during the dry winter months when Nepal’s hydropower stations produce less electricity as the volume of water in the rivers decrease. Table 3 shows the extent of energy insecurity in the study villages. On average, households suffered more than 25 hrs of power cuts a week. Whilst the differences in the power cuts across different groups were not statistically significant overall only 29.4 per cent of the respondents reported that the supply of electricity was reliable. It is worth noting that a small proportion of socio-economically disadvantaged household such as the Dalits and poorer households reported electric supply reliable. About 19 per cent of Dalit households reported the electric supply as reliable compared to 31.1 per cent of higher caste households, which was statistically significant (Chi-square 10.63, d.f. 1, p 0.05). Also, only a small proportion of poorer households (19 per cent) reported the supply of electricity as reliable compared to 36.6 per cent of richer households. The Chi-square test indicates that the difference is statistically significant (Chi-square 10.634, d.f. 1, p 0.05).
Table 3 also shows that whilst a higher proportion of respondents from each of the different groups considered the availability of fuelwood in the forest reliable, only a small proportion of the respondents considered the availability of agricultural residues, which could be used as fuel as reliable. This could be a result of recent shifts in agricultural practices. Many individuals mentioned that historically they only cultivated food crops such as maize, paddy and millet, but these days vegetable farming such as potato, cauliflower, cabbage and so on are in increasing trend. As many men and youths have migrated to foreign countries for employment, the intensity of agricultural activities has declined in recent years. Similarly, despite being expensive, wax candles have been widely used for lighting purposes particularly in the evenings and nights during the power cuts, which are often frequent and unpredictable.
A high proportion of respondents reported candles availability to be reliable as many local shops sell them due to high demand. However, despite a reliable fuelwood supply, the use of charcoal was not very common in the villages as it was only used for heating during winter months. Table 4 also shows that the reliability of LPG gas and kerosene is generally low although it varies considerably across different groups. For example, results from the Chi-square test indicate that statistically a significantly small proportion of worse off households such as Dalits (4.2 per cent), poor (12.3 per cent) and non-LPG users (5.4 per cent) compared to their better-off counterparts such as high castes (20.6 per cent), rich (22.7 per cent) and LPG users (50 per cent) considered the LPG supply reliable. Similarly, despite the government’s drive on biogas, a considerably small proportion of respondents across all the groups considered the biogas subsides to be reliable and easy to access.
Table 4 Energy scarcity and household activities affected
| Activities Affected as Results of Energy Shortage in the Villages (Per cent) | ||||||
| Category | Cooking | Lighting | Business | Heating | Entertainment | Education |
| Male | 90.6 | 94.4 | 59.4 | 75 | 81.9 | 83.8 |
| Female | 91.9 | 97 | 58.5 | 77.8 | 85.2 | 87.4 |
| Large | 90.8 | 94.8 | 59 | 76.7 | 84.3 | 86.3 |
| Small | 93.5 | 100 | 58.7 | 73.9 | 78.3 | 80.4 |
| Higher Caste | 90.5 | 94.9 | 60.1 | 77.9 | 83.4 | 85.4 |
| Lower Caste | 95.2 | 100 | 52.4 | 66.7 | 83.3 | 85.7 |
| Rich | 90.1 | 94.2 | 68.3 | 76.2 | 83.7 | 84.3 |
| Poorer | 92.7 | 97.6 | 52.3 | 76.4 | 82.9 | 87.0 |
| LPG users | 91.7 | 94 | 70.2 | 76.2 | 81 | 84.5 |
| LPG-non users | 91 | 96.2 | 54.5 | 76.3 | 84.4 | 85.8 |
4.4 Impact of Fuel Insecurity on Households Activities
Since the case study villages are typical rural locations, the respondents needed electricity mainly during evenings and nights primarily for lighting, cooking and for their children to study. The villages did not have any industries apart from a few small-scale home-based handlooms, carpentry, and ironwork. As mentioned earlier, despite Nepal being declared a load shedding free country, communities and households both in rural and urban areas continue to experience frequent and prolonged power cuts, which is mainly pronounced during the lean winter months. Even when the villages were connected to main power lines, they still suffer frequent power cuts. Table 4 shows how various aspects of households were impacted as a result of energy shortages. The results indicate that a significantly higher proportion of respondents across all the group categories reported that the shortage of energy in the villages was affecting many aspects of their household chores such as cooking, heating, communication and entertainment, local businesses, small cottage industries, and students’ education. More than 90 per cent of respondents reported cooking and lighting being affected as a result of fuel shortages. Similarly, aspects such as entertainment (watching TV, listening transistor/radio) and children’s education have been affected by more than 80 per cent of the respondents.
A slightly smaller proportion (more than 70 per cent) of households reporting heating being affected is mainly because villagers mostly used traditional fuel sources such as fuelwood and agricultural residues for heating and use of electric/gas heaters was very limited as they were both costly and energy-intensive. As the study villages did not have big industries and businesses, only a relatively small proportion (more than 50 per cent) of the respondents reported them affected as a result of energy shortage. Nonetheless, generally, all aspects of village life were impacted due to the severe power shortage in the study villages.
Heavy reliance on traditional fuels such as fuelwood and agricultural residues has detrimental effects on the environment and human health. Table 5 shows some commonly reported health problems, which respondents directly attributed to indoor air pollution caused by burning fuelwood in open fire cookstoves. Some commonly reported health problems included eye irritation, persistent cough, head/neck pain, burns, and asthma, bronchitis and lung cancer.
Table 5 Reported health complications as a result of indoor air pollution
| Health Complications as a Result of In-door Air Pollution (Per cent) N 295 | |||||||
| Categories | Eye Irritation | Cough | Head/Neck Pain | Burns | Asthma | Bronchitis | Lung Cancer |
| Male | 87.3 | 80.4 | 39.7 | 32.9 | 23.6 | 10.1 | 0.6 |
| Female | 83 | 71.1 | 43.4 | 34.1 | 24.6 | 15.2 | 1.5 |
| Large | 85.8 | 77.3 | 41.6 | 35.6 | 24.5 | 12.2 | 1.2 |
| Small | 82.6 | 69.6 | 40.9 | 21.7 | 21.7 | 13.3 | 0 |
| Higher Caste | 84.9 | 76.1 | 38.1 | 30.3 | 22.5 | 12.4 | 0.8 |
| Lower Caste | 88.1 | 76.2 | 60 | 52.4 | 33.3 | 12.5 | 2.4 |
| Rich | 82.5 | 74.3 | 37.2 | 35.1 | 26.3 | 8.2 | 1.8 |
| Poorer | 89.3 | 78.7 | 47.7 | 31.1 | 20.8 | 18.3 | 0 |
| LPG users | 75 | 59.5 | 41.9 | 19 | 13.3 | 9.6 | 1.4 |
| LPG-non users | 89.5 | 82.8 | 41.3 | 39.2 | 28.4 | 13.5 | 0 |
| Overall | 85.3 | 76.1 | 42.4 | 33.4 | 24.1 | 12.4 | 1 |
Overall, an overwhelmingly high proportion of respondents reported eye irritation and teary eyes (85.3 per cent) and a persistent cough (76.1 per cent) due to the use of traditional fuels such as firewood and dung. Lack of transport facilities has meant that all the fuelwood was carried by people on their heads and backs, which caused severe head and neck pains (42.4 per cent). As many households were using open fire cookstoves, burns were commonly reported (33.4 per cent) especially amongst children and women. The proportion of respondents reporting asthma and bronchitis remained 24.1 per cent and 12.4 per cent respectively. A small proportion (1 per cent) respondents attributed lunch cancer to indoor air pollution caused by burning fuelwood.
Whilst such health problems were very common amongst respondents from different groups, the Chi-square test indicates that the incidence of bronchitis between poor (18.3 per cent) and rich (8.2 per cent) was statistically significant (Chi-square=6.59, d.f. 1, p 0.05). Similarly, a higher proportion of Dalits (52.4 per cent) compared to higher caste households (30.3 per cent) reported ill-health. The difference was statistically significant (Chi-square 7.869, d.f. 1, p 0.05). The proportion of households reporting health complications associated with indoor air pollution remains smaller (except lung cancer) for those with access to LPG compared to those with no access to LPG gas. The incidence of poor health conditions such as eye irritation, asthma, cough, and burns was significantly lower amongst households with access to LPG compared to households without access to LPG gas.
5 Results and Discussions: Determinants of Households Fuel Consumptions
In order to understand the socio-economic determinants of household dependency on traditional biomass-based fuels i.e. fuelwood and agricultural residues, a model was fitted. The following equation shows biomass-based fuel consumption as a function of various socio-economic variables. The left-hand side of the equation contains the dependent variable (the amount of traditional biomass-based fuels) consumed by household Y. The right-hand side of the equation contains a set of explanatory variables X, a constant and error term. The dependent variable had a wide distribution and slightly skewed towards the left, for which a logarithmic transformation was done, which improved its normality for regression analysis. However, despite logarithmic transformation, Breusch-Pagan test results indicate presence of heteroscedasticity in the model. In order to put the results in context, appropriate heteroscedasticity consistent standard errors (S.E.s) (White’s S.E.s) for the OLS estimator is provided. Both sets of multicollinearity statistics (tolerance 0.1) and VIF 10) indicate multicollinearity not to be a concern in the model. In order to avoid variable omission bias, two variables namely household agricultural dependency and household income (continuous variable) was introduced in the model. In many rural villages, households which are farmers and do not have a secondary source of income not only have a higher amount of agricultural residues to be used as a source of fuel, but also lack financial capabilities to purchase clean fuels such as LPG gas from the market. Furthermore, theoretically, agricultural households generally have a higher number of animals to provide dung for biogas plants, but this was not the case in the study villages. This is because dung was mainly used as manure for crop cultivation and many households lacked financial resources for biogas plants in their houses. Although the introduction of additional variables increases the chances of multicollinearity, it was not statistically significant in the model used in this paper. Whilst household income was moderately co-related with poorer households, both the added variables did not introduce multicollinearity that warranted their omission from the model. Table 6 provides a list of explanatory variables used in the OLS model.
Table 6 Definition of explanatory variables
| Variables | Explanation |
| Caste | Dummy for castes (1 Dalits, 0 otherwise) |
| Size | Dummy for household size (1 larger household, 0 otherwise) |
| Poor | Dummy for Household Income status (1 Poor, 0 otherwise) |
| Gender | Dummy for household head (1 Male, 0 Female) |
| LPG | Dummy for household access to clean fuel (1 LPG users, 0 otherwise) |
| Time | Time taken to travel forest for fuelwood collection |
| Occupation | Dummy for households with agricultural based livelihood |
| (1 Agricultural, 0 otherwise) | |
| Education | Household head level of education in number of school year |
The results of the OLS regression model are presented in Table 7. The model has reasonable goodness of fit with R 0.48 and an acceptable significance level of 95 per cent confidence interval. Gender is positively and significantly related to the amount of fuel consumption. Although male headed households appear to consume more traditional fuels, usually, the women are involved in fuel provisioning for households including collecting fuelwood from the forest and storage of fuelwood.
Access to LPG gas is negatively and significantly related to dependence on traditional fuels. However, despite this, field observation revealed that households were mostly using LPG for cooking food for the family. They preferred to use fuelwood for cooking animal feed and at times when cooking for large gatherings such as wedding, parties, and religious festivals. This might be because LPG gas can be expensive for many rural households whereas fuelwood is freely available in the local forests. Similarly, Dalit castes are positively and significantly related to dependency on traditional fuels. A number of factors are responsible for this. Firstly, generally Dalits live next to the forests and have easy access to the fuelwood. Secondly, they are also involved in brewing local alcohol called ‘raksi’, which requires a significantly large amount of fuelwood for preparation. Thirdly, as many Dalits in rural areas are poor they lack the financial capability to purchase LPG or install biogas plants in their households.
Table 7 Socio-economic determinant for household dependency on traditional fuels
| Variables | Coefficient | -value |
| Constant | 3.864 (170) | 0.000 |
| Gender | 0.196 (0.088) | 0.026 |
| Access to Clean Fuel | 0.421 (0.105) | 0.000 |
| Dalit Caste | 0.282 (0.125) | 0.025 |
| Low Income | 0.059 (0.091) | 0.519 |
| Household Size | 0.433 (0.119) | 0.000 |
| Occupation | 0.216 (0.114) | 0.059 |
| Education | 0.005 (0.008) | 0.582 |
| Fuelwood collection time | 0.001 (0.032) | 0.976 |
| R 0.48, Adjusted, R 0.46, F-Test 7.387, Breusch-Pagan test for heteroscedasticity 32.067 (p 0.01), S.E. are provided in Parenthesis. | ||
Household size is positively and significantly related to traditional fuel consumption. As the size of the households is determined not only by the number of family members but also animal holdings, even those households with access to LPG or biogas relied on fuelwood and agricultural residues mainly due to costs and availability. Similarly, occupation is positively and significantly related to the use of traditional fuels. The primarily agricultural households are generally poorer with no alternative source of income and are unable to afford LPG. Furthermore, agricultural households also have access to cheap agricultural residues, which they use as fuel mainly for heating purposes. Both education and time to visit local forests does not seem to have a significant impact on the household dependent on traditional sources of fuel. This could be because of the fact that educational qualifications amongst the respondents were not sufficiently high enough to get a high paid salary making LPG affordable. Also, fuelwood is such a basic necessity, which is difficult to substitute because of costs implications as substitutes such as LPG and biogas plants are expensive for poverty-stricken rural households.
6 Conclusions and Policy Implications
Despite much emphasis on “affordable, reliable and modern energy services”, traditional sources of energy, such as wood and agricultural residues, and traditional technologies continue to be used in many households in rural Nepal. Whilst the amount of fuel consumed depends on the number of household members and the size of cattle holding, data indicates that dependency on, and consumption of, such traditional sources of fuel varies significantly amongst households with different levels of socio-economic heterogeneities. This paper has demonstrated that the poorer households and those households, which are lower in the socio-economic hierarchy such as poorer households and Dalits have a disproportionally high dependency on traditional sources of fuel compared to those households which are higher in socio-economic heterogeneities such as richer households and non-Dalits. Furthermore, access to improved fuel efficient gasifiers such as improved cookstoves amongst the less well of households has meant that they are also relying heavily on traditional ways of using fuel such ‘three stone’ fire places for cooking. Access to clean energy, such as LPG, electricity, solar and biogas reduces households’ reliance on traditional sources of fuel and traditional methods of using them, which are detrimental to both the environment and human health. However, despite much effort, the level of access to clean energy continues to remain low for many households in rural Nepal. Fuelwood and agricultural residues are primarily used for cooking and heating purposes whilst kerosene and wax candles are used for lighting purposes. Furthermore, socio-economically weaker households spend disproportionately more time and experience relatively higher opportunity costs in provisioning fuel for household consumption compared to their better off counterparts in rural villages in Nepal. Also, even when they have access to modern clean fuels, they are spending higher proportion of their household income on them compared to their better off counterparts.
High dependency on traditional fuels and low level of access to clean energy has impacted on various aspects of rural life such as cooking, heating, lighting, local businesses, study and human health amongst the households in rural Nepal. More importantly, the data indicated that human health in particular has suffered greatly due to the lack of access to clean energy amongst households in rural Nepal. Health complications, such as eye irritation, a persistent cough, head and neck pain, asthma and bronchitis, and lung cancer, are associated with being exposed to smoke from burning traditional fuels. However, the data indicate that the degree of impact of lack of access to energy in general and clean energy in particular, has been experienced differently amongst households with a varied degree of socio-economic heterogeneities. Generally, households that are better off socially and economically have better access to clean energy and they also experience less negative impact from burning traditional sources of fuel.
The model demonstrates that the level of access to clean energy such as LPG depends on various socio-economic heterogeneities existing in rural societies in Nepal. Lower caste status, such as being a Dalit household, is associated with a high dependency on traditional sources of fuel and a low level of access to LPG. This is particularly due to the unaffordability of expensive LPG and easy access to fuelwood and agricultural residues due to households’ physical proximity to local forests. Similarly, fuel demand for larger households is high and they rely most on traditional fuels such as fuelwood and agricultural residues for household energy requirements. Poverty coupled with closer proximity to forests means that Dalit households disproportionally rely on fuelwood from forests for meeting their household energy requirement. The data also indicates that the educational level of the rural agricultural household members is not sufficiently high enough to be able to afford LPG for meeting household energy demands and they continue to rely on traditional sources of fuel including fuelwood and agricultural residues. Similarly, a high level of dependency on traditional sources of fuel means that the physical distance from local forests does not appear to reduce households’ reliance on the household dependent on traditional sources of fuel. This could be because fuelwood is such a basic necessity, which is difficult to substitute because of cost implications as substitutes such as LPG gas and biogas plants are expensive for poverty-stricken rural households. The paper argues that enhancing people’s access to clean energy and reducing their dependency on traditional sources of fuel continues to be a challenge for rural households in Nepal. More importantly, efforts to enhance access to alternative and renewable energy should consider socio-economic heterogeneities existing in rural communities to realize the full potential of energy interventions in developing countries.
Acknowledgments
The first author is grateful to his research assistants Devi Ratna, Dipak Pariyar, Ashmita Achhami, Umesh Pariyar and Hari Sharan Pariyar for coordinating fieldwork, and to Dr Ishwar Pun for drawing the map. The authors thank all the research participants for their help in completing the questionnaires and replying to many queries. Funding for this research came from ESRC-DFID Development Frontiers Research Fund (Grant reference: ES/K011812/1).
References
[1] Birol, F. 2007. Energy economics: a place for energy poverty in the agenda? The Energy Journal, 28(3): 1–6.
[2] Hoogwijk, M. 2004. On the Global and Regional Potential of Renewable Energy Sources. Netherlands: Department of Science, Technology and Society, Utrecht University.
[3] Rogner, H.H. 2000. Energy resources and technology options. In: World Energy Assessment (WEA). New York: United Nation Development Programme (UNDP).
[4] Turkenburg, W.C. 2000. Renewable Energy Technologies. In: Goldemberg, J. (Eds.) World Energy Assessment. Washington D.C.: United Development Programme (UNDP).
[5] Brew-Hammond, A. 2010. Energy access in Africa: Challenges ahead. Energy Policy, 38: 2291–2301.
[6] Gaye, A. 2007. Access to Energy and Human Development. In: Human Development Report 2007/2008, In: Fighting climate change: Human solidarity in a divided world. Washington D.C.: UNDP.
[7] Masud, J., Sharan, D., Lohani, B.N. 2007. Energy for all: Addressing the Energy, Environment, and Poverty Nexus in Asia. Manila: Asian Development Bank (ADB).
[8] Chevalier, J.M. and Geoffron, P. 2013. The New Energy Crisis: Climate, Economics and Politics. Basingstoke: Palgrave Macmillan.
[9] Jahan, S. 2010. The MDGs Beyond 2015. IDS Bulletin, 41(1): 51–59
[10] Srivastava, L. and Rehman, I.H., 2006. Energy for sustainable development in India: Linkages and strategic direction. Energy Policy, 34(5): 643–654.
[11] Pachauri, S., Mueller, A., Kemmler, A. and Spreng, D., 2004. On measuring energy poverty in Indian households. World Development, 32(12): 2083–2104.
[12] Sovacool, B. 2012. The political economy of energy poverty: A review of key challenges. Energy for Sustainable Development, 16(3): 272–282.
[13] Dincer, I. and Acar, C. 2015. A review on clean energy solutions for better sustainability. International Journal of Energy Research, 39(5): 585–606.
[14] Panwar, N.L., Kaushik, S.C. and Kothari, S., 2011. Role of renewable energy sources in environmental protection: a review. Renewable and Sustainable Energy Reviews, 15(3): 1513–1524.
[15] Spijkers, O. 2018. Intergenerational equity and the sustainable development goals. Sustainability, 10(11): 1–12.
[16] Ai, P., Chen, M., Ran, Y., Jin, K., Peng, J. and Abomohra, A.E.F. 2020. Digestate recirculation through co-digestion with rice straw: Towards high biogas production and efficient waste recycling. Journal of Cleaner Production, 263: 121441.
[17] Rolewicz-Kaliñska, A., Leliciñska-Serafin, K. and Manczarski, P., 2020. The circular economy and organic fraction of municipal solid waste recycling strategies. Energies, 13(17): 4366.
[18] Nepal, R. and Jamasb, T., 2015. Caught between theory and practice: Government, market, and regulatory failure in electricity sector reforms. Economic Analysis and Policy, 46: 16–24.
[19] Bruce, N., Perez-Padilla, R., and Albalak, R. 2000. Indoor air pollution in developing countries: a major environmental and public health challenge. Bulletin of the World Health Organization, 78 (9): 1078–1092.
[20] Ezzati, M. and Kammen, D. M. 2001. Indoor air pollution from biomass combustion and acute respiratory infections in Kenya: an exposure-response study. The Lancet, 358: 619–624.
[21] Smith, K. R., Samet, J. M., Romieu, I., and Bruce, N. 2000. Indoor air pollution in developing countries and acute lower respiratory infections in children. Thorax, 55 (6): 518–532.
[22] Kurmi, O.P., Semple, S., Simkhada, P., Smith, W.C.S. and Ayres, J.G., 2010. COPD and chronic bronchitis risk of indoor air pollution from solid fuel: a systematic review and meta-analysis. Thorax, 65(3): 221–228.
[23] Rehfuess, E. 2006. Fuel for Life: Household Energy and Health. Geneva: World Health Organisation (WHO).
[24] Bailis, R., Berrueta, V., Chengappa, C., Dutta, K. Edwards, R., Masera, O., Still, D. and Smith, K.R. 2007. Performance testing for monitoring improved biomass stove interventions: experiences of the household energy and health project. Energy for Sustainable Development, 11(2): 57–70.
[25] Haile, F. 1991. Women fuelwood carriers in Addis Ababa and the peri-urban forest. Geneva: International Labour Office (ILO).
[26] Cecelski, E. 1999. The Role of Women in Sustainable Energy Development, Bolder Colorado: National Renewable Energy Laboratory.
[27] UNDP. 1997. Energy After Rio: Prospects and Challenges. New York: United Nations Development Program (UNDP).
[28] Bhusal, P., Zahnd, A., Eloholma, M., Halonen, L. 2007. Energy-efficient innovative lighting and energy supply solutions in developing countries. International Review of Electrical Engineering, 2(5): 665–670.
[29] Anderson, T., Doig, A., Rees, D. and Khennas, S. 1999. Rural energy services: a handbook for sustainable energy development. Bradford: ITG Publication.
[30] Foley, G. 1992. Rural electrification in the developing world. Energy Policy. 20(2): 145–152.
[31] Foley, G. 2000. Photovoltaic Applications in Rural Areas of the Developing world, ESMAP Technical Paper. ESMAP (Energy Sector Management Assistance Programme): Washington D.C.: World Bank.
[32] Sharma, P. 2005. Distance education and online technologies in India. In: Carr-Chellman, A. (Eds). Global Perspectives on E-learning: Rhetoric and reality. London: Sage.
[33] Kirubi, C., Jacobson, A., Kammen, D.M. and Mills, A., 2009. Community-based electric micro-grids can contribute to rural development: evidence from Kenya. World development, 37(7): 1208–1221.
[34] Barnes, D.F. and Floor, W.M. 2003. Rural Energy in Developing Countries: A Challenge for Economic Development. Annual Review of Energy and the Environment, 21(1): 497–507.
[35] Wang, X. 2004. A Review of the ESMAP Rural Energy and Renewable Energy Portfolio, ESMAP Paper. ESMAP (Energy Sector Management Assistance Programme): Washington D.C.: World Bank
[36] Gustavsson, M. 2007. Educational benefits from solar technology–Access to solar electric services and changes in children’s study routines, experiences from eastern province Zambia. Energy Policy, 35: 1292–1299.
[37] Rajbhandari, M. M. S. 2011. Hurdle towards Education Decentralization: An Ontological Paradigm of Community Participation in India and Nepal. Available from http://files.eric.ed.gov/fulltext/ED518022.pdf cited on 18 March 2020.
[38] Clancy, J., Skutsch, M. and Batchelor, S. 2003. The Gender – Energy – Poverty Nexus: Finding the energy to address gender concerns in development. London: Department for International Development (DfID).
[39] Rothchild, J. 2006. Gender Trouble Makers: Education and Empowerment in Nepal. London: Routledge.
[40] Katuwal, H. and Bohora, A. K. 2009. Biogas: A promising renewable technology and its impact on rural households in Nepal. Renewable and Sustainable Energy Reviews, 13(9): 2668–2674.
[41] Pokharel, S. 2001. Hydropower for energy in Nepal. Mountain Research and Development, 21(1): 4–9.
[42] Zahnd, A. and Kimber, H.M. 2009. Benefits from a renewable energy village Electrification system. Renewable Energy, 34(2): 362–368.
[43] Nepal Electricity Authority: A Year in Review Fiscal Year 2020/21. Kathmandu: Nepal. Nepal Electricity Authority
[44] K.C., S. Khanal, S. K., Shrestha, P. and Lamsal, B. 2011. Current status of renewable energy in Nepal: opportunities and challenges. Renewable and Sustainable Energy Reviews. 15: 4107- 4117.
[45] WECS. 2013. Nepal’ Energy Sector Vision 2050 A.D. Kathmandu: Nepal Water and Energy Commission Secretariat
[46] Nepal Oil Corporation. http://www.nepaloil.com.np/; 2018, Accessed date: 18 November 2018.
[47] Gurung, A., Ghimeray, A.K. and Hassan, S.H. 2012. The prospects of renewable energy technologies for rural electrification: A review from Nepal. Energy Policy, 40:374 -380.
[48] Nepal Oil Corporation Limited. Nepal monetary solutions. https://nepalmonetarysolutions.blogspot.com/2015/09/nepal-oil-corporation-limitednoc.html; 2018, Accessed date: 17 December 2021.
[49] Poudyal, R., Loskot, P., Nepal, R., Parajuli, R. and Khadka, S.K. 2019. Mitigating the current energy crisis in Nepal with renewable energy sources, Renewable and Sustainable Energy Reviews, 116: 1–14.
[50] Ministry of Finance. 2015. Government of Nepal Economic Survey. Ministry of Finance: Kathmandu, Nepal.
[51] Ministry of Finance. 2020. Government of Nepal Economic Survey. Ministry of Finance: Kathmandu, Nepal.
[52] Central Intelligence Agency. The world fact book. https://www.cia.gov/library/publications/resources/the-world-factbook/geos/ma.html; 2011, cited on 17 December 2021.
[53] WECS. 2013. Nepal’ Energy Sector Vision 2050 A.D. Kathmandu: Nepal Water and Energy Commission Secretariat.
[54] Shrestha, R.M. and Rajbhandari, S. 2010. Energy and environmental implications of carbon emission reduction targets: Case of Kathmandu Valley, Nepal. Energy Policy, 38(9): 4818–4827.
[55] Gyawali, D. and Dixit, A. 2010. The construction and destruction of scarcity in development: Water and power experiences in Nepal. In: Mehta, L. (Eds) The Limits to Scarcity. Contesting the Politics of Allocation. London: Earthscan.
[56] NIICE. Nepal’s Policy for India and China vis-a-vis Hydropower Cooperation. Available from https://niice.org.np/archives/5893 cited on 17 December 2021.
[57] Nepal Electricity Authority. Annual report. A year in review August 2017. p. 176. Fiscal Year 2016/17.
[58] WHO. 2010. Household Energy Dataset. Geneva: World Health Organisation (WHO).
[59] WHO. 2007. Indoor Air Pollution: National Burden of Disease Estimates. Geneva: World Health Organisation (WHO).
[60] OCHA Services. 2021 Nepal: Annual Household Survey 2015/16. Available from https://reliefweb.int/report/nepal/nepal-annual-household-survey-201516 cited on 6 January 2022.
[61] Department Livestock. 2017. Livestock Statistics of Nepal. Available from https://nepalindata.com/media/resources/bulkuploaded/Livestock\_Statistics\_of\_Nepal\_2017\_Eng\_Dec17.pdf cited on 6 January 2022.
[62] CBS. 2011. Nepal living standards survey 2010/2011. Central Bureau of Statistics [CBS]. Kathmandu: Central Bureau of Statistics.
[63] BSP. 2006. Case study summary Biogas Sector Partnership. Kathmandu: Biogas Sector Partnership – Nepal (BSP-Nepal).
[64] Joon V., Chandra, A. and Bhattacharya, M. 2009. Household energy consumption pattern and sociocultural dimensions associated with it: A case study of rural Haryana, India. Biomass and Bioenergy, 33: 1509–1512.
[65] Akinbami, J.F., Ilori, M.O., Oyebisi, T.O., Akinwumi, I.O. and Adeoti, O. 2001. Biogas energy use in Nigeria: current status, future prospects and policy implications. Renewable and Sustainable Energy Review, 5(1):97–112.
[66] Mendola, M. 2007. Agricultural technology adoption and poverty reduction: A propensity-score matching analysis for rural Bangladesh. Food policy, 32(3): 372–393.
[67] Walekhwa, P.N., Mugisha, J. and Drake, L. 2009. Biogas energy from family-sized digesters in Uganda: Critical factors and policy implications. Energy Policy, 37(7): 2754–2762.
[68] Hammerton, J., Joshi, L.R., Ross, A.B., Pariyar, B., Lovett, J.C., Shrestha, K.K., Rijal, B., Li, H. and Gasson, P.E., 2018. Characterisation of biomass resources in Nepal and assessment of potential for increased charcoal production. Journal of environmental management, 223: 358–370.
[69] Grace, O.M., Lovett, J.C., Gore, C.J., Moat, J., Ondo, I., Pironon, S., Langat, M.K., Pérez-Escobar, O.A., Ross, A., Suzan Abbo, M. and Shrestha, K.K., 2020. Plant Power: Opportunities and challenges for meeting sustainable energy needs from the plant and fungal kingdoms. Plants, People, Planet, 2(5): 446–462.
Biographies

Bishnu Pariyar holds a PhD in Social Policy and Environment from the University of York (UK). He held teaching and research positions at a number of British Universities including York, Leeds and Sheffield. His research interests continue to be associated with the institutional aspects of management of natural resources for integrated development and the distributional aspects of such management practices. He is currently leading “Goatland Agro-Eco-Tourism Venture” working with a multidisciplinary team of agricultural scientists, rural sociologists, economists, farmers and local politicians in Nepal. He can be reached at bpariyar.goatland@gmail.com

Bishnu Rijal obtained his master degree in Botany and Anthropology from Tribhuvan University, Nepal. He currently teaches Botany at Budhanilkantha School, the National School of Nepal. His research interests remain within the field of development studies focussing on the management of forest resources and bio-energy for rural development and livelihoods of rural people in Nepal. Environmental and climate justice and their relevance to rural communities remains at the core of his research and teaching practice. He can be reached at bishnurijal311@gmail.com

Jon C. Lovett is Chair of Global Challenges in the School of Geography, University of Leeds UK. His main interest is natural resource management and he maintains a broad collaborative interdisciplinary environmental research programme. His research focuses on the institutional economics of natural resource management and takes an interdisciplinary approach bringing together both the natural and social sciences. He has worked in many different countries, including Nepal, Tanzania, Uganda, Mexico, Australia and Indonesia. His work on ‘Energy Gardens’ in Nepal was conducted with Dr Bishnu Pariyar and subsequently developed into several major projects on renewable energy in India, Indonesia, Uganda, Tanzania and Congo-Brazzaville. He can be reached at j.lovett@leeds.ac.uk

Rozy Bisunke holds a master degree in Sociology and two bachelor degrees in Law, and Sociology and Journalism from Tribhuvan University, Nepal. She is a legal and development practitioner and currently holds a position of a Human Rights and Justice Officer at the SAMATA Foundation, Nepal. Her research interests cover the intersectionality between human rights, natural resource management and climate justice especially in relation to the welfare of the marginal communities such as the Dalits in Nepal. Her research takes a critical feminist approach in dealing with the distributional aspects of development interventions in rural areas. She can be reached at rozy.bisunke@samatafoundation.org
Krishna Kumar Shrestha, Professor of Botany, is the Former Head of the Central Department of Botany, Tribhuvan University. He holds Ph.D. degree in Plant Systematics; and Post Doctoral Fellow at the Natural History Museum, London. He had been involved in teaching and research in Plant Systematics, Biodiversity, and Ethnobotany for over 40 years. He has coordinated and associated with 24 research projects; published five books, three edited books, 24 book chapters, and 95 research articles on the issues of biodiversity and ethnobotany. Prof. Shrestha is the Founder President of Ethnobotanical Society of Nepal (ESON), and one of the Editors of Flora of Nepal, an international initiative of the institutions of Nepal, Japan, and U.K. He has also contributed as the Advisory Board Member of Flora of Pan Himalaya, led by the Institute of Botany, Chinese Academy of Sciences, Beijing, China. He can be reached at kkshrestha123@gmail.com
Strategic Planning for Energy and the Environment, Vol. 41_1, 1–34.
doi: 10.13052/spee1048-5236.4111
© 2022 River Publishers