BAS-PSO Algorithm for Integrated Energy System Optimization of Multiple Energy Supply Facilities
Wei Xiong1,*, Xiangyue Chen1, Chen Liu1, Meng Huang2 and Jia Tong3
1Wuling Power Corporation Limited, Changsha, Hunan, China 410000
2Shandong Electric Power Engineering Consulting Institute Corp., Ltd. Jinan Shandong, China 250000
3School of Management, Xi’an University of Science and Technology, Xi’an Shaanxi 710054, China
E-mail: xiongwei_0110123@163.com
Received 11 March 2023; Accepted 05 April 2023; Publication 11 July 2023
Abstract
Regional low carbon will play an important role in the path of achieving the “double carbon” goal, and there are still many key technologies to be broken in its planning research. In this paper, an optimal scheduling model of integrated energy system with multiple energy supply devices is established by using Beetle Antennae Search-Particle Swarm Optimization (BAS-PSO) algorithm. First, in the scheduling model, a carbon trading mechanism is introduced and a stepped carbon trading cost model is constructed to constrain the carbon emissions of the plant. Then, using drosophila algorithm, the premise of whether wind power generation and photovoltaic power generation need to be built is determined by judging the economics of wind power generation and photovoltaic power generation in the construction area, and then the target power consumption curve and new energy power supply output curve are fitted. Then use the life cycle analysis method to analyze the carbon emissions generated by electric energy storage equipment, consider the carbon trading mechanism in the system economic operation model, and solve the model by BAS-PSO algorithm to overcome the problems of local optimum and slow convergence speed. Finally, a typical park integrated energy system is simulated to analyze the economic operation conditions and energy efficiency level of the system before and after participation in demand response. The innovation of this paper lies in considering the carbon trading mechanism and solving with the optimized BAS-PSO algorithm. Considering carbon trading can effectively improve the system wind power consumption capacity, and the optimized BAS-PSO algorithm improves the defects of traditional PSO. The simulation analysis results show that the established optimal scheduling model with multiple energy supply devices can realize the optimal operation of the integrated energy system of the park in the demand response environment; the improved BAS-PSO finds the lowest energy consumption within 100 iterations in 21 out of 50 iterations; the improved BAS-PSO algorithm reduces the energy consumption by 27.1 kW on average.
Keywords: Integrated energy systems, carbon trading scheme, the life cycle analysis method, drosophila algorithm, beetle antennae search-particle swarm optimization algorithm (BAS–PSO).
1 Introduction
In arrange to manage the vitality emergency, the world has enthusiastically advanced the advancement of the vitality Internet, and the correlation and complementarity between various energy sources have become increasingly deepened. It has gotten to be an issue that the comprehensive vitality framework has to center on how to make strides in the utilization productivity of comprehensive vitality, diminish the carbon outflows of the framework and diminish the working costs of the framework [1]. The integrated energy system (IES), which includes wind turbines, combined heat and power (CHP) systems, energy storage devices, and other power units, breaks the traditional mode of independent energy operation and planning. The realization of the synergy and coupling of various energy sources will become the future energy development of human society. As it were way to go. Hence, within the preparation of vitality generation, change and utilization, the ideal planning and financial operation of the coordinates vitality framework have pulled in the consideration of household and outside specialists and researchers [2].
At present, Zijian Li et al. fuse the aspen whisker search algorithm with attraction-repulsion and bidirectional learning to propose an improved particle swarm optimization algorithm that adaptively adjusts the inertia weights and learning factors to achieve efficient global optimization search [3]. Xue Kaiyang et al. built IES to show counting wind capacity, gas turbine, and adaptable stack based on the concept of vitality center and the shift ability, transferability and reducibility of the adaptable stack on the request side. The interest in adaptable stack in planning can successfully move forward the comprehensive financial and natural benefits of the framework [4]. Chen Xi et al. increased the absorption rate of wind power by increasing multi-energy complementary coupling, and then introduced stepped carbon trading in the operation scheduling process to further strengthen the wind power absorption capacity, and built a comprehensive energy system optimization operation model with the sum of operating costs, maintenance costs and environmental costs as the objective function [5]. The Shin S Y consider gives future scenarios of how worldwide vitality administration will advance for the G20, each appearing with its qualities, shortcomings, openings and dangers [6]; Heidari A et al. considered vitality extraction, preparing, change, transmission, conveyance and utilization from inside and outside viewpoints and concluded that vitality plays a critical part in approach and advancement, making a difference choice producers and analysts to recognize challenges and define fitting and vigorous procedures [7]. Zawaydeh S surveyed the particular activities of the national vitality arrangement and displayed anticipated CO outflows up to 2020, which can too degree the move to a clean vitality economy, the worldview moves within the vitality blend and the vitality instruction move required to meet the request for a clean tech workforce for EE, RE and CO-free vitality instruction [8].
Territorial moo carbon will play a critical part in the realization of the “double carbon” objective, and there are still numerous key advances to be broken through within the field of arranging and research. In this paper, BAS-PSO calculation is utilized to set up an ideal planning demonstration of coordinates vitality framework with different vitality supply gear. Firstly, the carbon exchanging instrument is presented in the planning to construct a stepped-type carbon exchanging fetched show to compel the carbon outflows of the manufacturing plant. At that point the natural product fly calculation is utilized to decide the introduction of the wind control era and photovoltaic control generation by judging the economy of the wind control era and photovoltaic control era within the development range, and then the target electricity consumption curve and new energy power output curve are fitted. At that point the life cycle investigation strategy was utilized to analyze the carbon outflows created by the electric vitality capacity hardware, and the carbon exchanging component was considered within the framework financial operation show. The BAS-PSO calculation was utilized to illuminate the show, which overcame the issues of neighbourhood optimization and moderate joining speed. At last, the coordinates vitality framework of a commonplace stop is re-enacted to analyze the framework of financial working conditions and vitality proficiency level before and after partaking in the request reaction. The recreation investigation comes about to appear that the set-up operation optimization planning show can realize the ideal operation of the coordinates vitality framework within the stop beneath the request reaction environment, and can successfully direct the integrated vitality framework within the stop to progress the framework vitality effectiveness, progress the utilization rate of key hardware and decrease the operation taken a toll.
2 Carbon Trading Cost Calculation Model
All ventures have carbon emanation rights. Within the carbon exchanging showcase, the starting carbon emanation number of enterprises will be designated at no cost. The allocation methods of initial carbon quota mainly include the baseline method, grandfather method, independent declaration under the cap-and-trade method and auction method. Initial carbon emission rights are generally distributed centrally in CHP units, gas turbines, gas boilers and customary units within the coordinate’s vitality framework [9]. Making carbon exchanging rights a tradable product will offer assistance undertakings to spare vitality and decrease outflows.
2.1 Initial Carbon Trading Cost Calculation Model
Carbon exchanging could be an exchanging instrument to control the diminishment of carbon outflows by changing carbon outflows into commodities, building up lawful carbon outflow rights and permitting them to be bought and sold. The particular operation preparation is appeared in Figure 1.
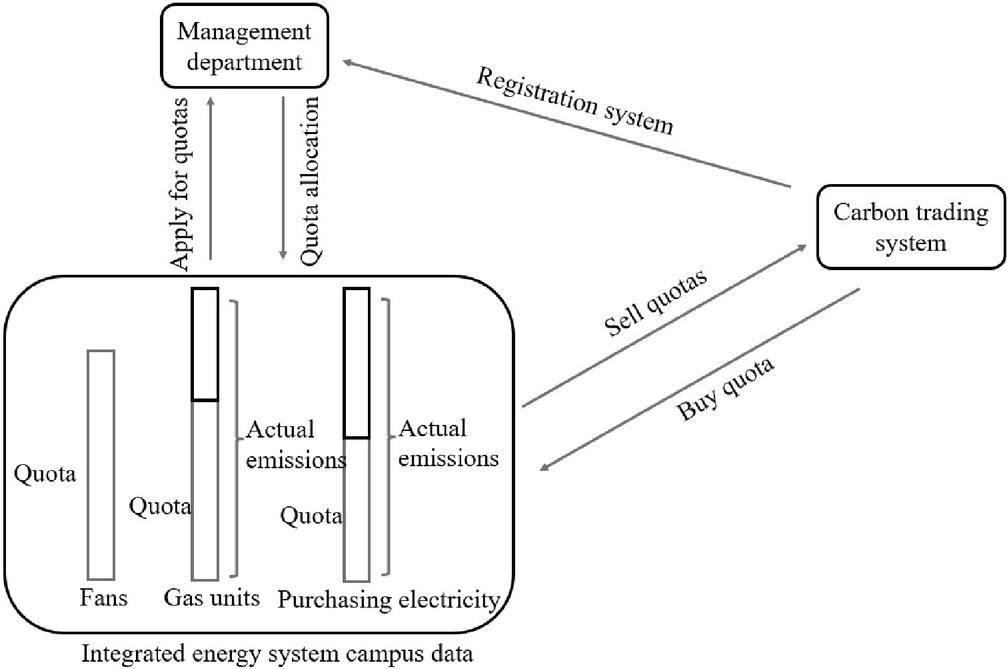
Figure 1 Flow chart of carbon trading operation.
The ecological environment management department takes the comprehensive energy system park as the unit, and allocates the quota free of charge according to the power generation data provided by each unit. When the carbon outflows of outflow sources surpass the designated sum, it is fundamental to buy the overabundance from the carbon exchanging framework. On the opposite, when the emanations of outflow sources are lower than the distributed sum, the remaining sum can be put into the carbon exchanging framework for a deal to get paid [10].
There’s no CO produced within the process of the wind control era. In arrange to form the framework allows need to the utilize wind control to make strides the level of wind control utilization, wind turbine control era is included within the free carbon emanation share show to make strides in the economy of wind control era. At display, China’s power era units are still ruled by the warm control era, which accounts for 70% of the entire control era. Hence, the issue of clean and low-carbon control supply cannot be fathomed by employing an expansive sum of acquired control [11]. In arrange to diminish the outsourcing control of the 36 coordinate’s vitality framework, the utilization of outsourcing control within the built framework requires the buy of carbon outflow rights.
The calculation model of free carbon emissions includes wind power, purchased power and gas turbine units. The specific formula is as follows.
| (1) | ||
| (2) | ||
| (3) | ||
| (4) |
Where: , , and speak to the overall carbon outflow standard, comparing free carbon emanation share for control framework purchase, gas turbine and wind power respectively; is wind power generation power; represents the control obtained from the network; Speaks to the carbon outflow standard per unit of control era, taken as 0.799 t/(MWh); and allude to control era and warming control of gas turbine; represents the heating power of gas fired boiler; represents the carbon emission quota per unit calorific value, taking 0.065 t/GJ; it refers to the conversion coefficient of generating capacity converted into calorific value, taking 6 MJ/(kWh).
In the actual carbon emission sources, there are two carbon emission sources, namely, purchased electric power and gas turbine. The formula is as follows.
| (5) | ||
| (6) | ||
| (7) |
Where: , , represent the whole real carbon outflows, and the genuine carbon emanations comparing to the buy of control by gas turbine units and control frameworks; represents the actual carbon emission per unit calorific value, taking 0.102 t/GJ; it refers to the actual carbon emission of unit electricity purchased by the power grid, taken as 1.08 t/(MWh).
In arrange to encourage control of the overall carbon outflows, this paper isolates the carbon emanations into six districts and builds up a stepped carbon exchanging demonstrate [12]. Combined punishment coefficient (Increment run of carbon exchanging cost), so that the carbon exchanging cost increments in turn with the punishment coefficient. The higher the carbon outflows, the higher the carbon exchange takes a toll, in this way constraining the development of carbon outflows, as appeared in Equation (8).
| (8) |
Where: is the carbon trading cost; c is the carbon trading price on the market. The carbon trading price is generally between 120 and 280 yuan, which is affected by carbon emission reduction policies and trading markets. 200 yuan is taken in the text; is the range of carbon trading price growth, taking 25%; L is the length of carbon emanation extension, taking 80 t.
2.2 Ladder Carbon Transaction Cost Model
At display, carbon quantity is primarily utilized for gratis dissemination and paid dispersion [13]. The carbon outflow sources within the plant range incorporate: control buy by prevalent coal control units, CHP, gas-fired boilers, and natural gas supplementary combustion. The initial carbon quota model is
| (9) |
In Formula (9), , , , and are respectively the carbon quota of comprehensive energy, power purchase, CHP, gas boiler and gas load in the plant area; , , is the carbon share of unit control era, unit warm supply and unit characteristic gas utilization at time t separately; is the transformation coefficient of electric and warm control; is the control buy of the plant in t period; When , are t respectively, CHP section output electric heat power; is the warm yield control of gas terminated kettle in t period; is the demand for supplementary gas load in t period.
There is a certain amount of carbon trade fair in the market, and no additional fees need to be paid within the free amount, and the remaining free amount can be traded. If the amount exceeds the free amount, a certain amount of fees needs to be paid, and certain penalties will be given to enterprises. The more the amount exceeds [14], the more the fees will be paid, and a ladder model with penalty factors will be used, namely
| (10) |
In Equation (10), is the carbon exchange taken a toll within the plant framework; is the carbon exchanging cost; Is the length of carbon outflow extend; Is the punishment figure; is the carbon emanation of control buy, CHP unit and gas kettle within the plant region; is the carbon standard of the coordinates vitality framework.
2.3 Economic Dispatch of Carbon Transaction Cost
2.3.1 Objective function
The CHPED issue is as a rule portrayed as an optimization issue with one or more optimization destinations and a set of profoundly nonlinear and nonsmoothed imperatives, counting supply and request adjust, capacity limitations and other limitations. Financial benefits and natural assurance benefits are critical markers for the ideal operation of the comprehensive vitality framework within the plant range. Build up the financial ideal show of the comprehensive vitality framework within the plant range from both financial and natural viewpoints, and quantitatively investigations the effect of the presentation of cogeneration and modern vitality subsystems on the working wage of the plant range [15].
With the objective of minimizing the working taken a toll of the treatment plant, the objective work incorporates the working fetched of unadulterated generator sets, the working fetched of cogeneration components, the working taken a toll of warm creating units as it were and the control buy fetched of the network, to be specific
| (11) |
In Formula (11), , and are the operating costs of pure generator sets, cogeneration units and pure heat generating units; is the power purchase cost of the system; is the carbon trading cost of the plant; Operation and maintenance cost of photo thermal power station.
(1) The operating cost of pure motor unit is
| (12) |
(2) The operation cost of cogeneration components is
(3) The operating cost of pure heat generating unit is
| (14) |
(4) The power purchase cost of the grid is
| (15) |
(5) See Formula (10) for details of carbon transaction cost in the plant area
(6) The operation and upkeep fetched of optical warm control station is
| (16) |
Where, , , , are the number of pure generator units, cogeneration units, pure heat generating units and clean energy units; and are the control and warm yield of the i unit of this sort; is the fetched coefficient of the framework operation demonstrate, is the warm power proportion of the cogeneration unit, kJ/kW; , are the cost and amount of power obtained from the framework at time t; is the operation and support fetched coefficient of the photo warm control plant; is the electric power output by the photothermal power station [16].
2.3.2 Constraint condition
(1) System electric and thermal power balance constraints
| (17) | |
| (18) |
Where: and are the all power and thermal energy demand of the system; is the number of heat storage tanks; is heat supply.
(2) Upper and lower limits of capacity of each component of the framework
| (19) | |
| (20) | |
| (21) | |
| (22) | |
| (23) | |
| (24) | |
| (25) |
Where: is upper and lower limits of power generation only for generator sets, cogeneration units and clean energy; is biggest and smallest limits of power generation of cogeneration units, heat generation only units, clean energy units and the biggest and smallest limits of capacity of heat storage tanks [17, 18].
3 Algorithm Based on BAS-PSO
3.1 Target Power Consumption Curve and New Energy Power Output Curve Fitting
3.1.1 Judge the economy of wind power and photovoltaic
Wind control yield show. The wind control yield demonstrate in this paper is built as takes after [19]:
| (26) |
Where, is the rated power, in W; v is the real wind speed; is the cut in wind speed; is the cut out wind speed; is the rated wind speed. The unit of the above wind speed is m/s.
Photovoltaic output model. The PV output model in this article is built as follows:
| (27) |
Where, is the irradiation range of the unit photovoltaic board, in m; is the light radiation intensity per unit area, in W/m; is the energy conversion efficiency of photovoltaic modules; is the conversion efficiency of the inverter, in %.
Economic judgment. Assuming that the number of years of wind power operation is x years, the NPV per year of wind power during operation is [20]:
| (28) | ||
| (29) |
Where, P refers to the time-sharing power cost; is the power purchase price of the enterprise; is the government subsidized electricity price; refers to the annual total power generation of wind power, and refers to the annual electricity sales of the enterprise; k is the grid connection rate of new energy power generation; is the unit wind power construction price, is the wind power output, and is the typical annual wind power daily generation hour matrix, and the unit is h.
Assuming that the PV operation years are y years, the PV annual NPV of the grid during operation is:
| (30) | ||
| (31) |
Where, is the typical annual photovoltaic daily power generation hour matrix, and the unit is h.
3.1.2 Fitting wind and light output curve
If wind power is economical and photovoltaic is not economical. In this paper, wind power annual output curve and target year power load curve EL are fitted [21].
| (32) |
Among them, Nwd is the number of wind power construction, unit: piece.
If wind power is not economical and photovoltaic is economical. In this paper, the photovoltaic annual output curve and the target year electric load curve EL are fitted.
| (33) |
Among them, Npv is the quantity of photovoltaic construction, unit: piece.
If both wind power and photovoltaic are economical. In this paper, wind control yearly yield bend, photovoltaic yearly yield bend and target year control stack bend EL are fitted.
Constraints. The construction quantity of various equipment shall be limited to a certain range due to actual factors [22]:
| (34) |
Choose the optimal wind and light ratio based on the principle of economy:
Construction period model:
| (35) |
Where is the cash outflow; is the cash inflow, is the environmental discharge penalty cost, and is the discount rate.
Operation Period Model:
| (36) |
Where is the cash outflow; is the cash inflow.
3.2 Analysing Carbon Emissions Using Life Cycle
In order to achieve the purpose of low carbon and economic operation of the system, it is necessary to consider the important factor of carbon emission. In addition to the large amount of carbon emissions from the coal distribution network, CCHP, new energy units and gas furnaces in the system, the carbon emissions from the transmission and distribution of electric energy storage devices cannot be ignored [23]. The indirect carbon emissions of electric energy storage devices in the total carbon emissions of the system are analyzed by the life cycle analysis method, according to the three major steps of the life cycle analysis method [24]. Firstly, the whole life cycle of electric energy storage equipment is defined as spheroidization, raw material mixing, centrifugal washing, drying and classification, waste reuse, and the production and transportation of energy and energy raw materials related to the transmission of energy; the list of environmental pollutants emitted in the whole life cycle process is determined to contain CO, NO, and CH, but all pollutants need to be uniformly converted into total CO emissions per unit capacity [25].
The environmental pollutants discharged in the entire life cycle analysis of electric power storage instrument can be divided into two stages: equipment construction and equipment transportation. The carbon emissions made by electric energy storage instrument during operation are very small and negligible.
| (37) |
In Formula (37), is the carbon emission coefficient of electric power storage instrument construction link; is the collection of greenhouse gases that will be produced in the production process; refers to the project stage collection of production links, including raw material production, raw material transportation and energy production; is the number of all kinds of materials used in production, mainly raw coal, crude oil and natural gas; is the conversion coefficient of unit standard electricity and energy consumption; is the energy consumption of the i material used in the j stage of the unit standard cathode material; is the carbon emission factor of the k greenhouse gas; is the emission intensity of greenhouse gas of category k using the i material in phase j; is the unit loss coefficient of the i material in the production link.
| (38) |
In Formula (38), is the carbon emission coefficient of electric power storage instrument in the transportation link; A refers to the collection of transportation modes of electric energy storage equipment, mainly highway transportation, railway transportation and waterway transportation; B refers to the collection of various fuels and energies used in equipment transportation, mainly including crude oil and raw coal; is the conversion coefficient of unit standard electricity and energy consumption; is the energy consumption of the fuel b used in the transportation mode a; U is the emission intensity of greenhouse gases of category k generated by the fuel of category b used by the mode a; is the carbon emission factor of category k greenhouse gas; is the transportation distance of the a transportation mode using the b fuel energy; refers to the proportion of electric energy storage equipment transported by category a transportation mode in the total equipment [26].
3.3 BAS-PSO Algorithm Solution
3.3.1 Particle Swarm Optimization (PSO)
PSO sets massless particles with only speed and position attributes in the search space. Each particle is independent of its own speed and position Find the optimal solution, and find the particle with the best individual extreme value among all particles by sharing the information of individual extreme value in the particle population [27]. The formula of particle velocity and position is as follows:
| (40) |
Wherein, and represent acceleration factors, which are used to help particles balance the capacity of native search and global study ; it can be used to describe the native and global optimization capacity. and are random numbers between (0,1). and are the optimal solutions of the first k iterations of particle and particle population, respectively.
3.3.2 Beetle antennae search algorithm (BAS)
BAS algorithm is a heuristic simulation optimization search algorithm composed in 2017 to find the better way of the neutral function by simulating the process of longicorn beetles searching for food. The longicorn beetle mainly uses its long beard to sense the smell of food, so as to control the direction of movement and distance to search the actual location of food. Its advantages lie in the small number of individuals in the search process and the small search cost consumed. It is more suitable for the optimization process of low dimensional problems, and can achieve efficient automatic optimization without the information of objective function and specific gradient [28].
As the position of the longicorn beetle moves, the orientation of its left and right whiskers will also change, as defined below:
| (41) |
Where rands() is a random role; k represents the aspect of space. The left and right positions are determined by the direction vector, and the formula is as follows:
| (42) | ||
| (43) |
Where, t represents the amount of current iterations, with represent the positions of the left and right whiskers of the longicorn beetle in the search space at iteration t; is the location of the center of mass of the longicorn beetle at iteration t; is the distance between two whiskers at iteration t, indicating the exploration ability of particles. The moving direction and distance of the longicorn beetle latter are as follows:
| (44) |
Where f() is the fitness function; ) and respectively represent the healthy values of the left and right sides at iteration t; Where sign0 is a symbolic function used to separate the symbols of the function; ) is the step factor, and its calculation formula is as follows:
| (45) | ||
| (46) |
Among them, is the initial step size; represents the search step size at iteration t, and the distance between two whiskers can vary with the step size adjust the change of ; g is the attenuation coefficient of the iteration step size, c is the adjustment coefficient of the search step size, and g and c are parameters that can be customized according to the problem scenario. Here, and are set.
3.3.3 BAS-PSO algorithm
The BAS-PSO algorithm is gotten by combining the Tianniu whisker search algorithm with the particle swarm intelligence algorithm. Each particle can be regarded as a longicorn, and the process of setting its initial position and speed is the same as that of the standard PSO. Combining the search idea of the longicorn whisker looking algorithm, on the basis of increasing the judgment of each individual in the population on the environment space, we can determine a better result by comparing the healthy function values reflecting the left and right whiskers during each iteration, so as to obtain the updated direction and coordinates of the longicorn herd [29]. The calculation process of BAS-PSO optimization algorithm is seen in Figure 2.
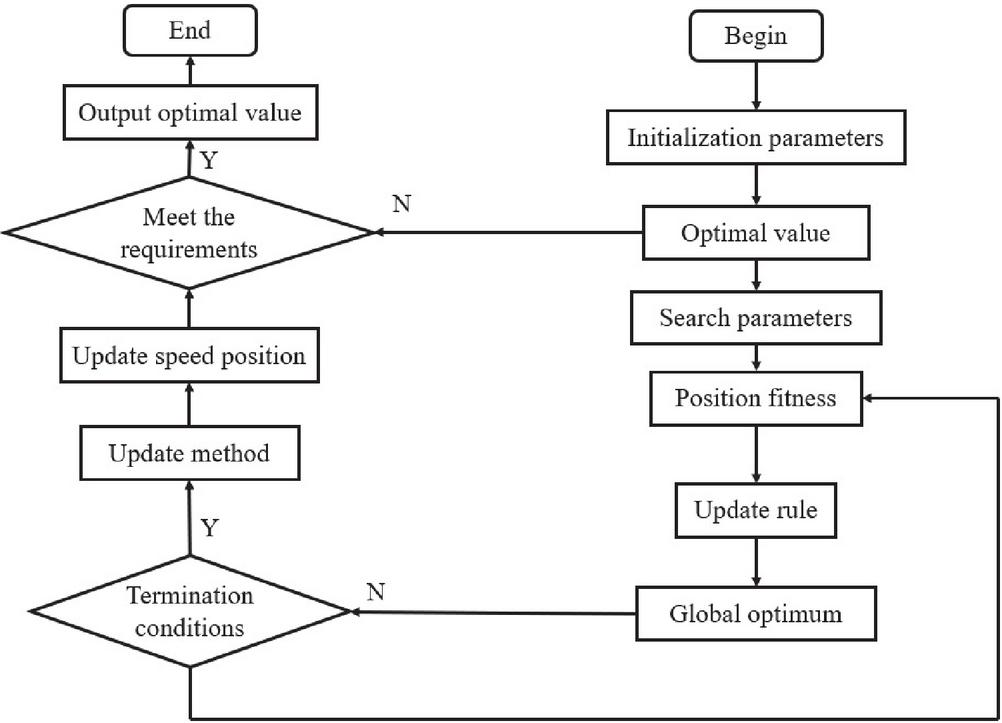
Figure 2 BAS-PSO optimization algorithm process.
(1) Initialize. First, set the size of the particle swarm to N and the inertia factor to . The studying elements are , , , and is the distance between the left and right tendrils of the longicorn beetle at the initial time;
(2) Casually assign the initial velocity and initial location of a particle, calculate the fitness function value of the particle [30], take the present position of the particle as the personal optimal way pbest, and obtain the current global optimal way gbest by comparing the individual optimal solutions of all particles.
(3) Iteratively updates particle speed. Set search parameter step , according to the position of the particle, calculate the particle position and the fitness ) and of the left and right whiskers of the particle respectively, and obtain the updated formula of the particle speed composed of the fitness values of the two whiskers, as shown in Formula (47).
| (47) |
By comparing the health of each particle at the present position, the current personal optimal way pbest and global optimal way gbest are obtained. Combining the above two speed update rules, the speed update formula of each particle is obtained as follows:
| (48) |
(4) After the iteration process is finished, the global optimal solution and the location of the optimal way can be obtained.
4 Simulation Analysis
4.1 Basic Data
For verify the rationality of the manipulation optimization plan and optimization model put in this article, a typical electric heating integrated power system in a park is taken as an instance for simulation analysis. In this integrated energy system, the capacity of CHP unit is 2000 kW, the capacity of PV unit is 1000 kW, and the capacity of ice storage air conditioning is 2500 kW. Distributed generation of power grid in the region where the system is located. Table 1 shows the typical daily load of the system in summer.
Table 1 Typical daily load of the system in summer
| PowerTime | 00:00 | 04:00 | 08:00 | 12:00 | 16:00 | 20:00 | 24:00 |
| Heat load | 2100 | 1850 | 2030 | 2350 | 2300 | 2250 | 2000 |
| Electrical load | 3050 | 2430 | 3100 | 3250 | 4260 | 4100 | 3300 |
According to the actual heating situation of the park in the region, the fixed electricity price is 1.20 yuan/kW, the cooling price is 0.38 yuan/kW, and the industrial natural gas price is 3.25 yuan/m. The interval length of carbon emissions is 500 kg, the carbon business benchmark price is 0.35 yuan/kg, and the trading price rasing rate is 25%.
In arrange to confirm the viability of the step carbon exchanging component proposed in this paper, two working scenarios are utilized to recreate the working conditions of the framework some time recently and after taking an interest in request reaction, to consider the effect of distinctive power cost instruments on the financial operation and vitality effectiveness level of the coordinate’s vitality framework. The introductory populace number of the calculation is set to 200, and the number of cycles is set to 100 eras.
Situation 1: The coordinates framework does not take part within the power grid request reaction. The most control sources of the framework are disseminated photovoltaic, CHP framework and control buy from the control framework. The power cost is settled. The system’s cooling supply in summer is basically the combined cooling of CHP framework and ice capacity discuss conditioning.
Situation 2: The coordinates vitality framework partakes within the grid request reaction. The most control sources of the framework are conveyed photovoltaic, CHP framework and framework control buy. The power cost is time of utilize power cost. The cooling supply of the framework in summer is basically the combined cooling of CHP framework and ice capacity air-conditioning.
4.2 Analysis of Operation Optimization Results
In Situation 1, the coordinates vitality framework does not take an interest within the framework request reaction, and the framework orchestrates the unit yield on the introduce of guaranteeing the user’s request for electric vitality and cooling. Figure 3 shows the optimal dispatching curve of electric output of each equipment in summer in Scenario 1, and Figure 4 shows the energy storage charging state and optimal dispatching curve in Scenario 1.

Figure 3 Scenario 1 optimal dispatching curve of electric output of each equipment in summer.
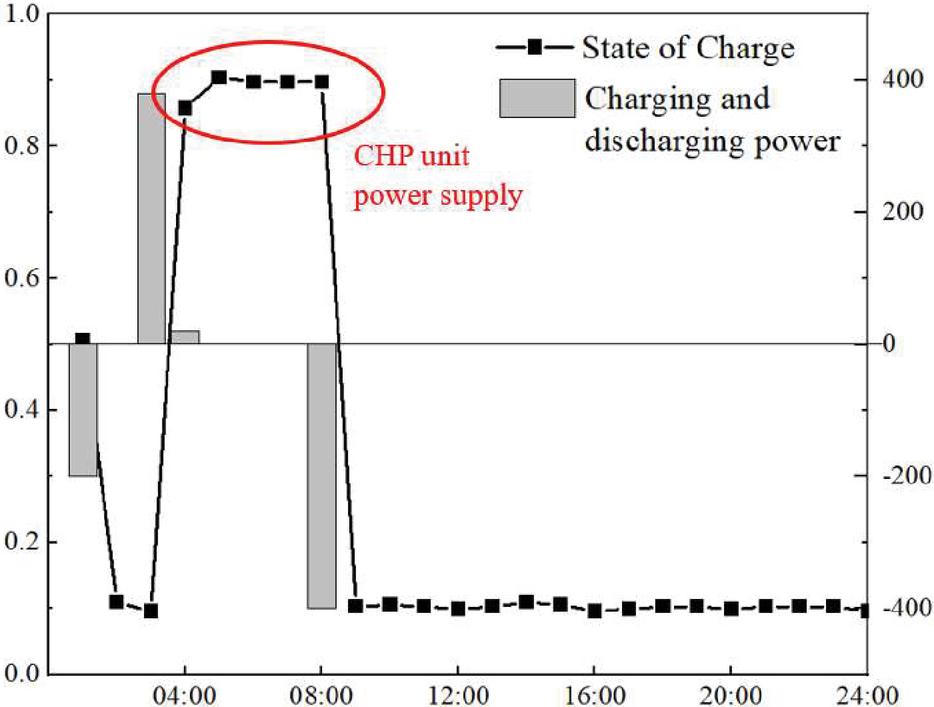
Figure 4 Scenario 1 energy storage state of charge and optimal dispatch curve.
It can be shown from Figures 3 to 4 that in Scenario 1, the charge state is maximum from 4 to 8 o’clock, charging before 4 o’clock and discharging after 8 o’clock. As the grid price is fixed, the system calls CHP units and ice storage air conditioners for cooling, and photovoltaic generator units and CHP units for power supply. The insufficient power is supplemented through the grid. In this scenario, the operation mode of CHP unit is “power is determined by heat”, and the system and power grid are in a passive interaction state.
In Scenario 2, the integrated power system participates in the grid demand response. On the premise of ensuring the user’s demand for electric energy and cooling, the system actively participates in the grid interaction and arranges the output of electric heating units. Figure 5 shows the optimal dispatching curve of electric output of each equipment in summer in Scenario 2, and Figure 6 shows the energy storage charging state and optimal dispatching curve in Scenario 2.
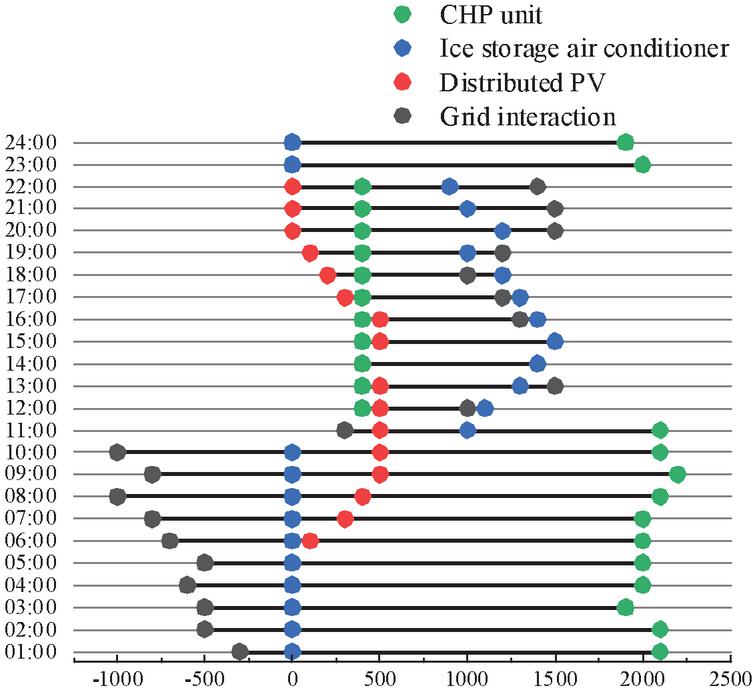
Figure 5 Scenario 2 optimal dispatching curve of electric output of each equipment in summer.

Figure 6 Scenario 2 energy storage state of charge and optimal dispatch curve.
It can be seen from Figures 5 to 6 that in Situation 2, the charge state is maximum from 2 to 11 o’clock, charging before 2 o’clock and discharging after 11 o’clock. The framework will organize the unit yield concurring to the lattice power cost since the framework actualizes crest and valley power costs. In the peak period of electricity price, CHP units are preferentially called to provide cooling sources, while distributed photovoltaic and CHP units are called to supply power. The insufficient electricity is supplemented by the grid. In the low electricity price stage, the system gives priority to calling the ice storage air conditioner to provide the cooling source, and then calls the CHP unit to supplement when the cooling is insufficient. In this scenario, the operation mode of CHP unit is relatively flexible, and the system and power grid are in a state of active response and active interaction.
In arrange to assist dissect the control impact after the calculation preparing, this paper chooses the information within the test set for investigation. Table 2 appears the operation costs of the integrated vitality framework completely different periods beneath distinctive strategies. After considering the comprehensive request reaction, the full taken a toll amid the 07:00-09:00 and 17:00-20:00 power cost top hours is altogether diminished, and portion of the power request is exchanged to other periods.
Table 2 Operating costs of integrated energy system in different periods under different methods
| CostTime | 02: | 04: | 06: | 08: | 10: | 12: | 14: | 16: | 18: | 20: | 22: | 24: |
| 00 | 00 | 00 | 00 | 00 | 00 | 00 | 00 | 00 | 00 | 00 | 00 | |
| Before considering | 251 | 263 | 216 | 428 | 511 | 471 | 581 | 467 | 1006 | 1151 | 671 | 314 |
| After consideration | 247 | 273 | 259 | 310 | 436 | 448 | 597 | 514 | 872 | 987 | 605 | 342 |
According to Figure 7 and the above analysis, BAS-PSO can save more energy than PSO, and can reduce energy consumption by 27.1 KW on average in the previous use scenario; Compared with PSO, the standard deviation of BAS-PSO calculation results is smaller, and the results of multiple calculations are smaller, that is, the optimization performance is more stable. If you participate in actual application scenarios, you can effectively ensure the normal manipulation of the system. In the calculation process, it is also found that when PSO is used for energy consumption optimization, particles are very easy to fall into the native optimal value and cannot jump out early in the calculation, as shown in Figure 7, the highest point of the PSO curve is 981 KW. In this optimization calculation, particle swarm has found the optimal value in the 122nd iteration, while the remaining 878 iterations have not found a solution with lower energy consumption, but BAS-PSO can find a point with lower energy consumption faster. Statistics show that BAS-PSO has found the lowest energy consumption within 100 iterations for 21 of the 50 optimization searches, and the number of iterations using PSO to find the lowest energy consumption is about 150. BAS-PSO also has certain advantages in optimization speed.

Figure 7 Comparison of 50 optimization results between PSO and BAS-PSO at the same load rate.
The comparison of the basic PSO and BAS-PSO energy savings rates is shown in Table 3. The maximum energy saving rate is 3.8% and the average energy saving rate is 1.8% for the hybrid algorithm compared with PSO under 1 group load distribution, and the maximum energy saving rate is 4.6% and the average energy saving rate is 2.8% for the hybrid algorithm compared with PSO under 2 group load distribution.
Table 3 Statistics of energy saving rate of BAS-PSO compared to PSO under variable load rate
| Load Ratio | 1 Group Energy Saving Rate | 2 Group Energy Saving Rate |
| 0.3 | 0.6 | 1.1 |
| 0.4 | 0.8 | 1.8 |
| 0.5 | 1.1 | 2.3 |
| 0.6 | 2.6 | 4.6 |
| 0.7 | 3.8 | 3.8 |
| 0.8 | 2.1 | 3.4 |
| Average energy saving rate | 1.8 | 2.8 |
5 Conclusion
With the continuous promotion of low-carbon development process, integrated energy system (IES) has gradually become an important supporting technology to achieve the emission reduction target. In this paper, we establish an optimal dispatching model of integrated energy system containing multiple energy supply devices, introduce carbon trading mechanism, then use fruit fly algorithm to fit the target electricity consumption curve and new energy power output curve, optimize BAS-PSO algorithm to solve the model, and finally simulate and analyze. The specific research findings are as follows.
(I) In this paper, a carbon trading mechanism is introduced into the dispatching model to construct a stepped carbon trading cost model. The peak-shaving and valley-filling effects in power and heat dispatch help the system improve its stable operation, while the introduction of carbon trading mechanism in conjunction with the CHP system effectively reduces the carbon emissions and operating costs of the plant.
(II) In this paper, the life-cycle analysis is used to study the life-cycle carbon emissions of electric energy storage equipment, and the production and transportation stages are analyzed separately, so that the carbon emissions of electric energy storage equipment can be made concrete. The simulation results show that BAS-PSO finds the lowest energy consumption in 21 out of 50 iterations within 100 iterations, which has a significant advantage in the speed of finding the lowest energy consumption and reduces the energy consumption by 27.1 kW on average.
(III) In this paper, a typical park electric and thermal integrated energy system is used as an example for simulation analysis, and two scenarios of whether the integrated system participates in grid demand response or not are set up respectively. The results show that the operation optimization model established in this paper can realize the optimal operation of the integrated energy system of the park under different electricity price mechanisms. Compared with the traditional operating conditions, the scenario considering grid demand response has obvious advantages in improving system energy efficiency, increasing utilization of key equipment and reducing operating costs.
In addition, the optimal scheduling model of the integrated energy system with multiple energy supply equipment proposed in this paper has not yet considered the energy loss and dynamic characteristics of the electric-thermal network, and the dynamic operation model of the equipment and network will be studied subsequently to build reasonable energy loss evaluation indexes and formulate more accurate scheduling strategies. Although the impact of carbon trading mechanism on the operating conditions of integrated energy system is considered in this paper, with the acceleration of the national energy decarbonization process, the carbon trading market mechanism involving integrated energy service providers, power generators, load aggregators, etc. and the low carbon economy optimization of the system under the multi-participation mechanism will become the focus of the next stage of research.
References
[1] Zhang K, Xu N, Ling Y, et al. Economic Dispatch Analysis of Comprehensive Energy System Considering Carbon Trading[C]//IOP Conference Series: Earth and Environmental Science. IOP Publishing, 2020, 546(2): 022058.
[2] Wang J, Mao J, Hao R, et al. Multi-energy coupling analysis and optimal scheduling of regional integrated energy system[J]. Energy, 2022, 254: 124482.
[3] Li ZJ, Guo PQ, Ma NN, et al. Distributed power distribution network reactive power optimization with dual strategy particle swarm algorithm[J]. Southern Power Grid Technology, 2022.
[4] Xue Kaiyang, Chu Ying, Ling Zi, et al. Low-carbon economic optimal dispatch of integrated energy system considering flexible load[J]. Renewable Energy Resources, 2019, 8: 1206–1213.
[5] Chen Xi, Yuan Mengling, Wang Song. Optimal operation of integrated energy system considering the impact of carbon trading on wind power consumption[J]. Journal of Chongqing University of Technology (Natural Science), 2022, 36(1): 268–276.
[6] Shin S Y. The Evolution of Global Energy Governance: Scenario Analysis with a Focus on the G20[J]. Strategic Planning for Energy and the Environment, 2020: 199–218.
[7] Heidari A, Aslani A, Hajinezhad A, et al. Strategic analysis of Iran’s energy system[J]. Strategic Planning for Energy and the Environment, 2017, 37(1): 56–79.
[8] Zawaydeh S. Energy efficiency, renewable energy targets, and CO reductions expected by 2020[J]. Strategic Planning for Energy and the Environment, 2015, 35(2): 18–47.
[9] Zhong W, Pan X, Zhang Z, et al. Two Stage Optimization Model Considering Demand Response Dispatch Value of Thermoelectric Load[C]//2021 6th Asia Conference on Power and Electrical Engineering (ACPEE). IEEE, 2021: 1378–1384.
[10] Noorollahi Y, Pourarshad M, Veisi A. The synergy of renewable energies for sustainable energy systems development in oil-rich nations; case of Iran[J]. Renewable Energy, 2021, 173: 561–568.
[11] Dunnan L I U, Yuan G, Lingxiang W, et al. Optimal scheduling of Park level integrated energy system considering electrothermal coupling[C]//E3S Web of Conferences. EDP Sciences, 2021, 236: 02008.
[12] Proceedings of PURPLE MOUNTAIN FORUM 2019-International Forum on Smart Grid Protection and Control: Volume II[M]. Springer, 2019.
[13] Wang Y, Ma Y, Song F, et al. Economic and efficient multi-objective operation optimization of integrated energy system considering electro-thermal demand response[J]. Energy, 2020, 205: 118022.
[14] Yang D, Wang M. Optimal operation of an integrated energy system by considering the multi energy coupling, AC-DC topology and demand responses[J]. International Journal of Electrical Power & Energy Systems, 2021, 129: 106826.
[15] Li Hongwei, Li Tingyu, Chen Junhua, et al. Optimization operation of integrated energy system containing photovoltaic solar heat in a natural gas processing plant considering carbon trading[J]. Science Technology and Engineering, 2022.
[16] Wang Y, Li R, Dong H, et al. Capacity planning and optimization of business park-level integrated energy system based on investment constraints[J]. Energy, 2019, 189: 116345.
[17] Liu X. Research on optimal placement of low-carbon equipment capacity in integrated energy system considering carbon emission and carbon trading[J]. International Journal of Energy Research, 2022.
[18] Zhang Y, Wu Y, Wang Y, et al. Optimal Scheduling of Integrated Energy System Based on Price Demand Response Mechanism[C]//2022 IEEE International Conference on Mechatronics and Automation (ICMA). IEEE, 2022: 214–218.
[19] Zeng A, Hao S, Ning J, et al. Multiobjective Optimized Dispatching for Integrated Energy System Based on Hierarchical Progressive Parallel NSGA-II Algorithm[J]. Mathematical Problems in Engineering, 2020.
[20] Mao Zhibin, Zhou Jun, Chen Qi, et al. Research on optimal allocation of capacity and economic benefits of integrated energy system[J]. Price Theory & Practice, 2021.
[21] Sun W, Chen Y, Wang J, et al. Research on TVD Control of Cornering Energy Consumption for Distributed Drive Electric Vehicles Based on PMP[J]. Energies, 2022, 15(7): 2641.
[22] Zhou S, Sun K, Wu Z, et al. Optimized operation method of small and medium-sized integrated energy system for P2G equipment under strong uncertainty[J]. Energy, 2020, 199: 117269.
[23] Liu X, Li X, Tian J, et al. Low-carbon economic dispatch of integrated electricity and natural gas energy system considering carbon capture device[J]. Transactions of the Institute of Measurement and Control, 2021: 01423312211060572.
[24] Li Q, Wei A, Zhang Z. Application of economic load distribution of power system based on BAS-PSO[C]//IOP Conference Series: Materials Science and Engineering. IOP Publishing, 2019, 490(7): 072056.
[25] Ren Dejun, Liu Zhifang, Gao Feng, et al. Research on Optimization of Electrothermal Collaborative Operation of Integrated Energy System in Park Considering Carbon Trading Mechanism and Demand Response[J]. Thermal Power Generation, 2022.
[26] Li C, Zhu S, Sun Z, et al. BAS Optimized ELM for KUKA iiwa Robot Learning[J]. IEEE Transactions on Circuits and Systems II: Express Briefs, 2020, 68(6): 1987–1991.
[27] Zhou S, Hu Z, Gu W, et al. Combined heat and power system intelligent economic dispatch: A deep reinforcement learning approach[J]. International journal of electrical power & energy systems, 2020, 120: 106016.
[28] Chen Yang, Yao Ye. Energy-saving control of large-scale central air conditioning system based on longhorn beetle-particle swarm optimization algorithm[J]. Journal of Refrigeration, 2021.
[29] Wei W, Xu L, Xu J, et al. Coupled dispatching of regional integrated energy system under an electric-traffic environment considering user equilibrium theory[J]. Energy Reports, 2022, 8: 8939–8952.
[30] Niu H, Yu F, Li B, et al. Research on operation optimization of integrated energy system[C]//IOP Conference Series: Earth and Environmental Science. IOP Publishing, 2019, 267(3): 032094.
Biographies

Wei Xiong has successively presided over more than 10 national grid science and technology and informatization projects, including the national grid electricity sales management platform, user energy consumption management platform, user load forecasting platform, and power user value-added service mode, published more than 10 papers and applied for 8 patents.

Xiangyue Chen (September 1988), male, Han nationality, born in Xiangtan, Hunan Province, bachelor’s degree, engineer, mainly engaged in electric power marketing.

Chen Liu (1990.9-), male, Han nationality, born in Yiyang, Hunan, master, economist, main research: comprehensive smart energy.

Meng Huang (November, 1983), male, Han nationality, born in Qingdao, Shandong Province, has a master’s degree and is a senior engineer. His main research is: comprehensive smart energy.

Jia Tong received the bachelor’s degree in management from Hebei University of Architecture in 2019. She is currently studying as a graduate student at the School of Management of Xi’an University of Science and Technology. Her research areas and directions include PPP project management.
Strategic Planning for Energy and the Environment, Vol. 42_4, 673–702.
doi: 10.13052/spee1048-5236.4245
© 2023 River Publishers