Application of Gray Expansion Model in Energy Economic Analysis and Load Forecasting
Yin Jie
School of Management, Xi’an University of Science and Technology, Xi’an Shaanxi 710054, China
E-mail: 20202097037@stu.xust.edu.cn
Received 17 March 2023; Accepted 21 March 2023; Publication 18 December 2023
Abstract
Objective and effective prediction of energy consumption can not only optimize the energy consumption structure, but also provide important information for the government to formulate energy conservation and emission reduction measures. With the development of new energy sources and changes in the global energy consumption structure, historical energy data that are too old may no longer be reliable for forecasting, which leads to a decrease in the amount of information on energy, and the gray theory, which is applicable to “poor information”, has gained attention. Firstly, the optimization of energy economic objectives and transformation path methods at this stage is clarified; then, the DEA-Malmqusit model is used to improve the shortcomings of the traditional model that can only compare different cross-sections at the same time node, and to evaluate and analyze the full-factor multi-indicators of energy enterprises in terms of technological empowerment, environmental dynamics, and economic output efficiency; finally, the LEAPS-based energy system consumption and load capacity prediction model. The results show that the traditional algorithm is not accurate enough and has some deviation when the energy raw data fluctuates a lot. The algorithm proposed in this paper still gives a better prediction, predicting a city’s carbon emission to be 65,240,100 tons in 2024, with a 3.6% increase in energy output year by year.
Keywords: Energy consumption, gray theory, load capacity, DEA-Malmqusit model, LEAPS model.
1 Introduction
Since the industrial revolution, the climate situation has become increasingly severe due to the massive emission of greenhouse gases, and low-carbon development has become a necessary path for countries around the world to address climate change. In the global low-carbon transition process, developed countries and organizations such as the United States, Japan, Canada, and the European Union have formulated climate strategies and pledged to achieve net zero carbon dioxide emissions by 2050 [1]. In September 2020, China announced that it would strive to achieve “peak carbon” by 2030 and “carbon neutrality” by 2060, signaling a further acceleration of China’s low-carbon development. Grey prediction is a method of predicting systems containing uncertain factors. Grey prediction identifies the degree of differences in development trends among system factors, i.e. conducts correlation analysis, and generates and processes raw data to find the patterns of system changes. It generates data sequences with strong regularity, and then establishes corresponding differential equation models to predict the future development trends of things. It constructs a grey prediction model using a series of quantity values observed at equal time intervals that reflect the characteristics of the predicted object, to predict the feature quantity at a certain time in the future or the time to reach a certain feature quantity.
To achieve low-carbon development, the energy industry, which accounts for a large share of carbon emissions, has become the main force in energy conservation and emission reduction [2, 3]. To meet the challenges of large-scale renewable energy access, low-carbon integrated energy systems can fully mobilize the flexible resources of each energy link, as shown in Figure 1. In China, since the inclusion of integrated energy systems in the 13th Five-Year Plan, several integrated energy demonstration projects, such as the Tianjin Sino-Singapore Eco-city, Jiangsu Tongli Integrated Energy Service Center, and Shanghai Chongming Island, have demonstrated the potential of integrated energy systems for energy conservation and emission reduction. The 14th Five-Year Plan for Energy Development emphasizes continuing to promote the active and orderly development of integrated energy systems and the “smart and green enhancement of energy use scenarios”. The “European Green Deal” proposed by the EU in 2019 and the “Green Growth Strategy” proposed by Japan in 2020, and other low-carbon development strategies of various organizations and countries have also clearly defined the important value of integrated energy systems [4]. Against the background of increasing demand for carbon reduction, how to deeply promote the process of energy system emission reduction and achieve a balance between economic and environmental goals has become an important issue nowadays. Therefore, it is urgent to conduct in-depth research on low-carbon integrated energy systems.

Figure 1 Flexible resources of low-carbon integrated energy system.
Many scholars believe that a low-carbon integrated energy system is a multi-energy system that actively or passively reduces carbon emissions by integrating carbon capture technologies, increasing the proportion of non-carbon energy sources, and fully mobilizing flexible resources in the source-grid-load-storage energy chain [5, 6]. A low-carbon integrated energy system has the following features: (1) improving the efficiency of fossil energy combustion through carbon capture technology, capturing CO released in the process of energy conversion for storage or reuse, thus directly reducing carbon emissions; (2) using electricity/gas/heat/cooling multiple energy storage, demand-side management, energy-information-transportation multi-system interconnection and interaction to deeply explore flexibility resources, improve energy efficiency, and promote renewable energy consumption [7]. (3) to fully mobilize the enthusiasm of all parties to reduce emissions and promote carbon reduction in the energy system by relying on the design of the carbon market mechanism, the synergy and interaction between the carbon market and the energy market, and other market regulation means. As shown in Figure 2, the planning objects of the domain-level low-carbon integrated energy system include both wind, light, small hydropower, biomass, geothermal, hydrogen energy and other diversified small and medium-sized distributed clean energy production and conversion units [8]. Change the values and properties of the data in the sequence while maintaining its original sequence form. All grey sequences can weaken their randomness and reveal their regularity through some form of generation.
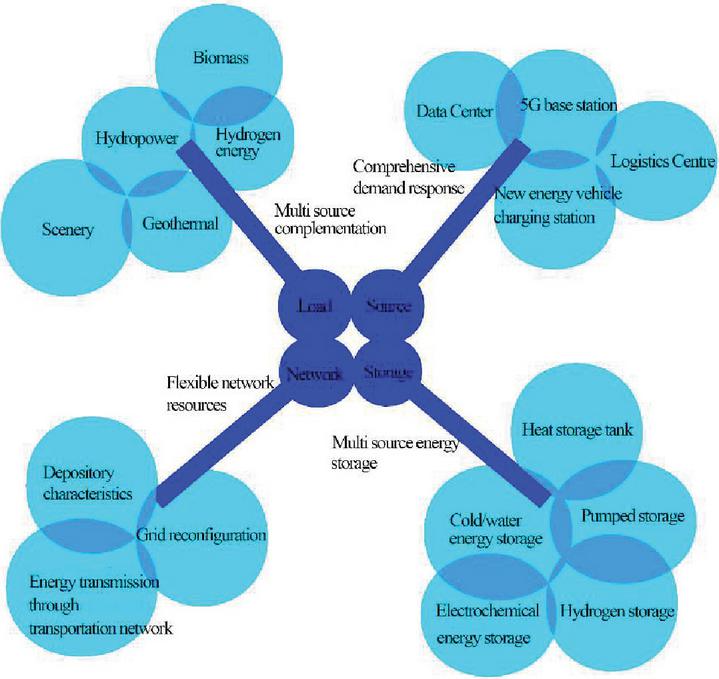
Figure 2 Key elements of regional low carbon integrated energy system planning.
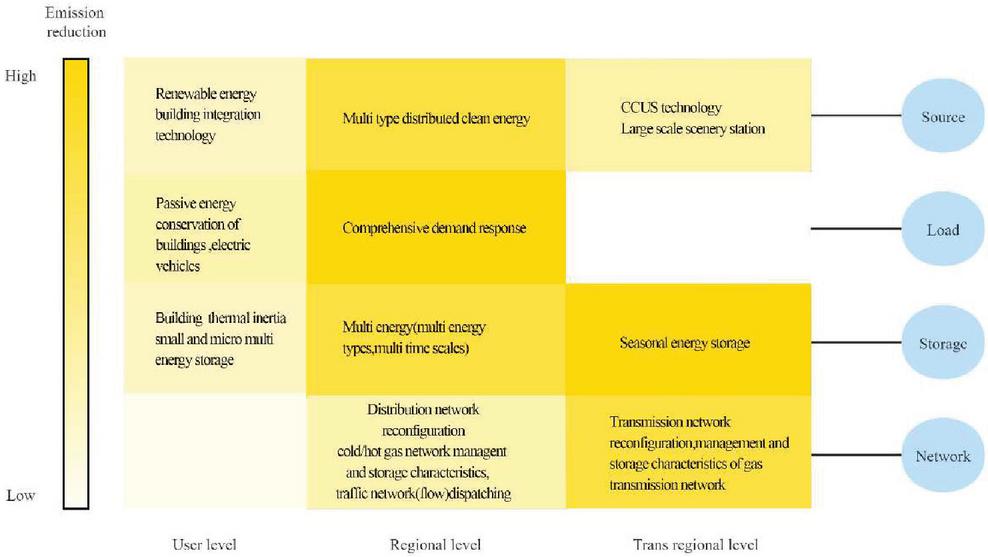
Figure 3 Key elements of low carbon integrated energy system.
Among them, the trans regional low carbon integrated energy system mainly involves electricity and gas, which play a role in large-scale energy production and long-distance transmission; it integrates the production capacity units represented by centralized wind farms and large-scale integrated energy stations equipped with carbon capture equipment, the energy storage units represented by seasonal energy storage, and the energy long-distance transmission units represented by transmission lines, gas transmission pipelines, and transportation networks [9, 10]. The regional low carbon integrated energy system contains the most abundant types of heterogeneous energy, which mainly plays the role of energy distribution, conversion and transmission; it integrates small and medium-sized distributed clean energy such as scenery, biomass and geothermal, multiple energy storage equipment, deeply coupled power/gas/heat/cold energy transmission network through multiple energy conversion equipment, and integrated demand response system based on energy, information and transportation multi system interconnection and interaction. In terms of specific emission reduction elements, as shown in Figure 3, diverse vitality joins and distinctive levels of low-carbon coordinates vitality frameworks are distinctive. Client level moo carbon coordinates vitality framework specifically supplies vitality for conclusion clients, which is closely related to detached energy-saving plan of buildings, and is an vital portion of moo carbon buildings; it coordinating little and small scale clean vitality such as wind and soil warm, and little electric vitality capacity, warm capacity tank and other vitality capacity equipment [11]. Changes in user energy use behavior often have a significant impact on the overall system, and the “source load” is volatile and random.
At present, some researches have been carried out on low-carbon energy economy at home and abroad, but there is a lack of systematic sorting and induction. Firstly, based on the energy field, this paper analyzes the goal of energy economy and the optimization of the method of energy economy transformation under the existing environment; Then, from the perspective of energy enterprises, the shortcomings of the traditional DEA model are summarized, and then it is improved; finally, the prediction model of energy system consumption and carrying capacity is established, and the future is prospected.
2 Energy Economic Goals and Transformation Path Method Optimization
Under the carbon neutrality scenario, the modern service industry, high-end manufacturing industry and other industries are developing faster, energy efficiency improvement and circular economy are further promoted in all fields, and energy intensity continues to decline, with an average annual decline of about 3.8% from 2020 to 2050 (0.3 percentage points higher than that under the reference scenario), which makes the peak time of primary energy demand reach about 5 years ahead of schedule, reaching the peak around 2035, and the peak demand decreases by 3.7% to about 3.9 billion tons of standard oil (equivalent to 5.6 billion tons of standard coal).
Currently, the main technology to improve the stability and flexibility of energy and power conversion is energy storage technology, i.e., by deploying energy storage systems to buffer the intermittency and volatility of energy conversion and improve the stability, safety and efficiency of power production, such as hydrogen storage systems and pumped storage technology, etc [11, 12]. However, due to the high construction cost of supporting facilities for energy storage technology, the existing technology application standards and market policies and regulations still need to be further improved. Therefore, carbon emission control in the production and supply of oil and gas fields is still an important direction for the modernization and transformation of energy economy. The guiding strategy for the construction of a carbon-neutral modern energy economy is to guide the development of China’s traditional energy industry and new energy industry in the direction of low emissions and high energy efficiency, with the aim of achieving synergistic development of economy, environment and society [13].

Figure 4 Time schedule for countries to achieve carbon peak and carbon neutralization.
2.1 Promote the Optimization and Upgrading of Energy Industry Structure
At present, among the 20 countries ranked in the international carbon emission statistics, most of them (such as the United States and other developed countries) have already reached the carbon peak (as shown in Figure 4), while China, as a developing country, is in a critical period of transformation of its energy industry structure, and it still needs some time to achieve the goal of carbon peak and carbon neutrality in energy production and processing [14]. Looking forward to 2020, the global energy demand will face many uncertainties, such as the epidemic trend of COVID-19, virus control measures and control time, the situation and speed of economic recovery after the pandemic subsides, etc. In 2020, global oil demand may decrease by 9%, oil consumption will return to the level of 2012, and natural gas demand will further decrease compared to the first quarter; Electricity demand may decrease by 5%, coal demand will decrease by 8%, and nuclear power demand will further decrease. The decrease in energy demand will lead to an 8% reduction in global carbon dioxide emissions, returning to the level of 10 years ago. China’s overall energy consumption has been increasing, and the overall consumption of traditional fossil energy sources such as coal, natural gas and oil accounts for more than 80% of the total energy consumption market; the proportion of non-fossil new energy sources is less than 20%. In the process of implementing the “double carbon” strategy, the overall proportion of clean energy consumption in the energy industry has gradually increased, promoting the optimization and upgrading of the energy industry structure from both the energy supply and demand sides, and comprehensively implementing the low carbon development goal of the energy economy [15].
2.2 Promote the Modernization of the Energy Security System
As a strategic issue related to the development of energy economy, energy security has the function of guaranteeing the stable development of the country, improving public life and maintaining the harmonious development of society [16]. According to the survey on energy dependence, China’s energy dependence has been rising year by year, and even reached over 70% in 2019 [17]. In the current increasingly complex international political situation, promoting the full implementation of the carbon neutral strategy and building a clean, low-carbon and diversified energy security system can not only meet the differentiated energy needs of the public and implement the development goals of ecological civilization, but also improve the energy self-sufficiency rate, reduce the foreign energy dependence rate, and enhance the energy risk resistance.
2.3 An Effective Path to Promote the Low-carbon Transformation of the Energy Industry from the Perspective of Carbon Neutrality Strategy
(I) Scientific control of the total carbon emissions of fossil energy
Taking offshore oil field development as an example, carbon emissions from production sources account for more than 70% of total carbon emissions, and controlling carbon emissions in the power conversion and supply chain can reduce carbon generation at the source [18, 19]. Specifically, first of all, oil and gas energy companies should strengthen the development of energy storage technology to improve the efficiency of power conversion and optimize the resource allocation structure. Secondly, we should strengthen the development of new energy sources, and at the same time, build an intelligent power supply micro-grid with a certain amount of oil and gas fossil energy sources to reduce the carbon emission intensity of the electric energy supply [20]. As shown in Figure 5, a large integrated power supply system can be built with a micro-grid. As shown in Figure 5, typical elements of large integrated energy stations include carbon capture power plants, large scenic sites, gas storage complexes, and large electric energy storage represented by pumped storage [21].

Figure 5 Key elements of trans regional energy system planning.
(II) Improve the recycling efficiency of torch gas
Within the handle of oil and gas field improvement, the recuperation and treatment of related gas is one of the vital strategies to reduce CO outflow concentrated, conjointly an critical advancement course of low-carbon change of conventional vitality industry. Within the recuperation and reusing of flare gas, a adaptable and logical utilization arrange ought to be defined concurring to the particular generation frame of oil and gas areas, as appeared in Figure 6. In oilfields with tall related gas production and primarily nonstop development, gathering pipelines can be outlined and built to assemble a expansive sum of related gas delivered within the oil generation handle, and after that transported to the pipeline terminal for preparing; if the oil and gas fields are not equipped with export pipelines, or the mixed transmission of oil and gas cannot be carried out, the flare gas can be purified and processed into compressed natural gas (CNG) or liquefied natural gas (LNG) [21, 22].
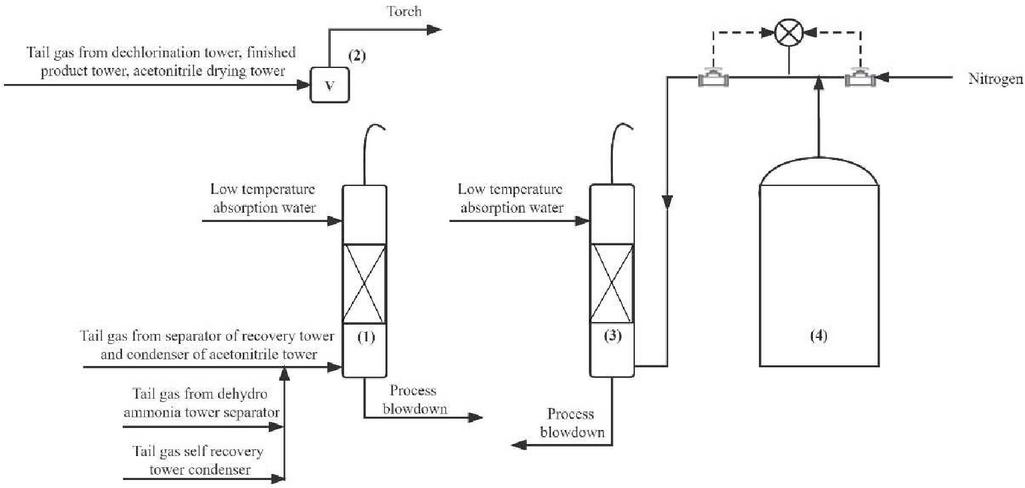
Figure 6 Technical process of acrylonitrile unit for flare gas treatment.
(III) Do a good job of terminal decarbonization treatment
The chemical decarbonization method is mainly to add various co-reactive substances to CO to convert them into carbon organic matter, fuel and other substances, so as to realize the recovery and reuse of carbon resources and reduce the total carbon emissions. If H is added to the carbon gas, after a chemical reaction, CH(methanol) can be synthesized; carbon and CH synthesize high carbon alcohol and other substances; add propylene oxide will produce poly reaction to synthesize aliphatic polycarbonate, which is the main raw material of biodegradable plastics; synthesize ethylene carbonate with ethylene oxide and coupling with carboxylate of organic binary to synthesize vinyl polyester. It is important to note that the chemical properties of CO has stability, in the use of chemical methods for decarbonization treatment process, will consume part of the energy, at the same time, CO gas source and common reactants, the use of synthetic substances has specific requirements, target product specific market demand is different, need according to the resources, technical cost, market characteristics to determine the chemical treatment scheme [23].
3 Energy System Improvements for Traditional Evaluation Models
3.1 Introduction to the DEA-Malmqusit Model
The advantage of its prediction lies in considering replacing a single time point initial field with a multi time point initial field, thus breaking through the limitations of traditional grey prediction models that are sensitive to initial values.
The traditional DEA model can only measure the efficiency value of different decision units in a certain period, so that the results are only in the same year, and different sections can be compared, and it is difficult to compare between the same section in different years [24], but DEA-Malmqusit The model can make the same calculation on the panel data, so the results between the cross-sections can be compared and analyzed across time periods, and the model equations are as follows:
| (1) |
Where, tfp represents total factor productivity, When the tfp is greater than 1, It means that total factor productivity rises, otherwise, total factor productivity decreases, x and y represents the input and output of phase t 1, , . Respectively, for the output distance function of the corresponding period technique, where the subscript c indicates that the scale reward is unchanged [25].
3.2 Input and Output Index Setting
In order to accurately measure energy economic efficiency, this paper uses tap software to measure the total factor productivity of energy economy, referring to Peng Song’s approach, select the input and output variables as shown in Table 1.
Table 1 Outputs and inputs
| Indicator Code | Index Name | Computing Method |
| Produce | Smoke and dust emission | Annual industrial smoke and dust emissions |
| Industrial waste discharge | Annual Industrial waste discharge | |
| Discharge of industrial solid waste | Annual discharge of industrial solid waste | |
| Total energy economy | Annual economic output value | |
| Investment | Total energy consumption | Coal conversion |
| Total number of employees | Number of employees in energy industry | |
| Fixed assets exchange | Annual depreciation of fixed assets |
The input variable in this paper is the require variable of vitality financial advancement, which is the entire vitality utilization, the full number of representatives and the deterioration of settled resources, respectively measured by utilizing standard coal or standard oil change, the number of workers within the vitality industry and the yearly deterioration rate of settled resources. Yield factors incorporate undesired yield and anticipated yield, separately, measured utilizing yearly carbon dioxide emanations, yearly sulfur dioxide emanations, yearly mechanical and residential sediment outflows, yearly mechanical tidy emanations, yearly mechanical strong squander emanations, and yearly vitality and financial output value [26].
3.3 Calresults of Energy Economic Efficiency
Based on the above input and output variables, deap software is used to calculate the total factor productivity of energy economy, namely energy economic efficiency.
The calculation result shows that China’s overall energy economic efficiency is at a relatively low level, from 2013 to 2019, the energy economic efficiency was stable, with an annual average rate of 0.994 in 2013 and 2019. From the individual perspective, there is great heterogeneity in the energy economic efficiency in many provinces in China [27]. In 2019, the energy economic efficiency in Beijing, Guangdong, Fujian and other places is relatively high. The energy economic efficiency in Qinghai, Gansu, Ningxia and other places is relatively low, mainly because the level of economic development in these areas is relatively low, the level of scientific and technological development is weak, and the effect on the development of energy economy is limited. At the same time, these regions are still within the arrange of financial improvement and development. Nearby governments pay constrained consideration to the environment, and the escalated and profundity of natural control are restricted, which influences the quality and impact of vitality economy advancement. From the viewpoint of the eastern, central and western locales, China’s vitality financial effectiveness is continuously diminishing from east to west, and the energy financial effectiveness within the eastern locale is essentially higher than the by and large national financial level, the vitality financial productivity of the central region is fundamentally the same as that of the complete nation, whereas the vitality financial effectiveness of the western locale is fundamentally lower than the national normal level [28].
3.4 Tobit Model Regression Results
Tobit regression analysis was performed using stata software,results show that the relapse coefficient of KJ is 0.045, and the P esteem is 0, showing that the relapse coefficient is noteworthy at the level of 1%, demonstrating that there’s a critical positive relationship between logical and mechanical strengthening and energy economic productivity, that’s, the change of logical and mechanical improvement level can viably advance the change of vitality financial proficiency, particularly, the change of logical and innovative advancement level by one unit and the enhancement of vitality financial proficiency by 0.045 units. The improvement of technology development can effectively improve the use efficiency of coal and oil, while the improvement of technology development can promote the use of clean energy such as wind and nuclear energy, thus promoting the improvement of energy economic efficiency. The regression coefficient of HJ is 0.006 and the p-value is 0, indicating that the regression coefficient is significant at the 1% level, indicating that there is a significant positive relationship between environmental regulation and energy economic efficiency, i.e., an increase in the level of environmental regulation can effectively lead to an increase in energy economic efficiency, specifically, an increase in the level of environmental regulation by 1 unit can promote an increase in energy economic efficiency by 0.006 units. Environmental regulation is an important tool to improve regional environmental standards, and effective environmental regulation can force enterprises to improve their production behaviors, thus promoting them to improve their technology and thus energy economic efficiency.
Among the control variables, the regression coefficient of PGDP is 0.012, and the p-value is 0.083, indicating that the regression coefficient is significant at the 12% level, indicating that there is a significant positive correlation between regional economic development level and energy economic efficiency, i.e., an increase in regional economic development level can effectively lead to an increase in energy economic efficiency, specifically, an increase of one unit in regional economic development level can lead to an increase of 0.005 unit in energy economic efficiency. The regression coefficient of JY is 0.004, and the p-value is 0.026, indicating that the regression coefficient is significant at the 4% level, indicating that there is an obvious positive relationship between education level and energy economic efficiency, i.e., an increase in regional education level can effectively lead to an increase in energy economic efficiency, specifically, an increase in education level by one unit can lead to an increase in energy economic efficiency by 0.007. The regression coefficient of CZ is 0.021 and the p-value is 0.037, indicating that the regression coefficient is significant at the 2% level, indicating that there is an obvious positive relationship between regional urbanization level and energy economic efficiency, i.e., an increase in urbanization level can effectively lead to an increase in energy economic efficiency, specifically, an increase in regional urbanization level by one unit can lead to an increase in energy economic efficiency. The regression coefficient of SC is 0.010, and the p-value is 0.010, indicating that the regression coefficient is significant at the 1% level, indicating that there is an obvious positive correlation between marketization level and energy economic efficiency, i.e., an increase in marketization level can effectively lead to an increase in energy economic efficiency, specifically, an increase in marketization level by one unit can lead to an increase in energy economic efficiency. Specifically, an increase of 1 unit in the level of marketization can increase the energy economic efficiency by 0.010 unit.
4 Construction of Energy System Consumption and Load Capacity Forecasting Model Based on LEAPS
The LEAP model allows researchers to flexibly construct model structures based on research objectives, data accessibility, and research object characteristics. It is very suitable for situations where energy data is not comprehensive and has been widely applied in energy strategy research at the national, regional, departmental, and industry levels. Mastering this model not only helps university and research institute staff engage in energy system engineering related work such as energy system evaluation and diagnosis, low-carbon and energy-saving development technology research, but also provides technical support for government decision-making. Especially applicable to hot issues such as the role of integrated utilization strategies for wind, solar, and hydrogen energy in the entire social energy supply system, the impact of electric vehicles on terminal energy demand and carbon emissions.
This paper employments the vitality utilization module within the Jumps demonstrate, railroad transport in a area in China as the inquire about question, concurring to the traveler transport, cargo transport and crisis bolster transport measurement division, construct based on Jumps railroad transport vitality utilization and carbon outflow decrease potential investigation demonstrate, and situation investigation, to confirm the legitimacy of the demonstrate, appropriateness [29].
Remember when we process raw data, do we accumulate them to generate data, so the first formula predicts that the result is the predicted value of the generated data. Therefore, we need to subtract the previous term from them to restore the original data. So the prediction formula for the original data was obtained.
4.1 Model Building and Its Core Module Composition
(1) Production module core equation
Production module core equation in the LEAPS model is generally established based on production conditions and resource constraints to realize the optimization of producer profit. Related to this are optimization condition equations and descriptive equations, such as the production process of producers, intermediate production process, etc.
| (2) | |
| (3) | |
| (4) |
Where a is a production activity divided by sector, A for the industrial sector collection; QA and PA are the commodity output in production activities and the price of production activities respectively; QVA and PVA are the aggregate price of added input and the aggregate price of added input respectively; QINTA and PINTA are the intermediate input of goods and the aggregate price of intermediate input respectively; and represent the share of total factor productivity and different production departments respectively, and is the alternative elasticity parameter [30].
(2) Trade module core equation
In the LEAPS model, based on the two-way trade of import and export commodities, in order to optimize the profit of export products or reduce the cost of imported products, the process is usually described in accordance with the normal elastic conversion equation (CET) or the armington (Armington) equation.
| (5) | |
| (6) | |
| (7) |
QA is the total product produced domestically; QDA is the product produced domestically for domestic use; QE is the part of domestic produced products for export; PE is the export price of domestic goods; is the alternative elasticity parameter; , , t are all equation parameters [31, 32].
(3) The core equation of the energy and environment
Module incorporates the calculation condition of the carbon outflow and the calculation condition of the carbon assess input, which are indicated as takes after. The carbon emanations produced within the generation prepare of each department are:
| (8) |
In Equation (8), QPE is the carbon dioxide emission of each industrial sector; thete represents the standard energy coefficient of various energy types; and emiss represents the carbon emission coefficient of the standard energy sources. The carbon tax levied on the use of fossil energy in the production process of each department is calculated as follows:
| (9) |
TAX represents the market-denominated carbon tax rate; t indicates a fixed carbon tax rate.
(4) The energetic module center condition
It shows embraces the energetic recursion strategy to realize the energetic alter of populace development, labor drive, capital stock and add up to calculate efficiency, particularly as takes after. Population development condition:
| (10) |
The labor force growth equations are as follows:
| (11) |
The equation for capital growth is follows:
| (12) | ||
| (13) |
The total factor productivity growth equation is follows:
| (14) |
Among them, QLD, QKD and TEC are the labor, capital supply and technical variables of each sector respectively.
(5) The core equation of the equilibrium module
It adopts the equilibrium of the factor market:
| (15) | ||
| (16) |
L and K are the labor and capital input in the industrial sector; L and K are the labor and capital supply in the market.
4.2 China’s Carbon Emissions Peak Scenario Setting
The crest time and top point of China’s carbon outflows, as well as the time for China to attain carbon nonpartisanship, depend on China’s future financial advancement speed, mechanical structure change, and the application of vitality preservation and outflow decrease innovations. The top time of China’s carbon outflows is based on two bases: to begin with, the time hub declared at the Joined together Countries Common Get together in 2020 will crest carbon dioxide emanations by 2030 and accomplish carbon nonpartisanship by 2060; moment, considering the diverse expectation comes about of the scholarly top of China’s carbon emanations, the two time focuses of emanations top in 2025,2030 and carbon neutralization in 2050 were chosen [33].
(1) Scenario 1. With the support of China’s action plan, national autonomous contribution goals and relevant policies proposed under the Paris Agreement, and continuing the current trend of low-carbon transition and relevant policies, China’s carbon peak time point and carbon emissions will be in 10.87 billion tons in 2030 respectively, and the carbon neutralization time point and carbon emissions will be in 2060 and 9 billion tons respectively.
(2) Scenario 2. Based on the basis of policy scenario, further strengthen the lower unit GDP energy intensity and carbon intensity and amplitude, control the total carbon emissions, further improve the non-fossil energy in a, energy consumption proportion such as indicators, strengthen energy conservation policy support, adapt to countries under the Paris agreement to strengthen and update the NDC target and action requirements. Under this strengthening policy scenario, China’s carbon, peak time point and carbon emissions are in 2030 and 10.46 billion tons respectively, and carbon neutralization time point and carbon emissions are in 2050 and 6.2 billion tons respectively.
(3) Scenario 3. In the same as the policy intensity in scenario 1, under this policy scenario, China’s carbon peak time point and carbon emissions in 2025 and 10.87 billion tons, respectively, and carbon neutralization time point and carbon emissions in 2050 and 9 billion tons, respectively.
(4) Scenario 4. Similar to the same policy intensity in scenario 2, under this enhanced policy scenario, China’s carbon peak time point and carbon emissions in 2025 and 10.46 billion tons, respectively, and the carbon neutralization time point and carbon emissions in 2050 and 6.2 billion tons, respectively.
4.3 Preparation of the Social Accounting Matrix and the Determination of the Model Parameters
Social accounting matrix (SAM) using the matrix method of the national economy each account system through the number of national economic accounting system of statistical index system, the circulation of the national economy operation, flow and stock, domestic and foreign orderly arrangement, very easy to build macroeconomic measurement model system application.
Carbon emission of various energy sources and the reference coefficient of discount standard coal. The unit carbon emission coefficients of various energy sources are based on the data listed in the UN IPCC guidelines for the calculation of carbon emissions. And all kinds of energy sources fold the standard coal coefficient, according to the latest national standard, “comprehensive energy consumption calculation general rules GB/T 2589–2020” for sorting [34].
Alternative elastic parameters. Replacing the values of elastic parameters can have some impact on the results of the model, but the LEAPS model can still be used as a tool to determine specific trends and understand the problem being studied. Reasonable parameter settings can help prevent errors in trend or direction in the results. Mainly drawing on the research structure data of Zhang, Guo Zhengquan, Dong, Li Xin’an and so on, specific setting as shown in Table 2.
Table 2 Mainly in lieu of parameters
| Industry Name | |||||||||
| Renewable energy power generation | 0.2 | 0.1 | 0.1 | 1.2 | 0.3 | 0.7 | 0.9 | 0.99 | 0.88 |
| Water production supply | 0.2 | 0.1 | 0.1 | 1.2 | 0.3 | 0.7 | 0.9 | 0.99 | 0.86 |
| Leisure and entertainment industry | 0.2 | 0.3 | 0.1 | 1.2 | 0.3 | 0.7 | 0.9 | 0.94 | 1.12 |
| Commercial catering industry | 0.2 | 0.3 | 0.1 | 1.2 | 0.3 | 0.7 | 0.9 | 0.94 | 1.12 |
| Finance and insurance | 0.2 | 0.5 | 0.1 | 1.2 | 0.3 | 0.7 | 0.9 | 1.01 | 1.20 |
| Education | 0.2 | 0.5 | 0.1 | 1.2 | 0.3 | 0.7 | 0.9 | 1.03 | 1.20 |
Dynamic module parameters. Dynamic module parameters include population growth rate, social investment rate, and total factor productivity. Regarding the population growth rate, the World Bank has evaluated the population growth in China, and set the population growth rate mainly by Zhai data; the social investment rate is mainly the resident savings rate, and the resident savings rate is mainly set according to the relevant data of Li Ping; the total factor productivity (TFP) uses 2% as the total factor productivity in China [35].
4.4 Quantitative Simulation of the Macroeconomic Impact of Each Scenario of the “Two-carbon” Target
Under the background of the “double-carbon” goal, China’s 14th Five-Year Plan should not only achieve steady progress under the constraints of carbon and emissions, but also face the task of realizing green transformation and higher-quality development. The following adopts the dynamic LEAPS equilibrium model constructed, using the latest input-output data released by the National Bureau of Statistics in 2018, combined with the four scenarios to achieve the “double carbon” target setting, to analyze the impact of strengthening the “double carbon” target realization on the macro economy under different scenarios.
This portion of the distinctive scenarios of carbon outflows analyzes the comprehensive affect of China’s large scale economy, inquire about “twofold carbon” limitations on GDP, utilization, business, add up to yield, add up to trades, add up to imports and other macroeconomic markers, in arrange to more natural show information, utilizing, bar will list the over information, counting the situation as a benchmark situation (hereinafter referred to as the benchmark scenario), Results of changes in large scale markers relative to the benchmark situation when carbon emanations top. As appeared in Figure 7. It can be seen that, but for the expansive increment in work in scenarios 3 and scenarios 4, the other financial pointers have diminished to distinctive degrees in different scenarios.
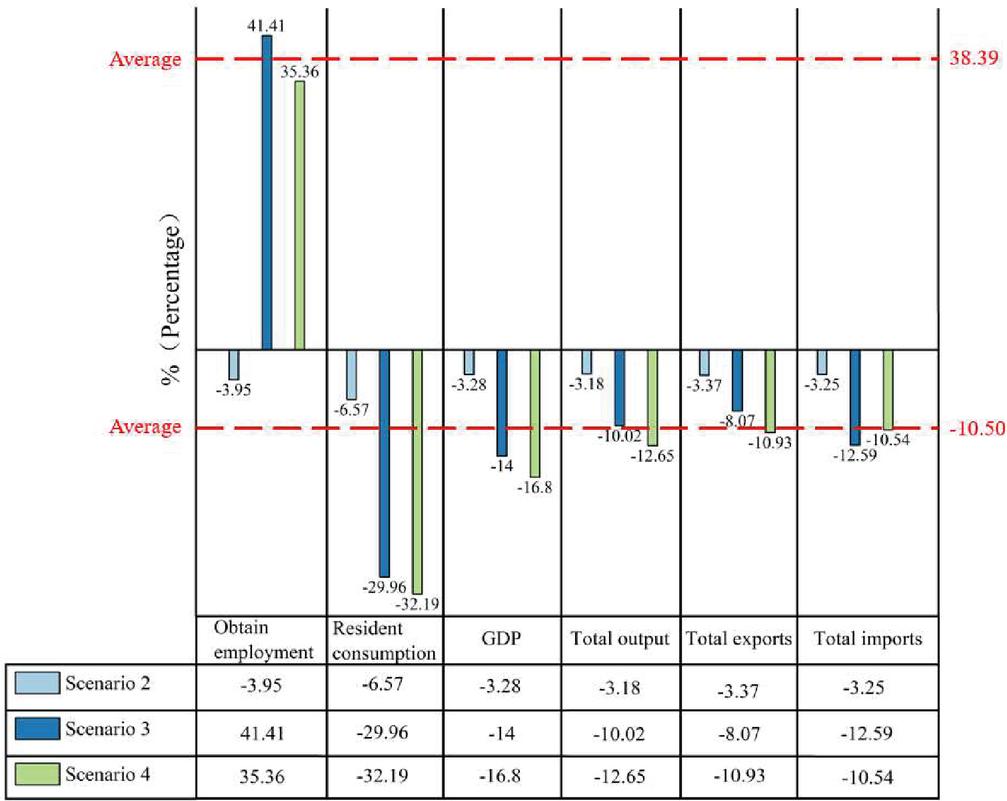
Figure 7 Impact of different carbon peak scenarios on macroeconomy.
If China achieves a carbon peak in 2030, the carbon peak in 2030 under the policy scenario is the benchmark scenario; under the enhanced policy scenario, GDP decreases by 3.28%, household consumption by 6.57%, employment by 3. 95%, total output by 3.18%, total export volume by 3.37%, and total import trade by 3.25%. If China’s carbon emissions peak in 2025: under the policy scenario, GDP will fall by 14%, household consumption by 29.96%, employment by 41.41%, total output by 10.02%, total export trade by 8.07%, and total import trade by 12.59%. Under the strengthened policy scenario, GDP decreased by 16.8%, household consumption decreased by 32.19%, employment increased by 35.36%, total output decreased by 12.65%, and total export and total import trade volume decreased by 10.93% and 10.54%, respectively.
5 Conclusion
Under the dual carbon goal, the energy system urgently needs low-carbon transformation. This article attempts to extract the connotation of low-carbon comprehensive energy systems. After sorting out the relevant research on energy transformation goals and path optimization analysis, it summarizes the typical characteristics of low-carbon comprehensive energy systems at a hierarchical level, and summarizes the low-carbon elements of each energy link in the low-carbon comprehensive energy system.
Then, from the perspective of energy economic efficiency, in order to optimize the energy economic structure and improve energy economic efficiency, this paper measures the energy economic efficiency of several provinces in China with the improved DEA-Malmqusit model, and explores the correlation between technological empowerment, environmental regulation and energy economic efficiency with the Tobit model; for energy system consumption and load capacity prediction, a LEAPS A dynamic model is designed for energy system consumption and load capacity prediction.
(1) Based on the LEAPS model, the energy consumption intensity and carbon emission reduction potential are analyzed under different scenarios, and the more effective the government energy saving and emission reduction policies are implemented and the more advanced technology innovation is driven, the more energy utilization efficiency and pollutant emissions are significantly improved and reduced.
(2) Emission reduction policies that promote the achievement of the “double carbon” target have different degrees of impact on the output of most macroeconomic sectors. impact.
(3) When the fluctuation of raw energy data is not large, the algorithm designed in this paper has better prediction effect compared with the traditional DEA model, and the prediction accuracy of this paper is higher. The energy consumption forecast for a city in 2024 is expected to reach 65,240,100 tons of total energy carbon emissions in 2024, and the energy consumption increases by 3.6% year by year. The prediction confirms that the method of this paper has certain accuracy and adaptability.
References
[1] Li Nu, Wang Jianliang, Liu Rui, et al. Multi scenario concept of natural gas industry development under the goal of carbon neutrality [J] Natural Gas Industry, 2021, 41(2).
[2] Zeng Shihong, Li Gen, Weng Zhixiong, et al. Research on the path of China’s energy transformation towards carbon peaking and carbon neutralization [J] Environmental Protection, 2021, 49(16): 26–29.
[3] Li Zheng, Zhang Dongjie, Pan Lingying, et al. China’s low-carbon energy transformation path and suggestions under the “dual carbon” goal [J] Journal of Power Engineering, 2021, 41(11): 905–909.
[4] Lin Boqiang, Zhan Yanhong, Sun Chuanwang Research on the bilateral coordinated development of energy supply and demand oriented to carbon neutralization [J] Governance Research, 2022, 38(3): 24.
[5] Liu Peiji, Liu Fei, Wang Xu, et al. The theory and technology system of green manufacturing and its new framework [J] Journal of Mechanical Engineering, 2022, 57(19): 165–179.
[6] Satterthwaite D. The implications of population growth and urbanization for climate change[J]. Environment and urbanization, 2009, 21(2): 545–567.
[7] Gupta A, Gupta K. Short Term Solar Irradiation Prediction Framework Based on EEMD-GA-LSTM Method[J]. Strategic Planning for Energy and the Environment, 2022: 255–280.
[8] Rahman S M, Kirshner J, Groh S, et al. A review of the energy-employment nexus in Bangladesh: Rural-urban electrification and sectoral occupation patterns[J]. Strategic Planning for Energy and the Environment, 2022: 317–344.
[9] Zhang S, Wu S. Evaluation of Digital Rural Development from the Perspective of Rural Revitalization–Take Zhejiang Province as an Example[J]. Strategic Planning for Energy and the Environment, 2021: 121–144.
[10] Li Xin’an, Li Hui Research on carbon emission effect of green technology innovation from the perspective of high-quality development of manufacturing industry [J] Innovative technology, 2021.
[11] Lin S, Cai S, Sun J, et al. Influencing mechanism and achievement of manufacturing transformation and upgrading: Empirical analysis based on PLS-SEM model[J]. Journal of Manufacturing Technology Management, 2018, 30(1): 213–232.
[12] Dong B, Ma X, Zhang Z, et al. Carbon emissions, the industrial structure and economic growth: Evidence from heterogeneous industries in China[J]. Environmental Pollution, 2020, 262: 114322.
[13] Guo Xiaojun Research on the Extended Model and Application of Grey Self Memory Combination Prediction [D] Nanjing University of Aeronautics and Astronautics, 2015.
[14] Zhang Xiao, Zhang Xidong Application of CGE model in resource and environmental economics [J] Urban and Environmental Studies, 2015 (2): 91–112.
[15] Zhu Peiyu, Ling Wen Impact of different carbon emission peak scenarios on industrial structure – analysis based on dynamic CGE model [J] Financial Theory and Practice, 2020, 41(5): 110–118.
[16] Li Xin’an Research on the driving role of regional innovation capability in improving the quality of economic development [J] Regional Economic Review, 2020, 2.
[17] Zhang H. The impact on China’s economy of its accession to the WTO: A computable general equilibrium (CGE) analysis[M]. Northern Illinois University, 2002.
[18] Li Qingxiang Analysis of China’s water transport carbon emission status and carbon reduction path [J] Transportation energy conservation and environmental protection, 2021.
[19] Xie Hansheng, Huang Yin, Ma Long Analysis and Research on China’s Railway Energy Efficiency and Energy Conservation and Emission Reduction [J] Railway Labor Safety, Health and Environmental Protection, 2010, 37(3): 118–122.
[20] Wu Xiaoping, Li Yusi, Liu Jiangwei Comparative analysis of railway energy consumption between China’s railways and major countries in the world [J] Science and Technology Bulletin, 2016, 34(2): 313–317.
[21] Cui Jie, Liu Sifeng The Illness Problem of Grey Verhulst Extended Model [J] Control and Decision Making, 2014, 29(3): 567–571.
[22] Wang Tiecheng Research on the influence of railway transport energy consumption factors based on econometric regression method [J] Railway Economic Research, 2021.
[23] Gao Ruifeng Analysis on the relationship between energy economy and regional economic growth [J] SMEs in China, 2021.
[24] Liu Wenjun, Li Jiao, Liu Xiuchun Empirical analysis on energy efficiency of China’s tourism industry under carbon emission constraints – based on SBM model and Tobit regression model [J] Journal of Central South Forestry University: Social Science Edition, 2017, 11(1): 40–46.
[25] Chen Guangjiu New Trends of International Energy Economy and Strategic Choices for China’s Energy Economic Development [J] Journal of Changchun University, 2014, 24(5): 596–599.
[26] Chen Q, Kang C, Xia Q, et al. Optimal Flexible Operation of a CO Capture Power Plant in a Combined Energy and Carbon Emission Market[J]. IEEE Transactions on Power Systems, 2012, 27(3): 1602–1609.
[27] Liu J, Ye J, Yang C. Power Battery Recycling Mode and Decision-making Model for New Energy Vehicles Under the Background of Dual Carbon[J]. Strategic Planning for Energy and the Environment, 2022: 457–476.
[28] Hu W, Wang G. Research on sustainable landscape design and public environmental perception of modern communities based on deep learning nonlinear data[J]. Strategic Planning for Energy and the Environment, 2022.
[29] Lv Jiawei, Zhang Shenxi, Cheng Haozhong, et al. Overview of regional integrated energy system planning considering interconnection and interaction [J] Chinese Journal of Electrical Engineering, 2021.
[30] Zhang Yunzhou, Zhang Ning, Dai Hongcai, et al. Analysis model construction and transformation path comparison of low carbon development of China’s power system [J] China Power, 2021, 54(3): 1–11.
[31] Liu Yongqi, Chen Longxiang, Han Xiaoqi Analysis on key issues of new energy substitution in China under the energy transition [J] Chinese Journal of Electrical Engineering, 2022, 42(2): 515–524.
[32] Voumik L C, Hossain M S, Islam M A, et al. Power generation sources and carbon dioxide emissions in brics countries: static and dynamic panel regression[J]. Strategic Planning for Energy and the Environment, 2022: 401–424.
[33] Tian Feng, Jia Yanbing, Ren Haiquan, et al. Low carbon economic dispatch of integrated energy system “source r load” considering carbon capture system [J] Power grid technology, 2020, 44(9): 3346–3355.
[34] Fan J L, Shen S, Xu M, et al. Cost-benefit comparison of carbon capture, utilization, and storage retrofitted to different thermal power plants in China based on real options approach[J]. Advances in Climate Change Research, 2020, 11(4): 415–428.
[35] Lu Zhigang, Yang Yu, Geng Lijun, et al. Low carbon economic dispatch of electric heating integrated energy system based on Benders decomposition method [J] Chinese Journal of Electrical Engineering, 2018, 38(7): 1922–1934.
[36] Wang R, Wang J, Teng Y. A Hybrid Evaluation Method of Ecological Environment Quality Based on Entropy and Matter-Element Extension Model[J]. Strategic Planning for Energy and the Environment, 2021: 387–406.
[37] Yan Z, Cui C, Liao C. The Impact of Green Finance on Clean Power Generation: Evidence Based on China[J]. Strategic Planning for Energy and the Environment, 2021: 421–436.
Biography

Yin Jie received a bachelor’s degree in in engineering from Nanjing Agricultural University in 2020. She is currently studying as a graduate student at the School of Management of Xi’an University of Science and Technology. Her research areas and directions include energy economics and management, industrial economy.
Strategic Planning for Energy and the Environment, Vol. 43_1, 55–80.
doi: 10.13052/spee1048-5236.4313
© 2023 River Publishers