Crude Oil Price Bubble Identification and Risk Assessment From Different Spot Markets: Establishing a Sustainable Energy Policy
Jiayue Wang1, Kun Ma2, Ling Zhang3, Jinghong Wei3 and Jianzhong Wang3,*
1College of Accounting, Hebei University of Economics and Business, Shijiazhuang, 050061, Hebei, China
2College of Economics and Management, Hebei University of Science and Technology, Shijiazhuang, 050018, Hebei, China
3College of Economics and Management, Hebei Agricultural University, Baoding 071000, Hebei, China
E-mail: hbau0312@hebau.edu.cn
*Corresponding Author
Received 17 May 2023; Accepted 19 July 2023; Publication 09 January 2024
Abstract
Crude oil, as a strategic energy resource for social development, has witnessed substantial price fluctuations in recent years, impacting the sustainability of economy, ecological environment, and energy security. This paper utilized weekly crude oil price data from January 2003 to March 2023 to examine price bubbles in different markets using the SADF and GSADF methods, identified the duration of price bubbles by comparing the BSADF series with critical value series, assessed the risk of price bubbles in different markets using the established comprehensive indicators, and explored sustainable energy policies from the perspectives of both crude oil importers and exporters. The findings of this study indicate that bubbles exist in the world’s major crude oil markets, with linkages and differences in their origin and termination across different markets. The risk of price bubbles varies widely across different crude oil markets and has significant geographical characteristics, with a higher risk in the markets such as OPEC, Oman, and Dubai, and a lower risk in the markets such as WTI, Brent, and Daqing. This paper proposes sustainable energy policies from the perspective of energy importers and exporters. This is of great importance to enhance the ability of different countries to cope with the risk of crude oil price bubbles and to ensure the sustainability of economic development, ecological environment, and energy security.
Keywords: Crude oil price, price bubbles, bubbles risk, sustainability energy policy.
1 Introduction
Crude oil is a strategic commodity, and its price fluctuations have a significant influence on economic sustainability, the ecological environment, and energy security [1, 2]. As for economic sustainability, crude oil price fluctuation is transmitted to downstream products by affecting fuel costs, and its price increase will raise gasoline and diesel prices, increase transportation costs [3] and product production costs, and affect people’s lives. The consumption of crude oil is closely related to economic growth [4] as crude oil price changes mayaffect consumer and business spending, thus impacting economic sustainability [5]. In terms of ecological environment, as a non-renewable resource, the development and use of crude oil damage the ecological environment and affect the sustainability of the environment [6]. Higher crude oil prices drive crude oil exporters to extract more crude oil, damaging local ecosystems; lower crude oil prices may stimulate the use of crude oil, causing environmental pollution. In terms of energy security, crude oil prices fluctuation will affect the supply and demand structure of energy products and push the development of new energy sources. Therefore, large fluctuations in crude oil prices may have a certain impact on energy security.
Some scholars argue that crude oil prices rise and fall significantly exceed the fundamental prices, and define such large fluctuations as crude oil price bubbles [7, 8]. Large fluctuations in international crude oil prices have been associated with major events [9], such as the financial crisis in 2008 [10] and the spread of COVID-19. Taking Brent crude oil as an example, the spot price was $96.94/barrel on January 2, 2008, and rose to $141.23/barrel on July 1, 2008, representing a 45.69% increase from the beginning of the year. The spot price fell to $36.55/barrel on December 31, 2008, marking a significant decrease of 74.12% from July 1. The spot price was $66.17/barrel on January 2, 2020, and fell to $14.75/barrel on April 28, 2020, decreasing by 77.71% from the beginning of the year. On December 31, 2020, the spot price rose to $50.70/barrel, indicating a 243.73% increase from the end of April. Other crude oil markets have also experienced significant price increases and decreases. Therefore, this paper studies crude oil prices in different markets to identify crude oil price bubbles and assess their bubble risks.
The development of price bubble testing techniques, such as the exponential fitting method and the MRS model, provides the basis for identifying and assessing price bubbles. However, all methods have shortcomings to some extent. In recent years, Phillips et al. proposed SADF and GSADF methods for testing price bubbles, and these methods have been widely used [11–13]. The SADF and GSADF methods can not only test the existence of bubbles but also identify the origin and termination of bubbles. Therefore, in this study, SADF and GSADF methods were utilized to test crude oil price bubbles in different markets. Considering the limited existing research on assessing the risk of crude oil price bubbles, this paper fills the gap by introducing a comprehensive indicator to evaluate such risks across various markets. The identification and assessment of these price bubbles are of paramount importance for the development of early warning systems, the improvement of energy policy, and the preservation of national energy security and sustainability.
The rest of the paper is structured as follows: Section 2 provides a comprehensive review of the relevant literature, Section 3 outlines the research methodology and data, Section 4 analyses and discusses the empirical results, and Section 5 presents the conclusions of the study.
2 Literature Review
Numerous academics have focused on crude oil prices due to the commodity, financial, and geopolitical properties of crude oil [14, 15]. The identification of price bubbles, the assessment of price volatility risk, and the impact of price bubbles are the main fields on crude oil price research.
Scholars have utilized various methods to identify price bubbles in crude oil. The main methods in previous studies are the exponential fitting method, MRS model, SADF method, and GSADF method. The exponential fitting method is commonly applied to the examination of stock market bubbles [16, 17]. Balcilar et al. extended the research scope of this method and used an index fitting method to examine crude oil price bubbles and determine how long each bubble lasted [16]. In terms of the MRS model, Lammerding applied a two-state Markov-switching process to identify crude oil price bubbles [8]. The SADF and GSADF methods employ rolling regressions and are appropriate for price bubble tests at any frequency, providing conclusive proof for the detection of bubbles [7]. Therefore, they have wide applications in energy price bubble testing. Liu et al. tested crude oil, gasoline, and coal price bubbles using the SADF method and GSADF method [1]. Umar et al. verified that the GSADF method can identify a larger number of bubbles than the SADF method [18].
There are also much studies adoping complex financial models to assess the crude oil price volatility risk. Xu et al. measured energy price risk using dynamic topology and revealed the evolution of energy price system risk [19]. Buczyñski and Chlebus used the EVI-CAViaR model to measure the extreme risk of crude oil prices [20]. Yan et al. constructed a crude oil price risk forecasting model based on nonparametric multiple expectile [21]. Compared with the extensive application of VAR models in measuring risk, limited studies have assessed crude oil price risk in terms of price bubbles. Some scholars have identified agricultural price bubbles to measure the risk, which provide good reference for this paper. Zhang measured and compared the price bubble risk of cotton futures in China and the United States using the GSADF method [22]. Li et al. proposed a price risk assessment methodology for agricultural products from the perspective of price bubbles, which was used to assess the likelihood of extreme price emergence [23].
The impact of the crude oil price bubble should also be considered. As a means of production and strategic material, crude oil price is closely related to the economic sustainability, which is primarily manifested through two pathways: cost and substitution. Regarding the cost pathway, crude oil is raw materials or energy for fertilizers, pesticides, transportation, and agricultural production and processing equipment, and the rise in its prices drives up the prices of agricultural products [24]. When oil prices surge, it may disrupt economic growth; when oil prices plummet, market participants frequently turn to safe-haven assets to lower risk [25]. Regarding a substitute pathway, nations have begun to use biofuels to replace gasoline and diesel, taking into account the depletion of crude oil and environmental protection. The primary sources of biofuels’ basic ingredients are corn, soybeans, animal fats, etc. The market demand for biofuel has increased due to the substitutability of biofuels for crude oil, which has driven up the consumption of ethanol raw materials such as corn and led to an increase in food prices [26]. Crude oil price bubbles also cause challenges to the environment and energy security. When the price of crude oil rises, more countries are motivated to develop new energy sources such as wind and solar energy, which objectively reduces environmental pollution [27]. At the same time, crude oil price fluctuations affect the country’s energy security by influencing the supply of crude oil [28].
The aforementioned analysis serves as the foundation of this paper; however, there are still some gaps in the existing studies. The contributions of this paper are threefold: first,more oil markets are included and compared. Previous studies have primarily focused on price bubbles in markets such as WTI and Brent, and less attention given to other markets. China is the largest crude oil importer in the world [29], and its imports have a big impact on global crude oil prices. To identify price bubbles in different markets, this paper uses price data from six crude oil markets. Second, crude oil price bubble risk is assessed. Lots of previous studies used VaR models to calculate the probability of losses due to price volatility. However, they did not compare differences in risk for the same class of commodities. This paper assesses the risk of crude oil price volatility from the viewpoint of price bubbles using innovative risk assessment methods. Third, sustainable energy policies are established. This paper examines the effects of the crude oil price bubbles and makes recommendations for the improvement of sustainable energy policies from the standpoint of energy-importing and energy-exporting countries. These recommendations aim at fostering the sustainable development of the economy, environment, and energy sectors to address the challenges posed by price bubbles.
3 Methodology and Data
3.1 Methodology
The identification and assessment of price bubbles are mainly based on the price volatility theory and rational bubble theory. Price volatility theory states that commodity prices are influenced not only by supply and demand but also by external information, which in turn generates price fluctuations of commodities. Rational bubble theory suggests that the price of an asset contains both fundamental values and bubbles. The identification and assessment of price bubbles in this paper include the following processes: First, the SADF and GSADF methods are used to distinguish whether crude oil price bubbles exist; Second, if bubbles exist, the duration of crude oil price bubbles is identified. Third, a composite score is calculated based on the established comprehensive assessment indicators to assess the risk of crude oil price bubbles in different markets.
(1) Test method of the price bubble
The SADF and GSADF methods [11–13] were used to identify crude oil price bubble prices. These two methods were selected due to their widespread adoption and practical applicability in analyzing price bubbles. The core of the price bubble test methodology stems from the ADF test, which has the following regression equation:
| (1) |
where is the crude oil price series, , , and are the regression coefficients, ; and the fractions and denote the starting and ending points for a rolling interval, . The original hypothesis is , and the alternative hypothesis is . The standard ADF statistic can be calculated by Equation (2).
| (2) |
Phillips et al. proposed the SADF method in 2011 [11], which uses a forward extended sample to recursively estimate Equation (1) in order to calculate the statistic. Fraction and fraction denote the starting and ending points for a rolling interval, respectively, ) is the window width, and is the minimum window width fraction. Equation (3) is the expression of the SADF statistic. When the SADF statistic is above the specified critical value, a bubble exists; when it is below the threshold, no bubble exists.
| (3) |
Phillips et al. proposed the GSADF method in 2015 [12, 13]. Fraction and fraction denote the starting and ending points for a rolling interval, respectively, ) is window width, and is the minimum window width fraction. Equation (4) is the expression of the GSADF statistic. When the GSADF statistic is above the specified critical value, a bubble exists; when it is below the value, no bubble exists.
| (4) |
(2) Date stamping of the price bubble
The GSADF method can identify multiple bubbles, so it is adopted in this paper to determine the duration of price bubbles. The BSADF series can be obtained by calculating the BSADF statistics at different time points and is defined in Equation (5).
| (5) |
where the bubble originated when (set to ), and the bubble terminated when (set to ). is % of the critical value of the SADF statistic based on the observations of . In this paper, the critical value of SADF at the 95% level is chosen as the test criterion.
| (6) | ||
| (7) |
(3) Risk assessment of price bubbles
This paper constructs assessment indicators of price bubble risk based on the assessment indicators proposed by Li et al. [23]. These indicators cover four main aspects.
a. The size of the price bubble. In this paper, the maximum value of the BSADF series is used as an indicator to assess price bubbles because, in accordance with Wang and Zhao [30], the maximum value of the BSADF series can be used to measure the size of a price bubble, and a larger BSADF value indicates a higher risk of a price bubble.
b. The frequency of price bubbles. This indicator is based on the number of bubbles, which can reflect the frequency of price bubbles.
c. The length of the price bubble. The length of individual price bubbles is determined by comparing the relationship between BSADF values and CV; the total bubble length of the price series is determined by summing the individual bubble lengths.
d. The strength of the price bubble. The maximum and minimum values of price volatility within each bubble period are separately identified after the price bubbles are determined. The value can be obtained by calculating the price return (). The specific indicators are shown in Table 1.
The price bubble risk assessment methodology is primarily used to assess the risk of price bubbles in different markets and to establish a foundation for monitoring and early warning of crude oil price movements. The assessment method should be practicable, easy to use, and comparable. In line with this approach, complex assessment models are not considered in this paper. Therefore, non-dimensional and indicator assignment methods are utilized.
a. By using the threshold method to remove the dimension from each indicator, the corresponding ratios were obtained.
b. The non-dimensional value of each indicator was multiplied by 100 to produce the corresponding score for the indicator.
c. The corresponding scores from the six indicators were summed to assess the risk of a crude oil price bubble. According to Equation (3.1), is the composite score.
| (8) |
Table 1 Price fluctuation evaluation indexes
| Indicator | Indicator | ||
| Categories | Name | Indicator Description | Calculation Method |
| Size of the price bubble | The maximum value in the BSADF sequence. | ||
| Frequency of price bubble | The total number of price bubbles. | ||
| Length of the price bubble | The total number of weeks of the price bubbles. | ||
| Maximum single bubble duration | |||
| Strength of price bubble | The maximum price return during the bubble period. | ||
| The minimum price return during the bubble period. |
3.2 Data
This paper uses weekly average crude oil spot prices for the period January 2003 to March 2023. The sample covers major regions in Europe, America, and Asia, and consists of six countries or regions, including Brent, OPEC, WTI, Daqing, Oman, and Dubai. Using data from the Wind database, the sample size for each region is 1056 (individual missing values are calculated by the arithmetic mean of two adjacent crude oil prices). Brent crude oil from the United Kingdom has a wide range of effects and was listed on the London International Petroleum Exchange in 1988. OPEC is a global organization of oil-producing nations from Asia, Africa, and Latin America. It was created primarily to coordinate the national oil policies of its members and is a significant global indicator of crude oil prices. WTI stands for light sweet crude oil, which is regarded as one of the benchmarks for crude oil prices [7]. The bigger oil field in China, Daqing, can be used to gauge oil prices in China. The crude oil prices in Omani and Dubai are representative of the price in the Middle East region. Crude oil prices in different countries or regions are shown in Figure 1. It can be seen a high level of consistency in crude oil prices across markets.
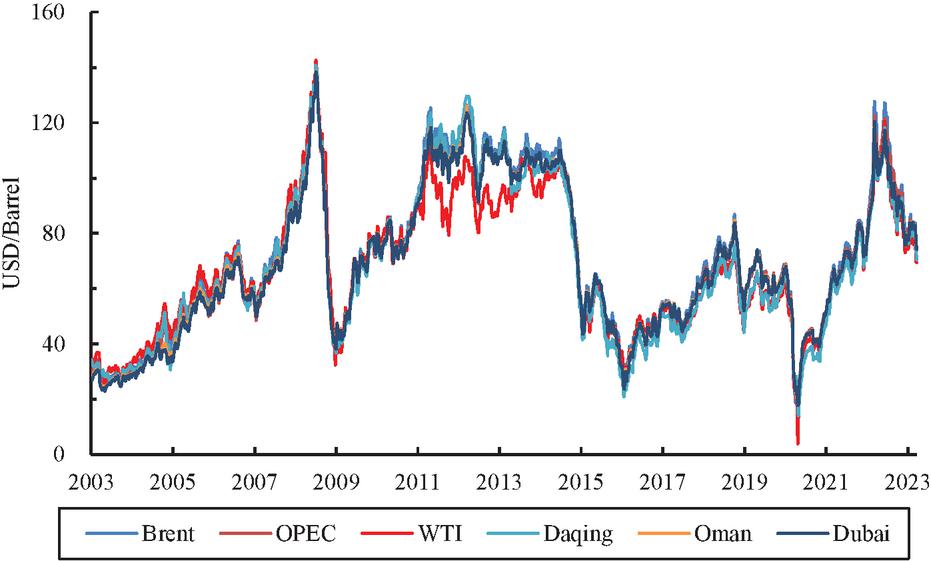
Figure 1 Crude oil spot prices in different markets.
4 Results and Discussion
4.1 Identification of Crude Oil Price Bubbles
The SADF and GSADF methods were used to identify price bubbles in different crude oil markets using the exuber package in R [31]. Table 2 lists the outcomes of the bubble test, and the statistics and critical values were calculated using 2000 Monte Carlo simulations. 90%, 95%, and 99% CV for SADF are 1.30, 1.56, and 2.10, respectively; 90%, 95%, and 99% CV for GSADF are 2.13, 2.31, and 2.78, respectively. The statistical values of the six crude oil markets for the SADF test are 2.830, 3.782, 2.803, 3.003, 4.130, and 4.114, which are all larger than 1.56, confirming the presence of price bubbles in different markets. The GSADF statistics for the six crude oil markets are 5.384, 6.584, 3.622, 4.349, 6.225, and 6.364, which are all larger than 2.31, confirming the presence of price bubbles in the six crude oil markets. Based on the test method employed, the SADF method successfully identifies a significant price bubble in crude oil, despite its lower test power and relatively less flexibility in terms of the window size compared to the GSADF method.
Table 2 Crude oil price bubble test
| Crude | SADF Test | GSADF Test | ||
| Oil Market | Test Stat. | Bubble | Test Stat. | Bubble |
| Brent | 2.830*** | Yes | 5.384*** | Yes |
| OPEC | 3.782*** | Yes | 6.584*** | Yes |
| WTI | 2.803*** | Yes | 3.622*** | Yes |
| Daqing | 3.003*** | Yes | 4.349*** | Yes |
| Oman | 4.130*** | Yes | 6.225*** | Yes |
| Dubai | 4.114*** | Yes | 6.364*** | Yes |
| Note: “***” indicate statistical significance at the 1% level. | ||||
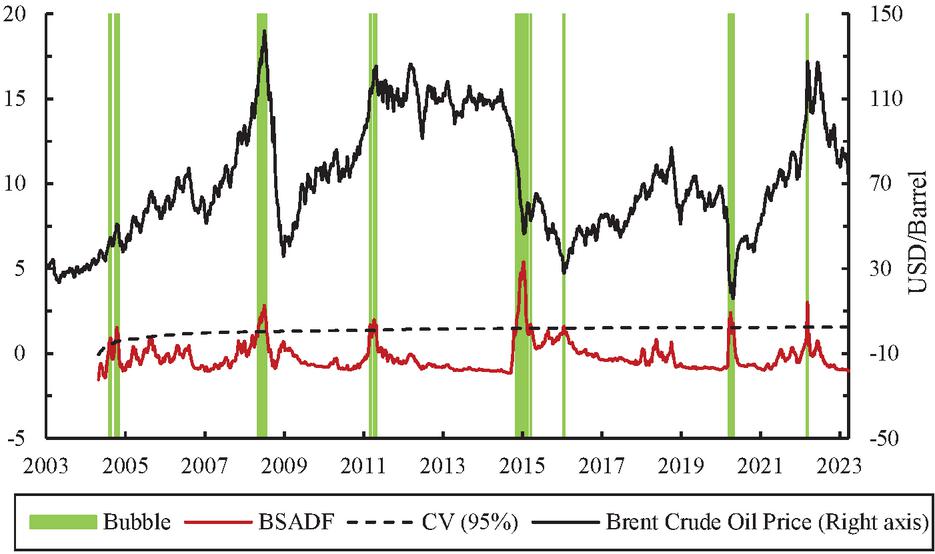
Figure 2 Brent crude price bubbles.
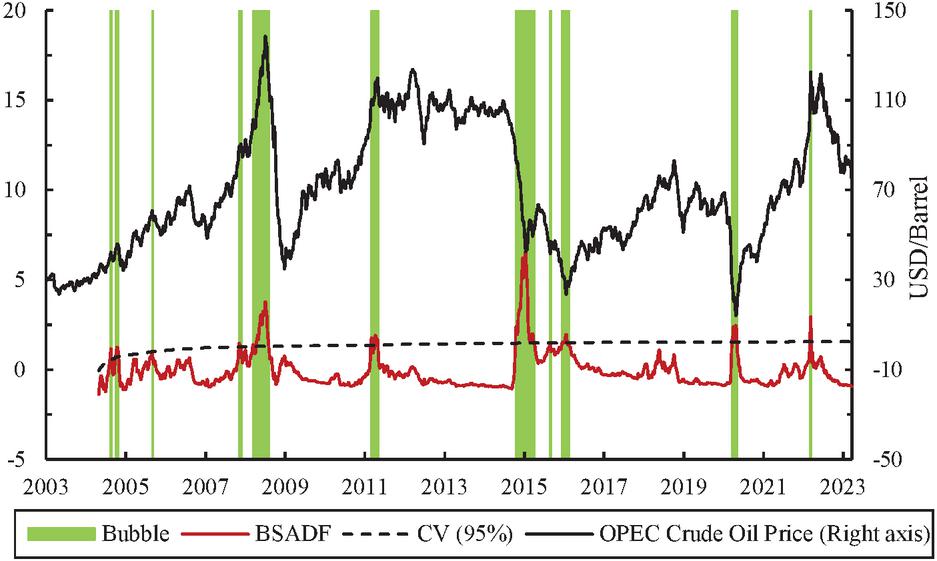
Figure 3 OPEC crude price bubbles.
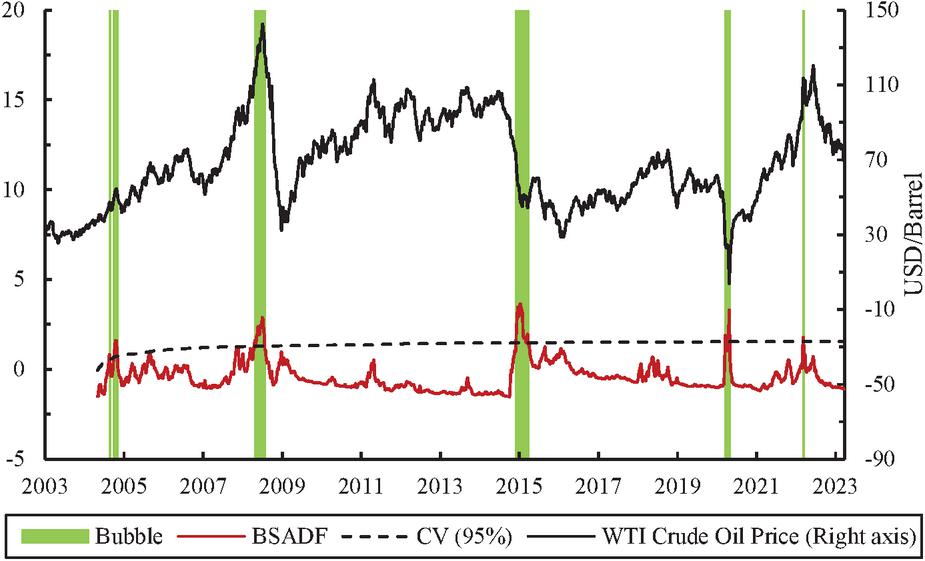
Figure 4 WTI crude price bubbles.
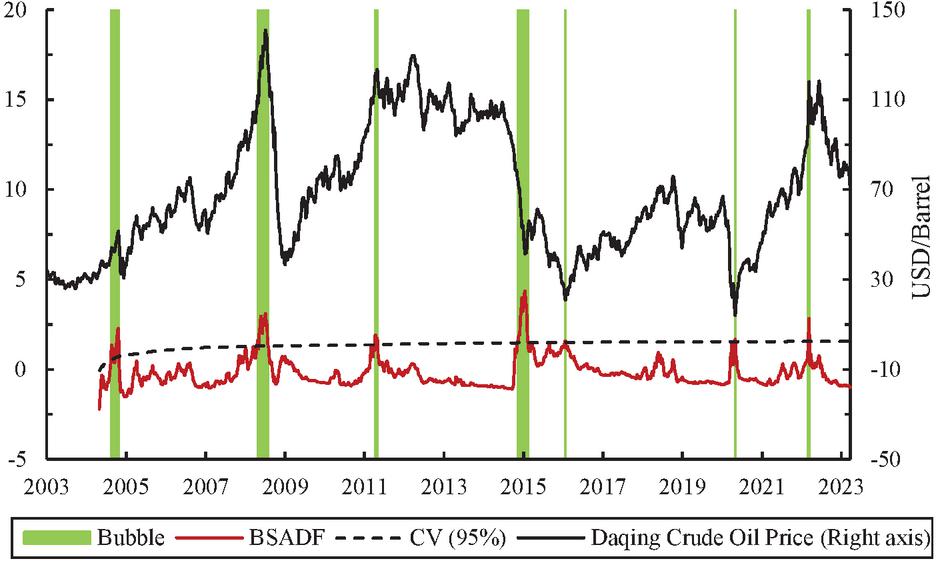
Figure 5 Daqing crude price bubbles.
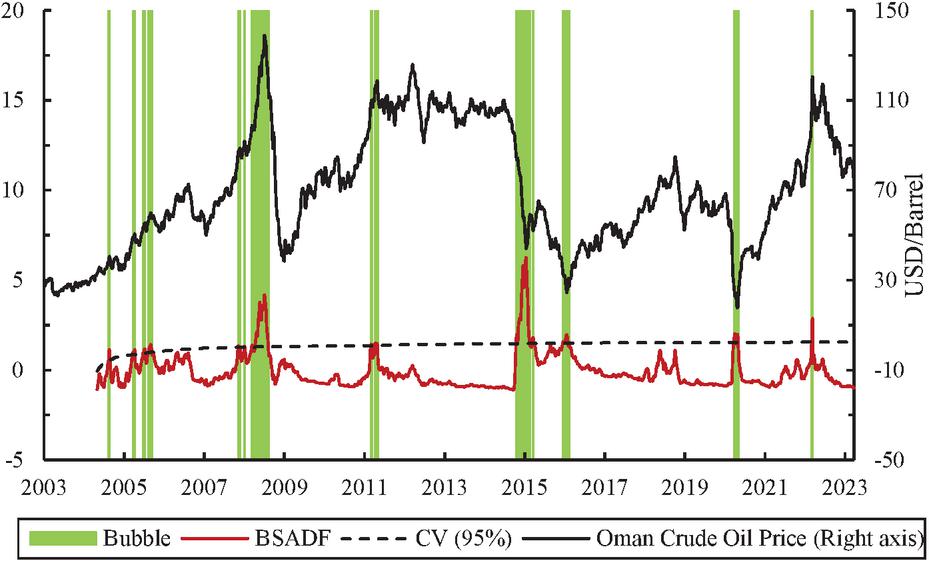
Figure 6 Oman crude price bubbles.
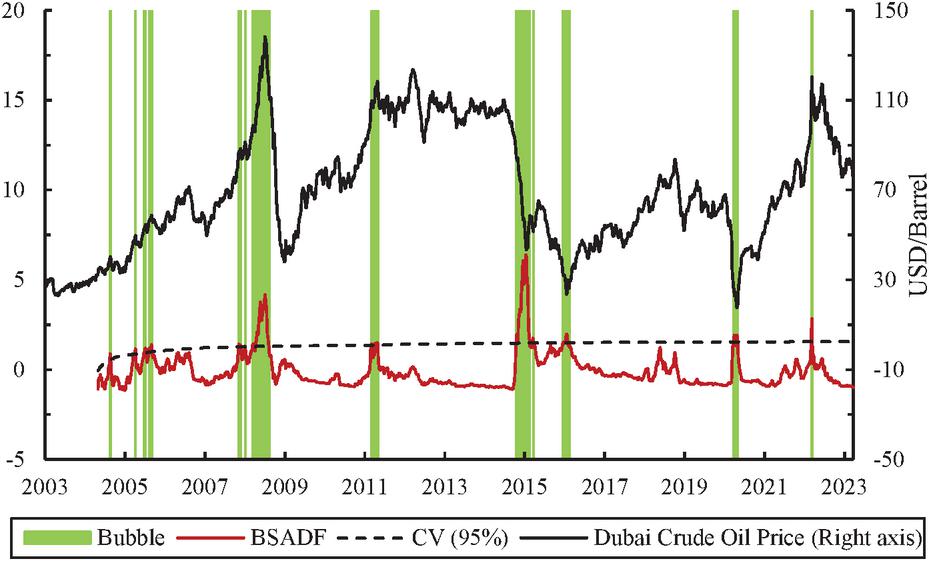
Figure 7 Dubai crude price bubbles.
This study employed the GSADF method to identify the duration of the crude oil price bubble. The CV series and BSADF series were computed using 2000 Monte Carlo simulations, and the CV series was determined with 95% confidence level. The duration of price bubbles in the different markets are shown in Figures 27, where the green shading is the bubble period of crude oil prices, the solid black line represents the spot price of crude oil, the dashed black line represents the 95% confidence level critical value, and the red line represents the BSADF series. According to the aforementioned method, the price bubble originates when the BSADF value exceeds the CV, and it terminates when the BSADF value drops below the SCV. It should be noted that the minimum window width calculated in this paper is 0.0654 (), and the minimum window size is 69 weeks. The specific dates of bubble origination and termination are shown in Appendix, Table 1 of this paper. Furthermore, Figure 8 presents the bubble duration of different markets.
This paper divides the crude oil price bubble into nine time periods based on the origination and termination points (see Appendix, Table 1), namely 2004, 2005, 2007, 2008, 2011, 2014–2015, 2015–2016, 2020, and 2022. In 2004, there were two price bubbles in Brent, OPEC, WTI, and Daqing, and only one price bubble in Oman and Dubai. There were no bubbles in the Brent, WTI, and Daqing crude oil markets in 2005, which may be related to the weak persistence of price increases. However, three other markets also experienced bubbles in 2005, with Oman and Dubai experiencing four bubbles, although each bubble was short-lived. The crude oil markets of OPEC, Oman, and Dubai all experienced two bubbles in 2007, and both had the same origination and termination points. This suggests a high degree of consistency in the relationships between the prices of the three markets. All the markets experienced bubbles in 2008. The maximum single bubble in OPEC crude oil lasted 17 weeks, the maximum single bubble in the market for crude oil in Dubai lasted 8 weeks, and the maximum single bubble in other markets for crude oil lasted more than 10 weeks. Except for WTI, all crude oil markets experienced bubbles in 2011, and the bubbles during this period were distinguished by short duration and high frequency. The 2014–2015 inter-annual bubble was characterized by a high number of bubbles and prolonged single bubbles in six markets; during this period, the maximum single bubble lasted 20 weeks on the OPEC market, 18 weeks in the Oman and Dubai markets, and more than 10 weeks in other markets. Except for WTI, other markets experienced bubbles in 2015–2016; the duration of single bubbles was short during this period; the OPEC, Oman, and Dubai markets experienced more bubbles than other markets. OPEC and Daqing markets experienced one bubble each in 2020, while the remaining markets experienced two bubbles. Six markets experienced bubbles in 2022. The bubbles in Brent, OPEC, Daqing, and Oman markets started on March 5 and ended on March 19, while the bubbles in WTI and Dubai markets started on March 12 and ended on March 19.
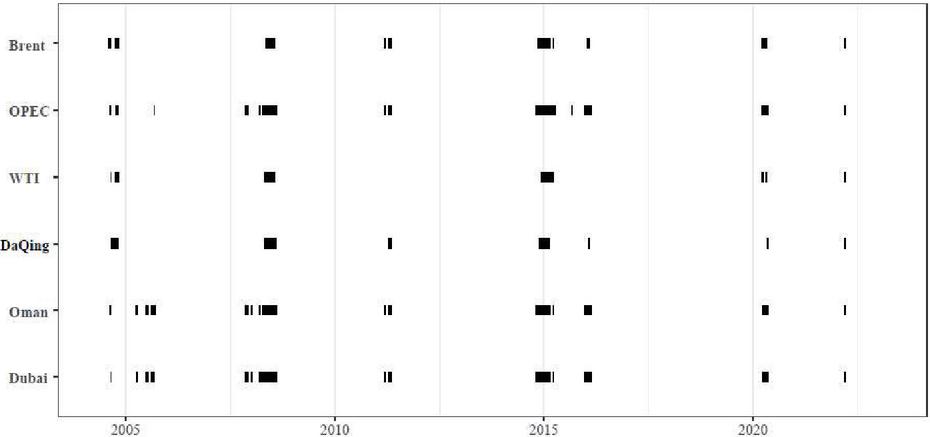
Figure 8 Comparison of duration of price bubbles in different crude oil markets.
Based on the price volatility theory and rational bubble theory, this paper compared the BSADF series with the critical value series to identify the price bubbles in six crude oil markets in different periods. The results exhibited a high level of consistency with the actual periods of surges and plunges in crude oil prices. In terms of the causes of price fluctuations, crude oil market prices deviate from their fundamental values and appear to surge and plummet within a short period due to the influence of supply and demand, external information, and unexpected events. For example, around 2008, crude oil prices increased rapidly due to the rapid growth in demand for crude oil in China, India, and other countries. Around 2015, shale oil development in the U.S. led to an increase in domestic crude oil production; at the same time, OPEC no longer had production limits on crude oil extraction by its member countries. The increase in supply affects the structure of supply and demand, leading to a rapid decline in crude oil prices. The COVID-19 outbreak in the first half of 2020 pulled down consumption and industrial production in the global market, resulting in lower crude oil prices. In March 2022, crude oil prices surged as the outbreak of the Russo-Ukrainian war triggered market concerns about crude oil supply. From the above analysis, it is clear that the formation of crude oil price bubbles is related to a specific economic environment. The volatility of crude oil prices, influenced by factors such as supply and demand dynamics and external shocks, often serves as a significant driver of crude oil price bubbles.
Table 3 Risk assessment results of crude oil price bubbles
| Crude | Bubble | Bubble | Bubble | Bubble | Bubble | |||
| Oil | Size | Frequency | Length | Strength | Assessment | |||
| Markets | Score | Ranking | ||||||
| OPEC | 6.58 | 17 | 73 | 20 | 15.78 | -28.96 | 493.73 | 1 |
| Dubai | 6.36 | 21 | 68 | 18 | 16.60 | -16.74 | 490.05 | 2 |
| Oman | 6.23 | 20 | 73 | 18 | 13.40 | -16.60 | 470.80 | 3 |
| Brent | 5.38 | 11 | 49 | 15 | 15.27 | -27.53 | 385.09 | 4 |
| WTI | 3.62 | 9 | 37 | 13 | 11.69 | -163.49 | 383.98 | 5 |
| Daqing | 4.35 | 9 | 43 | 13 | 15.13 | -11.70 | 331.17 | 6 |
4.2 Risk Assessment of Crude Oil Price Bubble
In this study, the risk of crude oil price bubbles in different markets was further assessed from the perspective of price bubbles by establishing comprehensive assessment indicators. The results are shown in Table 3. According to BSADF values in the range of 3.62 to 6.58, the bubbles are the largest in the OPEC market and the smallest in the WTI market. The number of price bubbles varies significantly across crude oil markets, with Dubai crude oil having the highest number of 21, and Daqing and WTI crude oil having the lowest numbers of 9. In the analysis conducted, it was observed that the WTI price bubble had the shortest duration, lasting for a total of 37 weeks, which accounts for 3.50% of the sample size (37/1056*100%); whereas the OPEC price bubble had the longest duration, lasting for 73 weeks, accounting for 6.91% of the sample size (73/1056*100%). The maximum single bubble for OPEC crude oil prices was 20 weeks, while the maximum single bubble for Daqing crude oil prices was 13 weeks. In terms of the strength of the oil bubble, the Dubai crude oil market experienced the largest increase in crude oil prices during the bubble period for two adjacent periods, with an increase of 16.60%; in contrast, the WTI crude oil market experienced a plummet in crude oil prices for two adjacent periods, with a significant drop of 163.49%. This decline was attributed to the unprecedented event on April 20, 2020, when the price of WTI fell to $37.63/barrel, which caused the weekly average to fall to 3.92 USD/barrel.
According to the results of the comprehensive assessment, the comprehensive scores in Dubai, and Oman are all above 450, indicating a high level of risk; whereas the comprehensive scores in Brent, WTI, and Daqing are below 400, indicating a low level of risk. Overall, there are notable regional differences in the risk of price bubbles across different markets for crude oil. The high risk of price bubbles in the OPEC, Dubai, and Oman markets could be attributed to the political instability and military conflicts in these nations or regions. Frequent conflicts increase market risk and crude oil supply volatility, as well as lengthen the time needed to build new oil fields and restart production after infrastructure has been destroyed. Daqing is primarily influenced by WTI and Brent markets [32], and the number and duration of crude oil price bubbles are small and short, so the bubble risk is low, which may be related to China’s crude oil policy and market openness. Brent and WTI markets are more mature and have more comprehensive risk-coping tools, and the prices are relatively stable except for large fluctuations at individual times, so the risk level is not high.
4.3 Discussion of Sustainable Energy Policies
According to the findings of the identification and risk assessment of crude oil price bubbles, it is evident that bubbles exist in different crude oil markets. Crude oil price bubbles are vital determinants of sustainable energy policies and present a significant challenge to economic sustainability, environmental sustainability, and energy security [2]. Regarding economic sustainability, crude oil price bubbles increase uncertainty and threaten the sustainability of economic growth. The results of the bubble test show that the world’s major crude oil markets have experienced frequent price bubbles. Countries that rely on crude oil exports are more vulnerable to price fluctuations and have more fragile economies; in addition, a crude oil price bubble could increase inflation. In terms of environmental sustainability, a positive bubble in crude oil prices, such as the sustained increase in crude oil prices from January 2007 to July 2008, objectively stimulates the extraction of crude oil in crude oil-exporting countries and may affect the ecology of oil-producing regions. If there is a negative bubble in crude oil prices, low oil prices are likely to stimulate an increase in crude oil usage. Excessive use of fossil energy may destroy the ecosystem and affect environmental sustainability. In terms of energy security, the crude oil price bubble risk assessment results show that the OPEC, Dubai, and Oman crude oil price bubble risks are relatively high. These countries and organizations account for a large share of oil production and are the major oil-producing regions in the world. If there is a sustained price bubble in these countries, it will pose a greater threat to the energy security of other countries. Countries have started to study sustainable energy policies to deal with the effects of price bubbles [33]. Based on the above analysis, this paper proposes sustainable energy policies for crude oil importers and exporters.
For net crude oil importers such as China, sustainable energy policies can be established in four ways. First, improve the crude oil price formation mechanism and taxation policy. Crude oil prices should reflect the market’s supply and demand as well as the cost of environmental management, taking into account its scarcity and non-renewability. Use carbon taxes and environmental protection taxes to limit the development of energy-intensive industries, reduce energy consumption, and reduce carbon emissions [34]. Second, improve energy utilization efficiency. Promote energy efficiency through technological innovation to lower energy consumption in buildings, transportation, and industry, actively develop renewable energy industries [35], such as solar, wind, tidal, bioenergy, etc., and provide financial support to these industries. Third, build diversified crude oil import channels. Increase cooperation between energy exporting and importing countries by diversifying crude oil imports to offset the current lack of domestic production and reduce the impact of price bubbles on domestic energy imports and by making investments in energy exporting countries to create stable crude oil import channels and diversify import risks. Fourth, strengthen the price early warnings for major world energy markets. For energy-importing countries, in addition to diversifying the channels of energy imports, it is also important to have early warning of price fluctuation in the world’s major energy markets. On one hand, the existing price early warning technology to reduce the market risk should be improved, and the application of big data technology in crude oil data collection, processing, and early warning should also be introduced on the other hand.
For countries that export crude oil, such as Oman and the UAE, sustainable energy policies can be established in four ways. First, establish a multi-level crude oil price early warning system. Build a comprehensive data platform to provide timely warning of long-lasting and destructive bubbles and mitigate the effect of crude oil price bubbles on the economy. Second, optimize industrial structures and locations. Increase the energy sector’s integration with other industries, support the extraction of crude oil as a basis for the cooperative growth of numerous industries, and achieve industrial diversification. Utilize the latest technologies to minimize environmental harm caused by crude oil extraction; innovate energy technologies to reduce environmental pollution, and increase the efficiency of crude oil usage. Third, accelerate the construction of new energy projects. Build wind and solar energy generation projects in regions with abundant wind and solar energy to ensure the sustainability of the energy supply while reducing reliance on crude oil for economic growth. Fourth, establish a specialized agency to formulate a unified sustainable energy policy. The specialized agencies should consider the relationship between economic development, environmental protection, and energy security comprehensively when making the energy policies. The goal of sustainable energy policy should be to achieve sustainable economic development based on ensuring energy security and ecological and environmental friendliness.
5 Conclusion
This paper examines crude oil price bubbles in Brent, OPEC, WTI, Daqing, Oman, and Dubai using data from January 2003 to March 2023 and discusses sustainable energy policies. The main findings of the paper are as follows: (1) Price bubbles exist in all major global crude oil markets. The results of the SADF and GSADF tests indicate that crude oil price bubbles exist in six markets. (2) Price bubbles in different crude oil markets have been linked and distinct. The crude oil price bubble can be divided into 9 time periods. The duration of price bubbles in different markets partially overlaps, but the size, frequency, length, and strength of the bubbles vary in different markets. (3) The risk of crude oil price bubbles has significant regional characteristics. According to the risk assessment of price bubbles, OPEC, Oman, and Dubai exhibited a high risk of price bubbles, which may be attributed to political instability and military conflicts in these oil-producing countries. Brent and WTI exhibited a low risk of crude oil price, which is probably because these two markets are more mature and have well-established risk management tools. Daqing has the lowest market price bubble, which reflects the influences of China’s energy policy and market openness. (4) Sustainable energy policies are suggested. In order to achieve sustainability in economic development, ecological environment, and energy security, this study suggests to establishe sustainable energy policies from the viewpoints of both crude oil importing and exporting countries.
Acknowledgments
This work was supported by: Modern Agricultural Industry Technology System of Hebei Province corn innovation team industrial economy Project (HBCT2023020301); 2021 Hebei Social Science Development Research Project (20210101042); Humanities and Social Science Youth Fund Project of Ministry of Education: Study on the impact of emergencies on pork price fluctuations and the transmission mechanism (20YJC790095).
Appendix
Table 1 The bubble duration in different crude oil markets
| Crude Oil Markets | Brent | OPEC | WTI | Daqing | Oman | Dubai |
| 2004 | 2004/08/07-2004/08/28 2004/10/02-2004/11/06 | 2004/08/14-2004/08/28 2004/10/09-2004/10/30 | 2004/08/21-2004/08/28 2004/10/02-2004/11/06 | 2004/08/21-2004/09/18 2004/09/25-2004/10/30 | 2004/08/14-2004/08/28 | 2004/08/21-2004/08/28 |
| 2005 | N/A | 2005/09/03-2005/09/10 | N/A | N/A | 2005/03/26-2005/04/02 2005/04/09-2005/04/16 2005/06/25-2005/07/16 2005/08/13-2005/09/17 | 2005/04/09-2005/04/16 2005/06/25-2005/07/02 2005/07/09-2005/07/16 2005/08/13-2005/09/10 |
| 2007 | N/A | 2007/11/10-2007/11/172007/11/24-2007/12/01 | N/A | N/A | 2007/11/10-2007/11/17 2007/11/24-2007/12/01 | 2007/11/10-2007/11/17 2007/11/24-2007/12/01 |
| 2008 | 2008/05/10-2008/07/26 | 2008/03/15-2008/03/22 2008/04/12-2008/08/09 | 2008/04/26-2008/05/03 2008/05/10-2008/07/26 | 2008/04/26-2008/05/03 2008/05/10-2008/08/02 | 2008/01/05-2008/01/12 2008/03/15-2008/03/22 2008/04/12-2008/08/16 | 2008/01/05-2008/01/12 2008/03/15-2008/03/29 2008/04/12-2008/08/16 |
| 2011 | 2011/03/05-2011/03/19 2011/04/09-2011/05/07 | 2011/03/05-2011/03/19 2011/04/09-2011/05/07 | N/A | 2011/04/09-2011/05/07 | 2011/03/05-2011/03/19 2011/04/09-2011/04/23 2011/04/30-2011/05/07 | 2011/03/05-2011/03/19 2011/04/09-2011/04/23 2011/04/30-2011/05/07 |
| 2014–2015 | 2014/11/08-2015/02/21 2015/03/21-2015/03/28 | 2014/10/18-2015/03/07 2015/03/14-2015/04/11 2015/08/29-2015/09/05 | 2014/12/06-2015/03/07 2015/03/14-2015/03/28 | 2014/11/15-2015/02/14 | 2014/10/18-2015/02/21 2015/03/21-2015/03/28 | 2014/10/18-2015/02/21 2015/03/21-2015/03/28 |
| 2015–2016 | 2016/01/16-2016/01/30 | 2015/12/19-2016/01/02 2016/01/09-2016/02/06 2016/02/13-2016/02/20 | N/A | 2016/01/23-2016/01/30 | 2015/12/19-2016/02/06 2016/02/13-2016/02/20 | 2015/12/19-2016/01/02 2016/01/09-2016/02/06 2016/02/13-2016/02/20 |
| 2020 | 2020/03/21-2020/04/11 2020/04/25-2020/05/02 | 2020/03/21-2020/05/09 | 2020/03/21-2020/04/04 2020/04/25-2020/05/02 | 2020/05/02-2020/05/09 | 2020/03/28-2020/04/11 2020/04/18-2020/05/09 | 2020/03/28-2020/04/11 2020/04/18-2020/05/09 |
| 2022 | 2022/03/05-2022/03/19 | 2022/03/05-2022/03/19 | 2022/03/12-2022/03/19 | 2022/03/05-2022/03/19 | 2022/03/05-2022/03/19 | 2022/03/12-2022/03/19 |
References
[1] Liu Tie-Ying, Lee Chien-Chiang. “Will the energy price bubble burst?”, Energy, vol. 150, pp. 276–288, 2018.
[2] Knez Sandi, Šimić Goran, Milovanović Anica, et al. “Prices of conventional and renewable energy as determinants of sustainable and secure energy development: Regression model analysis”, Energy, Sustainability and Society, vol. 12, no. 1, 2022.
[3] Dillon Brian M., Barrett Christopher B. “Global oil prices and local food prices: Evidence from east africa”, American Journal of Agricultural Economics, vol. 98, no. 1, pp. 154–171, 2016.
[4] Bozkurt Eda. “Renewable energy and economic efficiency in the framework of sustainable development: Malmquist index and tobit model”, Strategic Planning for Energy and the Environment, vol. 40, no. 2, pp. 163–174, 2021.
[5] Gong Xu, Lin Boqiang. “Time-varying effects of oil supply and demand shocks on China’s macro-economy”, Energy, vol. 149, pp. 424–437, 2018.
[6] Aytekin Ahmet. “Energy, environment, and sustainability: A multi-criteria evaluation of countries”, Strategic Planning for Energy and the Environment, vol. 41, no. 3, pp. 281–316, 2022.
[7] Su Chi-Wei, Li Zheng-Zheng, Chang Hsu-Ling, et al. “When will occur the crude oil bubbles?”, Energy Policy, vol. 102, pp. 1–6, 2017.
[8] Lammerding Marc, Stephan Patrick, Trede Mark, et al. “Speculative bubbles in recent oil price dynamics: Evidence from a Bayesian Markov-switching state-space approach”, Energy Economics, vol. 36, pp. 491–502, 2013.
[9] Gharib Cheima, Mefteh-Wali Salma, Serret Vanessa, et al. “Impact of COVID-19 pandemic on crude oil prices: Evidence from Econophysics approach”, Resources Policy, vol. 74, p. 102392, 2021.
[10] Alola Andrew Adewale. “Evidence of speculative bubbles and regime switch in real estate market and crude oil price: Insight from Saudi Arabia”, International Journal of Finance & Economics, vol. 26, no. 3, pp. 3473–3483, 2021.
[11] Phillips Peter CB, Wu Yangru, Yu Jun. “Explosive behavior in the 1990s Nasdaq: When did exuberance escalate asset values?”, International Economic Review, vol. 52, no. 1, pp. 201–226, 2011.
[12] Phillips Peter CB, Shi Shuping, Yu Jun. “Testing for multiple bubbles: Limit theory of real-time detectors”, International Economic Review, vol. 56, no. 4, pp. 1079–1134, 2015.
[13] Phillips Peter CB, Shi Shuping, Yu Jun. “Testing for multiple bubbles: Historical episodes of exuberance and collapse in the S&P 500”, International Economic Review, vol. 56, no. 4, pp. 1043–1078, 2015.
[14] Bian Weihong, Hao Yi, Zhu Tingting. “Study on the factors dominating the global crude oil price trend—Based on the perspective of commodity properties and financial properties”, Tsinghua Financial Review, no. 11, pp. 109–112, 2019.
[15] Lu Quanying, Chai Jian, Cao Puju, et al. “Analysis of the impact of world crude oil supply block on China’s economy: A case study of US oil sanctions against Iran”, Systems Engineering-Theory & Practice, vol. 42, no. 07, pp. 1735–1754, 2022.
[16] Balcilar Mehmet, Ozdemir Zeynel Abidin, Yetkiner Hakan. “Are there really bubbles in oil prices?”, Physica A: Statistical Mechanics and its Applications, vol. 416, pp. 631–638, 2014.
[17] Watanabe Kota, Takayasu Hideki, Takayasu Misako. “A mathematical definition of the financial bubbles and crashes”, Physica A: Statistical Mechanics and its Applications, vol. 383, no. 1, pp. 120–124, 2007.
[18] Umar Muhammad, Su Chi-Wei, Rizvi Syed Kumail Abbas, et al. “Driven by fundamentals or exploded by emotions: Detecting bubbles in oil prices”, Energy, vol. 231, p. 120873, 2021.
[19] Xu Hua, Wang Minggang, Yang Weiguo. “Spatiotemporal dynamics analysis and systemic risk measurement of energy price system based on complex network”, Physica A: Statistical Mechanics and its Applications, vol. 526, p. 120702, 2019.
[20] Buczyński Mateusz, Chlebus Marcin. “Old-fashioned parametric models are still the best: A comparison of value-at-risk approaches in several volatility states”, The Journal of Risk Model Validation, vol. 14, pp. 1–20, 2020.
[21] Yan Fulei, Zhang Yutong, Cui Zhongyue, et al. “Macro uncertainty and crude oil price risk based on nonparametric multiple expectile”, Chinese Journal of Management Science, vol. 30, no. 12, pp. 222–233, 2022.
[22] Zhang Youwang, Xu Yueyan, Xing Xiaoke. “Measurement and comparison of bubble risk in China and the United States cotton futures market”, Journal of China Agricultural University, vol. 26, no. 12, pp. 253–262, 2021.
[23] Li Jian, Li Chongguang. “Risk Assessment in Agricultural Futures Markets: A New Analytical Framework based on a Model of Price Bubble Detection”, Chinese Rural Economy, no. 05, pp. 73–87, 2017.
[24] Hau Liya, Zhu Huiming, Huang Rui, et al. “Heterogeneous dependence between crude oil price volatility and China’s agriculture commodity futures: Evidence from quantile-on-quantile regression”, Energy, vol. 213, p. 118781, 2020.
[25] Gharib Cheima, Mefteh-Wali Salma, Jabeur Sami Ben. “The bubble contagion effect of COVID-19 outbreak: Evidence from crude oil and gold markets”, Finance Research Letters, vol. 38, p. 101703, 2021.
[26] Chang Ting-Huan, Su Hsin-Mei. “The substitutive effect of biofuels on fossil fuels in the lower and higher crude oil price periods”, Energy, vol. 35, no. 7, pp. 2807–2813, 2010.
[27] Sandholt Kaare, Pedersen Niels Bisgaard. “Observing denmark’s long-term strategy for green transformation – transition from the Cost-Effective development model to energy conservation and sustainable development”, Frontiers – A Journal of Women Studies, no. 01, pp. 22–34, 2015.
[28] Mohsin M., Zhou P., Iqbal N., et al. “Assessing oil supply security of South Asia”, Energy, vol. 155, pp. 438–447, 2018.
[29] Yan Jiyao, Zhao Yuan, Cui Panpan, et al. “Evolution of temporal and spatial pattern of china’s crude oil import trade from the perspective of petroleum security”, Economic Geography, vol. 40, no. 11, pp. 112–120, 2020.
[30] Wang Shaoping, Zhao Zhao. “The salient risk points in china’s capital market and the counterfactual simulation of supervision and regulation”, Social Sciences in China, no. 11, pp. 44–63, 2019.
[31] Vasilopoulos Kostas, Pavlidis Efthymios, Martínez-García Enrique. “Exuber: Recursive Right-Tailed Unit Root Testing with R”, Journal of Statistical Software, vol. 103, no. 10, 2022.
[32] Xiao Xiaoyong, Huang Jing. “Dynamic connectedness of international crude oil prices: The diebold–yilmaz approach”, Sustainability, vol. 10, no. 9, p. 3298, 2018.
[33] Bhandari Medani P. “Editorial strategic planning for energy and the environment: Theories, practice and the future”, Strategic Planning for Energy and the Environment, vol. 39, no. 1-4, pp. 381–402, 2021.
[34] Guo Yadong, Zhao Meina. “Research on Sustainable Energy Development From the Perspective of Focusing on Carbon Peaking and Neutrality”, Strategic Planning for Energy and the Environment, vol. 41, no. 3, pp. 345–362, 2022.
[35] Wang Hongyan, Zhang Zihong, Gao Ning. “Design of renewable energy consumption scheduling model based on quantitative feedback theory”, Strategic Planning for Energy and the Environment, vol. 42, no. 1, pp. 57–78, 2022.
Biographies

Jiayue Wang works in College of Accounting, Hebei University of Economics and Business. His research interest include energy price and policy, agricultural prices, asset valuation.

Kun Ma works in School of Economics and Management, Hebei University of Science and Technology. Her research interests include market risk of agricultural and forestry products, development of agriculture and forestry industry, energy price and policy.

Ling Zhang works in college of Economics and Management, Hebei Agricultural University. Her research interests include energy price and policy, finance and accounting, anti-poverty theory and practice.

Jinghong Wei works in college of Economics and Management, Hebei Agricultural University. Her research interests include finance and asset evaluation, agricultural economic management policy.

Jianzhong Wang works in college of Economics and Management, Hebei Agricultural University. His research interests include agricultural prices, energy price and policy, asset management and evaluation.
Strategic Planning for Energy and the Environment, Vol. 43_2, 189–214.
doi: 10.13052/spee1048-5236.4321
© 2024 River Publishers