An Empirical Study on the Relationship Between Energy Transformation and Economic Growth – Based on Ramsey Model
Huan Liu
International Business College, Hunan International Business Vocational College, Changsha, 410000, China
E-mail: Huan_Liu2023@outlook.com
Received 08 June 2023; Accepted 23 August 2023; Publication 09 January 2024
Abstract
The study analyzed the interactive relationship between energy transformation and economic growth through the Ramsey model. The energy factor was introduced as an independent factor into the Ramsey model and an application improvement design was carried out. From a micro perspective, the impact of energy and economic factors on net output was analyzed. The research results indicate that the estimated coefficients of fossil energy output elasticity, labor output elasticity, capital output elasticity, and renewable energy output elasticity are 0.740602, 0.708407, 0.454672, and 0.304065, respectively. In addition, the significance tests were all below 0.05, indicating significance. Meanwhile, the elasticity of capital output and labor output complement each other; The output elasticity of fossil fuels and renewable energy are also complementary to each other. In a complementary relationship, the downward trend of one element is often accompanied by the upward trend of another element. This study sorts out the interactive relationship between energy transformation and economic growth, pointing out the direction for the future development of China’s energy economy.
Keywords: Energy transformation, economic growth, Ramsey model, saddle path.
1 Introduction
With the development of science and technology and the progress of the times, the main energy types of social economy have undergone two important transformations. The first was the coal transformation in the 18th century with industrialization; The second is the refined oil transformation with the deepening of industrialization. Both transformations are towards relatively more efficient fossil energy [1–3]. However, with the continuous development of global industry, people realize that fossil energy itself has the limitation of being unsustainable. In addition, fossil energy will cause large-scale environmental pollution in the process of industrial application. Therefore, the third energy transformation is extremely necessary. At the same time, the third energy transformation in the world is bound to be the adjustment of energy application structure. This energy transition is from unsustainable energy dependence to sustainable energy dependence [4–6]. The main problem in this global energy transformation is how to ensure the level of economic growth while carrying out the energy transformation. In the past, the production and operation modes of major industries and the lifestyle of the people depend largely on unsustainable energy. Therefore, the lack of technical support and policy advantages in the process of transformation is likely to cause economic stagnation or even recession. This study mainly focuses on the relationship between energy transformation and economic growth [7–9]. In the study of economic growth, Ramsey model is a more suitable tool to analyze economic growth. This model can provide a theoretical basis for China’s energy transformation. Meanwhile, this study also contributes to the overall implementation of sustainable development strategy. The purpose of the study is to provide a stable path for the economic development of the special stage of energy transformation, and to guide the economic development of clean.
In this study, the Ramsey model will be used to analyze the relationship between economic growth and energy transformation. The Ramsey model is a dynamic optimization model that can explain the impact of capital accumulation on economic growth, making it very suitable for studying the impact of energy transformation on economic growth. We will analyze the impact of energy transformation on economic growth based on the prediction results of the Ramsey model, and propose corresponding policy recommendations accordingly. In addition, it will also explore how to promote energy transformation through technological innovation and policy optimization. We will study the economic benefits of various sustainable energy technologies and explore how to promote them through policy measures. Our goal is to find a path that can both ensure economic growth and achieve energy transformation. Through this study, it is hoped to provide theoretical support for energy transformation and practical guidance for policy makers. We believe that only through scientific theoretical research and policy guidance can we achieve a win-win situation between economic growth and energy transformation.
2 Related Works
As one of the main models of economic analysis, Ramsey model has gradually been widely used in recent years. Li Y et al. applied the inverse Ramsey model to the pricing research of China’s electricity market and analyzed the unique cross-subsidy phenomenon in China’s electricity market. The formation process of Ramsey’s pricing optimization under the electricity market pricing based on social equity is discussed experimentally. The research results show that the pricing weight of the residential sector should be higher than that of the industrial sector [10]. Nævdal conducted a new exploration of Ramsey’s growth model. The research results showed that when the capital stock became zero, the shadow price of capital would become infinite. At the same time, the study also found that the stable saddle path between the model state variables and the shadow price of capital in the model phase diagram had an unrecognized economic explanation [11]. Morooka analysed the current situation of the limited repeated game between the government and the private sector under the free market environment. Among them, the government behavior elements and the private sector behavior elements took a group of non-negative real numbers as the main form to modify each other’s behavior alternately. The study found that the invalid Nash equilibrium was difficult to establish in this policy game. However, Ramsey model could be perfectly constructed in this Asian game environment and form the optimal result [12]. Nakamura used Ramsey model to analyze the distribution of long-term social wealth. In the process of analysis, all social individuals had been set the same time preference rate, with different inter-periods instead of elasticity. The research results showed that the use of interpterion to replace the heterogeneity between families could prove that the function of long-term wealth distribution has not been degraded [13].
In addition, with the gradual emergence of the world’s energy problems, discussions on energy transformation are also increasing. The Gielen team analyzed the technical problems and economic characteristics of energy transformation from the current stage to 2050. The research was mainly based on renewable energy data sets; Renewable energy technology and energy efficiency were the main factors for discussion. The experimental analysis showed the impact of their synergy on economic development and environmental protection. The research used wind energy, solar photovoltaic and other technologies to improve the productivity and promotion rate of renewable energy, supplemented by efficient energy management. The research results showed that this strategy can promote economic growth while protecting the environment [14]. Wang team discussed the efficient energy conversion and new material design in the process of energy transformation from technical details. The research started with graphene, a material with high conductivity and surface area, and used the co-doping effect to realize the redistribution of surface charge. The research results showed that this material can solve the material problem in energy shortage [15]. Wang team carried out a limited mixed model balance panel data analysis for 27 provinces in China from 2000 to 2015. The study started from the three elements of clean energy production and consumption, environmental and social regulation and economic growth, and comprehensively evaluated the relationship between them. Meanwhile, the study also considered the consumption of clean energy in the calculation process to avoid measurement errors. The results showed that there was a crucial relationship among environmental regulation, clean energy consumption and economic growth; Environmental regulation had promoted the positive impact of clean energy consumption on economic growth [16]. The Fan W team analyzed the energy consumption structure under the gradual intensification of foreign investment and rapid economic development in China. The study analyzed the relationship between China’s renewable energy consumption, foreign investment and GDP. Co-integration test and impulse response function were the main means of the study. The research results showed that there is a stable equilibrium relationship among GDP, foreign investment and renewable energy consumption [17]. Ahmad team analyzed the relationship between construction industry growth and economic growth in the process of urbanization. Taking energy consumption and environmental pollution as the main consideration variables, the experiment explored the interaction between the construction industry, energy structure, urbanization process and the polluted environment. The study used a random regression model for analysis. The research results showed that there was a long-term balanced and stable relationship between the construction industry, energy structure, urbanization process and pollution environment. In addition, urbanization and the transformation of the energy structure of the construction industry contributed to economic growth [18].
The study analyzed the interactive relationship between energy transformation and economic growth through the Ramsey model. The energy factor was introduced as an independent factor into the Ramsey model and an application improvement design was carried out. From a micro perspective, the impact of energy and economic factors on net output was analyzed. The research results indicate that the estimated coefficients of fossil energy output elasticity, labor output elasticity, capital output elasticity, and renewable energy output elasticity are 0.740602, 0.708407, 0.454672, and 0.304065, respectively. In addition, the significance tests were all below 0.05, indicating significance. Meanwhile, the elasticity of capital output and labor output complement each other; The output elasticity of fossil fuels and renewable energy are also complementary to each other. In a complementary relationship, the downward trend of one element is often accompanied by the upward trend of another element. This study sorts out the interactive relationship between energy transformation and economic growth, pointing out the direction for the future development of China’s energy economy. In addition, many studies consider the energy factor as one of the capital factors, which makes the particularity of energy itself ignored. Therefore, this study selects Ramsey model to conduct micro-based macroeconomic analysis. The experiment separates energy elements from capital elements and explores the interaction between energy transformation and economic growth.
3 Ramsey Model Design for the Dynamic Relationship Between Energy Transformation and Economic Growth
3.1 Ramsey Model Design Integrating Energy Elements
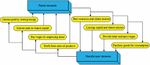
Ramsey model is one of the main tools for macroeconomic analysis at present, and its consideration of capital stock changes is based on the balance between family utility and manufacturer’s interests in the competitive market environment. Therefore, savings can be viewed as an endogenous variable in Ramsey’s model. It is the Ramsey model, which bases the macro dynamic analysis of the economy on the micro perspective, that makes it possible to measure the economic growth formed by the inter temporal impact. This is also the reason why Ramsey model is selected in this study. The research mainly uses Ramsey model to analyze the relationship between energy transformation and economic growth. The experiment will discuss the family perspective and the manufacturer market in a completely competitive market environment. From the perspective of family, utility maximization is the main goal; From the perspective of manufacturers, profit maximization is the main goal. On this basis, we analyze the growth path of the two countries to achieve steady equilibrium under the dynamic relationship. Ramsey model mainly follows the three main elements of capital, labor and technology in the neoclassical economic growth theory. The model lacks a separate consideration of energy and considers energy as one of the sources of materials. However, from the perspective of capital, there is a huge difference between energy elements and material elements, and its essence is affected by natural factors such as time and place. The energy factor also plays a certain role in promoting the occurrence of the capital factor. Therefore, the energy factor is considered as an independent factor in this study. At this time, the Ramsey model studied and designed includes four main elements, namely capital (), labor (), technology () and energy (). The relationship between family and manufacturer is shown in Figure 1.
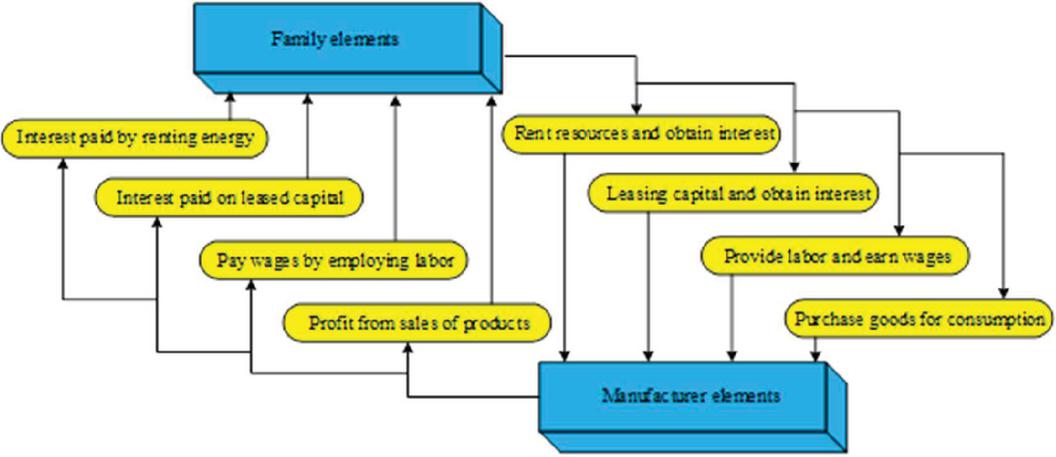
Figure 1 Relationship between family and manufacturer.
It can be seen from Figure 1 that households can provide three elements of labor, energy and capital for manufacturers; Manufacturers provide capital, wages and energy rents for families in return. First, the experiment sets the elements from the perspective of family. It is assumed that there are a large number of family members in the perfectly competitive market. Any member can provide unit labor for the manufacturer at any time point. Then the total labor force at time is shown in formula (1).
| (1) |
In formula (1), represents the labor force growth index. From the perspective of technological progress, technological progress can be divided into three neutral concepts, namely Harold neutral, Hicks neutral and Solo neutral. In Harold’s neutral concept, the distribution of relative factor income does not change with time when the capital output ratio is fixed; In Hicks’ neutral concept, the distribution of relative factor income does not change with time when the ratio of capital to labor is fixed; In Solow’s neutral concept, the distribution of relative factor income does not change with time when the labor output ratio is fixed. Under the Cobb-Douglas production function, the three concepts need not be distinguished. However, under the non-Cobb-Douglas production function, only Harold’s neutral technological progress can make the model have a steady growth rate. Therefore, the research assumes that the fixed growth rate index of technological progress is and meets Harold’s neutral technological progress; The fixed growth rate index of labor force is ; At this time, the growth rate index of labor force is . The energy factor mainly refers to the total consumption of fossil energy, namely the consumption of non-renewable energy; represents the per capita fossil energy ownership. The total consumption of households is ; Per capita consumption is . At this time, the instantaneous utility function is shown in formula (2).
| (2) |
In formula (2), represents the relative risk aversion coefficient, which represents the willingness of families to convert consumption in different periods. Then the utility function formed by family life is shown in formula (3).
| (3) |
In formula (3), represents the discount rate. When the discount rate increases, the value of forward consumption will be lower than that of current consumption. indicates the efficiency convergence guarantee. Generally, this value needs to be below 0. Although the family takes the maximization of labor utility as its main goal, the realization of the goal is still constrained by the budget. The household income from investment, energy and labor will be used for investment and consumption, which will form the formula (4).
| (4) |
In formula (4), represents financial assets owned by households; Indicates the effective interest rate; indicates the wage rate; represents the rate of return provided by energy, which can also be regarded as energy rent. On this basis, the constraint can be written in the form of formula (5).
| (5) |
For the dynamic optimization problem in the infinite time interval of the model, the research mainly selects Hamilton function for optimal control, as shown in formula (3.1).
| (6) |
In formula (3.1), represents any continuous differentiable function. Then the necessary conditions for the optimal solution are shown in formula (7).
| (7) |
When choosing the optimal solution, the first partial derivative of 0 is only a necessary condition, not a sufficient condition. Therefore, in addition to this, it is also necessary to meet the cross-sectional conditions. The cross-sectional condition can be expressed as:
| (8) |
In mathematical sense, the cross-sectional condition indicates that the discount value of the indefinite integral of the objective function needs to be convergent. In the economic sense, the cross-sectional condition means that consumption will stop only when the marginal utility of consumption is equal to 0. In the analysis of manufacturers, the production function can be constructed as shown in formula (9).
| (9) |
Similarly, on the premise of fixed return to scale under the full market competition environment, there can be formula (10):
| (10) |
It can be further transformed into:
| (11) |
Let , then there is an intensive production function as shown in formula (12).
| (12) |
Formula (12) can be recorded as , and then the manufacturer’s profit function can be obtained as follows:
| (13) |
In formula (13), represents the marginal return on capital; represents the marginal return on energy; represents the actual wage of effective labor. In a closed market environment, the balance of the capital market can be reflected as . After introducing the energy factor, the capital dynamics are shown in formula (14).
| (14) |
To maximize the utility of the experiment, it is necessary to consider the consumption level of the family. The function expression is shown in Equation (15).
| (15) |
At this time, . Meanwhile, when the production function is set, the Cobb-Douglas form is quoted, which can be set as:
| (16) |
In formula (16), represents the total number of labor taking technical factors into account; indicates the total energy consumption taking into account the energy factor. In order to describe the elasticity of variables more accurately, the research uses the natural logarithm form to describe, as shown in formula (17).
| (17) |
3.2 Analysis of Non-Renewable Energy Dependent Economic Development
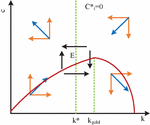
In the equilibrium state, in order to maximize household utility, we need to consider the steady state of capital and consumption . The corresponding economic saddle point diagram is shown in Figure 2.
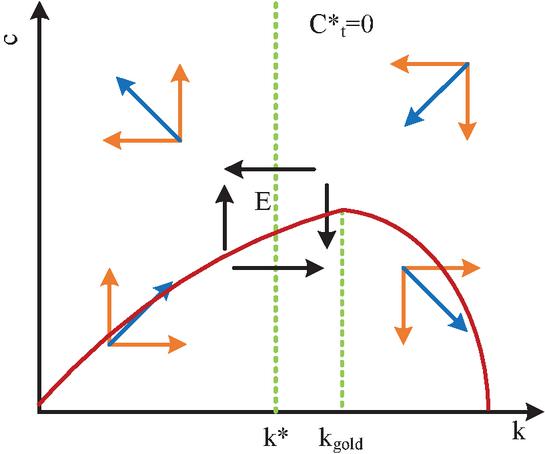
Figure 2 Economic saddle point diagram.
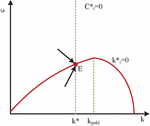
It can be seen from Figure 2 that the steady state of needs to be considered first in the experiment. The change path first increases and then decreases with the increase of value. In the process of actual dynamic track change, the final capital stock will not change to a range less than 0. In addition, there is no possibility that the present value of household income formed by the capital gold stock will always be greater than the present value of consumption. Therefore, it is necessary to exclude the tracks of capital stock less than 0 and capital gold stock at the same time. In fact, the coordinate points formed by the initial and corresponding will eventually converge to the saddle point during the change process. The change track of this path meets the constraints of household consumption budget and non-negative capital stock, and is the only feasible path in the dynamic adjustment process, as shown in Figure 3.
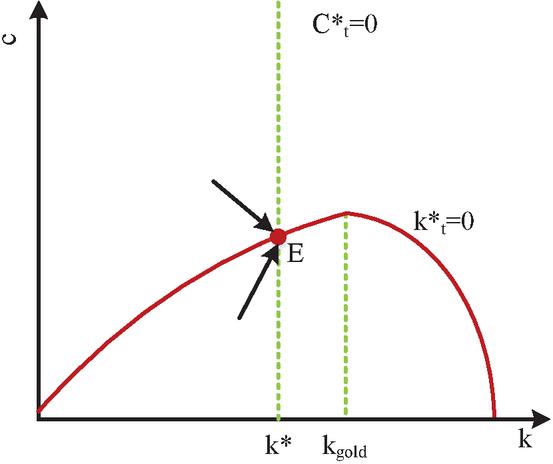
Figure 3 Dynamic adjustment of feasible path representation.
Under the condition that economic development depends on fossil energy, by controlling the growth rate of social population and the level of technological progress, the utility of consumption level can be maximized, thus helping economic growth. However, under the conditions of actual social development, it is unrealistic to control the scale of social population and the speed of technological progress. In Ramsey’s model, technological progress is also an important factor in promoting economic growth. When there is a certain relationship between the rate of population growth and the rate of technological progress, the only changing energy factor and economic growth factor can be analyzed.
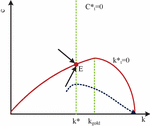
Fossil energy itself is non-renewable. Therefore, with the continuous reduction of fossil energy and the continuous increase of the total labor force, the per capita energy ownership is actually decreasing. The level of technological progress, labor growth rate and economic development can converge to the optimal (A). In this process, the marginal return shows a decreasing trend; The consumption level is in a declining state. When the consumption level is too low, the initial savings of households will reach a very high level. The family has a consumption base in the early stage, but it has no consumption behavior. Therefore, family utility is difficult to increase. In this case, the economy will reach the apex of the trajectory at the point where it passes the boundary, and then enter the downward process after that boundary. At this time, the value of continues to increase, while the value of shows a downward trend. The trajectory converges continuously, and finally converges with trajectory at the same point on the horizontal axis. The specific process is shown in Figure 4.
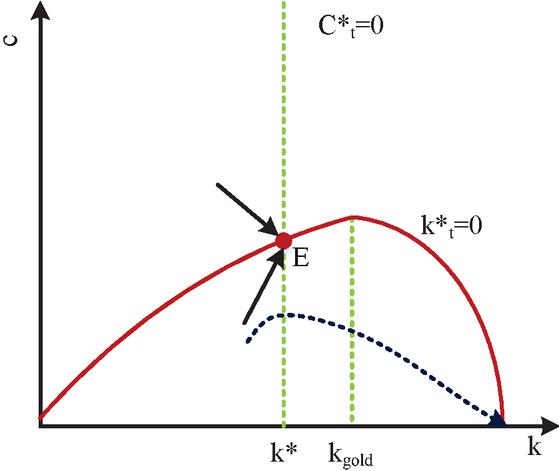
Figure 4 Trajectory change process of deviation from saddle point path.
Figure 4 shows the trajectory change process of deviation from the saddle point path. In the case of continuous consumption of fossil energy, the economic change route has seriously deviated from the saddle point route. In the phase diagram, the change path of the economy has always been lower than the saddle point path, and in the later period, it has seriously exceeded the boundary of the capital gold stock. The whole trajectory is divorced from the equilibrium state of Ramsey model. In addition, the external negative effects formed during the use of fossil energy should also be considered. The environmental pollution problems formed in the process of energy use not only form negative social effects, but also have a negative impact on economic development. This impact will reduce household utility and make the economy unable to reach the optimal state.
4 Empirical Analysis of the Dynamic Relationship Between Energy Transformation and Economic Growth
4.1 Analysis of the Impact of Word Vector and Local Text on Performance
In the empirical analysis of the dynamic relationship between energy transformation and economic growth, the research mainly selects five factors: output, labor, fossil energy, renewable energy and capital. Specific element definitions and data sources are shown in Table 1.
Table 1 Element definition and data source
| Element Name | Element Code | Definition | Data Sources |
| Produce | Y | Gross domestic product (GDP) | Information released by the Bureau of Statistics |
| Labor force | L | Total employed population | Information released by the Bureau of Statistics |
| Fossil energy | E | Total consumption of fossil energy such as coal | China Energy Statistics Yearbook |
| Renewable energy | R | Total consumption of renewable energy | China Energy Statistics Yearbook |
| Capital | K | Capital stock estimation results | Re-estimation of China’s total fixed capital stock |
The study sets the depreciation rate at 10% when calculating the capital stock. On this basis, the descriptive data statistical results of the five elements after preliminary data processing are shown in Table 2.
Table 2 Descriptive statistics
| Variable | Maximum | Minimum | Average Value | Standard Deviation |
| Produce | 827123 | 3678 | 117012 | 237348 |
| Capital | 324003 | 5792 | 121291 | 163223 |
| Labor force | 77642 | 40154 | 65225 | 12354 |
| Fossil energy | 387037 | 55764 | 171053 | 111576 |
| Renewable energy | 61963 | 1945 | 15718 | 16442 |
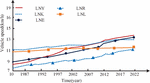
The data in Table 2 are processed with natural logarithm to form the logarithmic data curve of factor output (LYN), capital (LYK), labor force (LYL), fossil energy (LYE) and renewable energy (LYR), as shown in Figure 5.
Figure 5 Logarithmic data curve of elements.
It can be seen from Figure 5 that the curve variation trend of each element is similar, and the curve fluctuation is less, showing a smooth trend as a whole. Therefore, it can be preliminarily judged that there is a strong correlation between the factors used in the study and economic growth. The research involves the problem of time series, so the stationarity of the model is tested. The inspection results are shown in Table 3.
| Critical | Critical | Critical | Inspection | Inspection | ||
| Variable | ADF | Value (1%) | Value (5%) | Value (10%) | Form | Results |
| Produce (ln) | 0.897 | 4.245 | 3.545 | 3.206 | (C, T,4) | Unstable |
| Capital (ln) | 1.759 | 4.213 | 5.531 | 3.197 | (C, T,0) | Unstable |
| Labor force (ln) | 0.916 | 4.213 | 5.531 | 3.197 | (C, T,0) | Unstable |
| Fossil energy (ln) | 0.501 | 3.617 | 2.942 | 2.608 | (C, T,1) | Unstable |
| Renewable energy (ln) | 1.112 | 4.213 | 5.531 | 3.197 | (C, T,0) | Unstable |
| Produce (Dln) | 3.724 | 3.634 | 2.947 | 2.614 | (C, T,3) | Stable |
| Capital (Dln) | 4.823 | 3.617 | 2.942 | 2.608 | (C,0,0) | Stable |
| Labor force (Dln) | 5.047 | 3.617 | 2.942 | 2.608 | (C,0,0) | Stable |
| Fossil energy (Dln) | 3.134 | 3.617 | 2.942 | 2.608 | (C,0,0) | Stable |
| Renewable energy (Dln) | 6.746 | 3.617 | 2.942 | 2.608 | (C,0,0) | Stable |
It can be seen from Table 3 that the ADF test method is used in the study. The results show that the five original variables included in the model are in non-stationary state. However, after the difference operation, the above variables are converted into a stationary time series state, that is, the stationarity of the overall variable is acceptable. The results of lag test are shown in Table 4.
Table 4 Criteria results under different hysteresis
| Lag | LogL | LR | FPE | AIC | SC | HQ |
| 0 | 77.10643 | NA | 1.12E-08 | -4.120366 | -3.898175 | -4.043666 |
| 1 | 308.6913 | 383.769 | 8.49E-14 | -15.92522 | -14.59206* | -15.465 |
| 2 | 341.6262 | 45.16771* | 5.92E-14 | -16.37864 | -13.93452 | -15.53492 |
| 3 | 372.2138 | 33.20948 | 5.55E-14 | -16.69793 | -13.14285 | -15.47072 |
| 4 | 409.2664 | 29.64214 | 4.91E-14 | -17.38664 | -12.72061 | -15.77594 |
| 5 | 477.7684 | 35.22962 | 1.37e-14 | -19.87248* | -14.09548 | -17.87825* |
In Table 4, the smaller the values of SC and AIC, the higher the fitting degree of the corresponding model. The period position where the minimum of the two values is located is the hysteresis period. The hysteresis value corresponding to the minimum AIC data is 5; The hysteresis value corresponding to the minimum SC data is 1. The corresponding hysteresis period between the two is not consistent, so other values need to be considered comprehensively. The values of FPE, HQ and AIC all fall at 5 of the lag periods, which is the best lag period. Then carry out the cointegration test, as shown in Table 5.
| Original | Characteristic | Critical | Trace | Significance | |
| Assumption | Value | Value (5%) | Statistics | Value | |
| None* | 0.873962 | 69.81887 | 69.81887 | 0 | |
| At most 1* | 0.795719 | 47.85614 | 47.85614 | 0 | |
| Trace Test | At most 2* | 0.521391 | 58.41031 | 29.79706 | 0 |
| At most 3* | 0.433766 | 32.61974 | 15.49472 | 0 | |
| At most 4* | 0.304586 | 12.71364 | 3.841467 | 0 | |
| Original | Characteristic | Critical | Maximum Characteristic | Significance | |
| Assumption | Value | Value (5%) | Root Statistics | Value | |
| Maximum | None* | 0.873962 | 33.87688 | 72.49083 | 0 |
| characteristic | At most 1* | 0.795719 | 27.58435 | 55.58883 | 0 |
| root | At most 2* | 0.521394 | 21.12161 | 25.79058 | 0.0104 |
| test | At most 3* | 0.433764 | 14.26461 | 19.90611 | 0.0057 |
| At most 4* | 0.304586 | 3.841467 | 12.71364 | 0.0004 |
At 95% confidence level, the original hypothesis of cointegration relationship between rejected variables does not exist. At the same time, there are 1 to 4 original assumptions among the rejected variables. All variables are first-order single integration sequences, and the overall cointegration relationship is obvious. The final result shows that there is a long-term stable relationship between variables, and the regression is effective. Time-varying parameter analysis is shown in Table 6.
Table 6 Time-varying parameter analysis
| Coefficient | Residual | Significance | ||
| Coefficient | Estimation | Square Root | Z Statistic | Test |
| Capital output elasticity | 0.454672 | 0.115384 | 3.940517 | 0.0001 |
| Labor output elasticity | 0.708407 | 0.172691 | 4.102139 | 0 |
| Output elasticity of fossil energy | 0.740602 | 0.198609 | 3.728953 | 0.0002 |
| Renewable energy output elasticity | 0.304065 | 0.129316 | 2.351334 | 0.0187 |
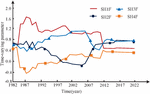
The significance test results of all coefficients are below 0.05, with significant significance. According to the estimated value of the comparison coefficient, the order of output elasticity coefficient is 0.740602 of the output elasticity of fossil energy; 0.708407 of labor output elasticity; 0.454672 of capital output elasticity; 0.304065 of the output elasticity of renewable energy. This coefficient means that the output will increase by 0.740602, 0.708407, 0.454672 and 0.304065 respectively for every 0.01 increase in fossil energy, labor, capital and renewable energy while other inputs remain unchanged. It can be seen that output is the most sensitive to fossil energy among all factors. After that, the sensitivity ranking is labor force, capital and renewable energy. The specific change diagram is shown in Figure 6.
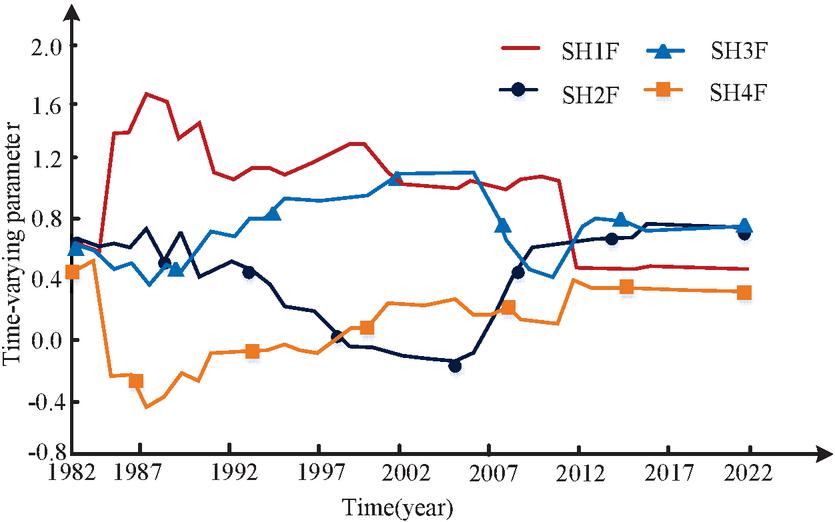
Figure 6 Output elasticity change chart.
In Figure 6, SH1F, SH2F, SH3F and SH4F respectively represent the elasticity of capital output, labor output, fossil energy output and renewable energy output. During the period from 1987 to 2022, the elasticity of capital output showed a downward trend. However, during the period from 1992 to 2010, the capital output elasticity showed a relatively stable output pulling force, and then the pulling force decreased. The output elasticity of labor force shows a trend of decreasing first and then rising. The bottom point is 2005. After that year, the contribution of labor factors gradually appears. This stage also includes the impact of technological progress. Thus, capital output elasticity and labor output elasticity present a complementary relationship. The output elasticity of fossil energy shows a trend of rising first and then declining, but the overall pulling effect is obvious.
The research adopts the Ramsey model: The Ramsey model is a classic macroeconomic model that can effectively analyze the relationship between economic growth and various factors (such as energy, labor, capital). The author introduces energy factors as an independent factor into the Ramsey model, which is an innovative method that helps to more accurately analyze the interaction between energy transformation and economic growth. The study analyzes from a micro perspective, and by analyzing the impact of energy and economic factors on net output, the author provides a deeper and more specific perspective to understand the interactive relationship between energy transformation and economic growth. In terms of results, the empirical analysis results are significant: the research results show that the estimated coefficients of fossil energy output elasticity, labor output elasticity, capital output elasticity, and renewable energy output elasticity are 0.740602, 0.708407, 0.454672, and 0.304065, respectively. All significance tests were below 0.05, which means that these results are statistically significant, thereby increasing the reliability of the research results. The research has achieved the best results from these aspects.
This shows that the output is heavily dependent on it, but has declined in recent years. Corresponding to fossil energy, the output elasticity of renewable energy shows a rising trend, making up for the dependence of output on fossil energy. It can be seen that the four factors play an alternative role with each other. The curve is generally in a positive range, indicating that all factors are driving positive economic growth.
In our research, we analyzed the interrelationship between energy transformation and economic growth using the Ramsey model. Our research results indicate that the estimated coefficients for fossil energy output elasticity, labor output elasticity, capital output elasticity, and renewable energy output elasticity are 0.740602, 0.708407, 0.454672, and 0.304065, respectively. All significance test results are below 0.05, indicating its significance. At the same time, we also found that the elasticity of capital output and labor output is complementary, and the output elasticity of fossil and renewable energy is also complementary. In a complementary relationship, the downward trend of one element is usually accompanied by the upward trend of another element.
Compared to our research, the above literature mainly focuses on the relationship between environmental impact and energy consumption, as well as the impact of tourism, industrialization, urbanization, and population growth on the environment. However, our study analyzed the impact of energy and economic factors on net output from a micro perspective and proposed a new approach to understand the interrelationship between energy transformation and economic growth [19–22].
In addition, our research results also reveal some new findings. For example, we found that the elasticity of capital output and labor output is complementary, which means that in the process of economic growth, the inputs of capital and labor can complement each other, thereby improving economic efficiency. This discovery is different from the research results of Voumik et al., who found that urbanization and industrialization have a positive impact on CO emissions [23–25].
Overall, our research analyzes the relationship between energy transformation and economic growth from a new perspective and proposes a new approach to understanding this relationship. Our research findings not only provide important insights for theoretical research, but also provide valuable references for policy makers and businesses.
5 Conclusion
In this study, the Ramsey model was used to analyze the interactive relationship between energy transformation and economic growth. Although our research findings provide valuable insights, there are still some limitations. Firstly, our sample selection is mainly based on manufacturers that maximize profits and households that maximize utility, which may not fully reflect all types of economic entities. Secondly, our model setting may overlook some important variables, such as market structure and policy environment, which may have a significant impact on economic growth and energy transformation. According to the research results, future research can be carried out in the following directions: firstly, further exploring how to improve the output elasticity of renewable energy through technological progress to reduce dependence on fossil fuels; The second is to study how to improve the economy’s dependence on labor and technology by optimizing labor structure and improving labor quality, in order to promote sustainable economic development. Our research findings have a significant impact on society. Firstly, the results reveal that during the energy transition period, the driving force of the economy may weaken, which has important implications for social economic development, environmental protection, social welfare, and other aspects. Secondly, the results also provide decision-making basis for policymakers, such as optimizing policies to expand the influence of the new energy industry, promote innovation in new energy technologies, and achieve sustainable economic development. Finally, our research findings can also be applied in practice. Enterprises can develop their business strategies based on research results, such as optimizing their energy structure, improving their energy efficiency, and thus enhancing their competitiveness. At the same time, policy makers can also formulate relevant energy policies based on our research results to promote sustainable economic development.
Based on the findings of this study, the following are some policy recommendations:
Enhancing the position of the new energy industry: Policy makers should recognize that the output elasticity of fossil fuels cannot continuously promote economic development. Therefore, energy policies should be adjusted to enhance the position of the new energy industry in the entire economy. This can be achieved through policy measures such as providing financial subsidies and tax incentives.
Technological innovation and human capital development: Policy makers should encourage technological innovation, especially in new energy technologies, to improve the output elasticity of new energy. At the same time, attention should also be paid to the development of human capital, improving the quality of labor through education and training, thereby improving the output elasticity of labor.
Optimizing energy structure: Policy makers should optimize energy structure, reduce dependence on fossil fuels, and increase the utilization of renewable energy. This can be achieved through establishing energy consumption standards, promoting new energy technologies, and other means.
Expanding the new energy market: Policy makers should optimize policies to expand the new energy market, such as relaxing market access for the new energy industry and providing priority investment for new energy projects, in order to attract more capital to invest in the new energy industry.
These policy recommendations aim to promote the transition of the economy from relying on fossil fuels to relying on sustainable energy, from relying on capital to relying on labor and technology, and achieve sustainable economic development.
Although this study provides valuable insights, there are still some limitations and future research directions. Firstly, our sample selection is mainly based on manufacturers pursuing maximum profit and households pursuing maximum utility, which may not fully reflect all types of economic entities. Future research can be conducted in the following directions: firstly, further exploring how to improve the output elasticity of renewable energy through technological progress to reduce dependence on fossil fuels; Secondly, research how to improve the economy’s dependence on labor and technology by optimizing labor structure and improving labor quality, in order to promote sustainable economic development.
References
[1] Can E. Energy transformation without using filter on high resistive load. Engineering Review: Međunarodni časopis namijenjen publiciranju originalnih istraživanja s aspekta analize konstrukcija, materijala i novih tehnologija u području strojarstva, brodogradnje, temeljnih tehničkih znanosti, elektrotehnike, računarstva i građevinarstva, 2020, 40(1): 39–47.
[2] Tsyganenko A A, Kompaniets T N, Novikov R G, Oleg S Pestsov. Resonance laser-induced processes and energy transformations in adsorbed layers. Current Opinion in Chemical Engineering, 2019, 24: 69–78.
[3] Tai Y, Ju F, Han X. Investigation of the kinetic energy transformation pattern of gangue particles in a buffer system. Powder Technology, 2019, 344: 926–936.
[4] Bougie J, Gangopadhyaya A. Conservation laws and energy transformations in a class of common physics problems. American Journal of Physics, 2019, 87(11): 868–874.
[5] Chen G, Liang Z, Dong Y. Analysis and reflection on the marketization construction of electric power with Chinese characteristics based on energy transformation. Proceedings of the CSEE, 2020, 40(2): 369–379.
[6] Karintseva O, Kharchenko M, Boon E K. Environmental determinants of energy-efficient transformation of national economies for sustainable development. International Journal of Global Energy Issues, 2021, 43(2–3): 262–274.
[7] Li Z G, Cheng H, Gu T Y. Research on dynamic relationship between natural gas consumption and economic growth in China. Structural Change and Economic Dynamics, 2019, 49: 334–339.
[8] Zheng J, Mi Z, Coffman D M, Yuli Shan, Dabo Guan, Shouyang Wang. The slowdown in China’s carbon emissions growth in the new phase of economic development. One Earth, 2019, 1(2): 240–253.
[9] Yao S, Zhang S, Zhang X. Renewable energy, carbon emission and economic growth: A revised environmental Kuznets Curve perspective. Journal of Cleaner Production, 2019, 235: 1338–1352.
[10] Li Y, Jiang Y, Dong C. Electricity cross-subsidies in China: Social equity, reverse Ramsey pricing, and welfare analysis. Economic Analysis and Policy, 2023, 77: 403–417.
[11] Nævdal E. New Insights from The Canonical Ramsey–Cass–Koopmans Growth Model. Macroeconomic Dynamics, 2021, 25(6): 1569–1577.
[12] Morooka C. Discretion Rather Than Rules: Ramsey Policy as the Unique Outcome. Theoretical Economics Letters, 2020, 10(6): 1199–1204.
[13] Nakamura T. On the long-run wealth distribution in a simple Ramsey model with heterogeneous households. Economic Modelling, 2020, 84:177–180.
[14] Gielen D, Boshell F, Saygin D, Morgan D. Bazilian, Nicholas Wagner, Nicholas Wagner. The role of renewable energy in the global energy transformation. Energy strategy reviews, 2019, 24: 38–50.
[15] Wang Y, Yu L, Zhu W, Xiaohan Zhou, Ying Chen, Wenchao Peng. Promotion of the performance of nitrogen-doped graphene by secondary heteroatoms doping in energy transformation and storage. Ionics, 2019, 25: 3499–3522.
[16] Wang E Z, Lee C C. The impact of clean energy consumption on economic growth in China: is environmental regulation a curse or a blessing? International Review of Economics & Finance, 2022, 77: 39–58.
[17] Fan W, Hao Y. An empirical research on the relationship amongst renewable energy consumption, economic growth and foreign direct investment in China. Renewable energy, 2020, 146: 598–609.
[18] Ahmad M, Zhao Z Y, Li H. Revealing stylized empirical interactions among construction sector, urbanization, energy consumption, economic growth and CO emissions in China. Science of the Total Environment, 2019, 657: 1085–1098.
[19] Voumik L C, Mimi M B, Raihan A. Nexus between urbanization, industrialization, natural resources rent, and anthropogenic carbon emissions in South Asia: CS-ARDL approach[J]. Anthropocene Science, 2023, 2(1): 48–61.
[20] Voumik L C, Rahman M H, Nafi S M, Hossain M A. Modelling sustainable non-renewable and renewable energy based on the EKC hypothesis for Africa’s ten most popular tourist destinations[J]. Sustainability, 2023, 15(5): 4029.
[21] Voumik L C, Ridwan M. Impact of FDI, industrialization, and education on the environment in Argentina: ARDL approach. Heliyon, e12872[J]. 2023.
[22] Voumik L C, Hossain M S, Islam M A, et al. Power generation sources and carbon dioxide emissions in brics countries: static and dynamic panel regression[J]. Strategic Planning for Energy and the Environment, 2022: 401–424.
[23] Polcyn J, Voumik L C, Ridwan M, Ray S, Vovk V. Evaluating the influences of health expenditure, energy consumption, and environmental pollution on life expectancy in Asia[J]. International Journal of Environmental Research and Public Health, 2023, 20(5): 4000.
[24] Voumik L C, Rahman M, Akter S. Investigating the EKC hypothesis with renewable energy, nuclear energy, and R&D for EU: Fresh panel evidence[J]. Heliyon, 2022, 8(12).
[25] Rahman M H, Voumik L C, Islam M J, Halim D,. Economic growth, energy mix, and tourism-induced EKC hypothesis: evidence from top ten tourist destinations[J]. Sustainability, 2022, 14(24): 16328.
Biography

Huan Liu obtained her PhD in Management from Central South University in 2015. She is currently serving as an Associate Professor at the Hunan Institute of Foreign Business, a judge for the Guangzhou Social Science Fund, and an expert in the talent pool of the Guangdong Provincial Department of Science and Technology. She has been invited to attend teaching seminars in aid of Africa multiple times, leading the high-level “Chuyi” teaching team for vocational education in Hunan Province and nearly 20 provincial-level projects. She has published articles in more than 30 domestic and foreign academic journals, published three monographs, edited and co-edited seven textbooks, etc., demonstrating a solid academic foundation. Her areas of interest include educational management, economic management, marketing, and new finance.
Strategic Planning for Energy and the Environment, Vol. 43_2, 335–356.
doi: 10.13052/spee1048-5236.4327
© 2024 River Publishers