Competitive Pricing Strategy of Wind-Solar-Fire Coupling System in Monthly Concentrated Market Considering the Uncertainty of Renewable Energy
Bian Guoliang1, Meng Yiqun1,*, Gu Yi2, Liu Chuang1, Hu Bo3, Zhou Guiping2, Luo Huanhuan4, Zhao Yuanzhu5, Chang Yiming5 and Wang Zhonghui3
1Northeast Electric power University, 169 Changchun Road, Jilin, China
2State Grid Liaoning Electric Power Co., Ltd, Shenyang, China
3State Grid Liaoning Electric Power Co., Ltd. Dalian Power Supply Company, Liaoning, China
4Liaoning Power Trading Center Co., Ltd, Shenyang, China
5State Grid Liaoning Electric Power Co., LTD. Shenyang Power Supply Company, Shenyang, China
E-mail: karlsson.meng@outlook.com
*Corresponding Author
Received 25 June 2023; Accepted 31 July 2023; Publication 09 January 2024
Abstract
Monthly centralized bidding is a key link in the transition from annual bilateral trading to spot trading, the research object of this paper is the multi-type power system (coupling system) which is integrated and coupled by thermal power and renewable energy under the same grid point, from the market point of view, this paper discusses its competitive strategy and revenue in the monthly centralized bidding market. First, an outer-level market clearing model that adapts to the participation of the coupling system is constructed to maximize the clearing in terms of social welfare. Secondly, considering the forecast error of scenery, the optimization model of the inner coupling system is established to analyze the cost of the coupling system, and the increment of the coupling system is evaluated quantitatively. Finally, a two-layer optimization model for coupling system to participate in the monthly centralized bidding market is formed, and then the optimal operation strategy of coupling system is studied. The simulation verification of the calculation example shows that participating in the monthly centralized bidding transaction in the mode of the coupling system will increase the income of each of the scenery and fire, the proposed coupling system model promotes changes in the energy structure of the power market, driven by improving the overall economic benefits, ensuring the economic benefits of traditional units and expanding the scope of the renewable energy market, so as to provide electricity to renewable energy and thermal power to improve auxiliary services. The development of the situation provides new ideas for the large-scale grid-connected consumption of new energy.
Keywords: Coupling system, electricity markets, bidding strategies, monthly centralized bidding, market cleared.
1 Introduction
With the advancement of the “dual-carbon” goals, “zero-carbon” new energy will enter the power system on a large scale and in a large proportion, bringing significant changes to the energy security of the grid, and posing severe challenges to the large-scale integration of new energy [1]. In the northern region’s power grid, there is a low proportion of flexible and adjustable power sources, and the flexibility requirements for high-level new energy integration mainly rely on thermal power units [2]. Although measures such as flexibility retrofitting of thermal power units [3] and coordinated scheduling of electric heating [4] effectively reduce wind and solar curtailment rates, the further growth of new energy urgently requires the grid to provide more flexible and rapid adjustment capabilities. In this context, this article proposes a model that integrates new energy and thermal power generation in a unified manner, driven by economic and environmental benefits, from the perspective of monthly markets. It investigates the design methods and bidding strategies for the rational and effective participation of new energy in medium and long-term markets, expands the scope of new energy participation in the market, and enhances the competitiveness of new energy in medium and long-term markets. While ensuring the economic benefits of traditional power generation units, this model provides a new approach for the further integration of large-scale new energy.
The monthly centralized bidding market in China has been in operation for a relatively short period of time. Monthly centralized bidding transactions play a crucial role in the power market as a bridge between annual bilateral transactions and spot transactions. The participating power generation companies in the monthly centralized bidding market are mainly traditional thermal power units. The traded electricity volume in the monthly centralized transactions is approximately several hundred million kilowatt-hours. However, due to the unstable output of new energy units and the inability of current forecasting methods for new energy units to meet the clearing mechanism and transaction timing of the monthly centralized bidding market, market fairness and competition principles may result in a significant amount of curtailed wind and solar power or financial loss. Therefore, wind and solar power units have almost no market share in the current monthly centralized bidding market.
Currently, there are three main aspects of research on the participation of power generation companies in the monthly centralized market: (1) Research on joint bidding strategies in multi-type power generation systems: References [5–7] focus on the participation of virtual power plants in short-term transactions, using a multi-scenario approach to deal with the uncertainty of day-ahead market prices and wind power output. They optimize short-term transactions with the objective of maximizing bidding profits in the day-ahead market and considering the rewards and penalties from the balancing market. References [8, 9] propose a multi-agent system electricity market bidding system consisting of higher-level power markets, microgrids, and power generation companies and components. They respectively put forward bidding strategies for maximizing the profits of microgrids and power generation companies and cost optimization strategies within microgrids. References [10, 11] consider the impact of uncertainties in new energy output and market prices. They establish joint optimization operation and bidding models for CSP power plants and wind farms, and simulation results validate the advantages of joint bidding strategies compared to separate bidding strategies. References [12, 13] aim to reduce the impact of wind power deviation penalties on wind power generators’ income. They use stochastic mixed-integer linear programming to explore the optimal bidding strategy for the joint operation of wind and thermal power units, utilizing the flexible adjustment capabilities of thermal power units to compensate for the power deviation caused by wind power uncertainty. (2) Research on bidding strategies for traditional power generation companies: References [14, 15] analyze market equilibrium in the day-ahead bidding market using different algorithms. Reference [16] introduces evolutionary game theory into power generation companies’ bidding strategies and proposes a method to enhance their profits by combining evolutionary game theory with a hybrid differential evolution algorithm. Reference [17] proposes different bidding schemes based on the available market information to achieve lower risks and better adaptability. (3) Research on bidding strategies for medium to long-term power generation companies mainly focuses on single-type power sources. Reference [18] proposes corresponding curve trading strategies from the perspectives of power generation companies, electricity users, and power retailers, providing decision support for the healthy operation of the power market. References [19–21] simulate the relevant rules of the domestic monthly centralized bidding market and analyze the entire market game process for power generation companies. Reference [22] introduces financial investment decision-making and market risk theory to study the decision-making and methods of power generation companies in medium to long-term bilateral and monthly centralized transactions. However, due to cost-effectiveness considerations, power generation companies currently do not invest too many resources in the development of power market bidding schemes, and there are more companies relying on experienced bidding. In summary, research on the participation of new energy in the spot market is currently thriving. Therefore, in the research on joint bidding strategies in multi-type power generation systems, the time scale mainly focuses on the day-ahead and intraday markets. However, in the medium to long-term market, research on bidding strategies for power generation companies mainly considers single-type power sources, lacking research on market bidding strategies for thermal power and new energy forming a single market entity at the same grid connection point in the context of the medium to long-term monthly centralized bidding market.
In the current electricity market, there are several important differences between the monthly market and the rolling trading in the medium to long-term market. The transactions in the monthly market primarily focus on short-term electricity demand and supply, whereas rolling trading in the medium to long-term market is more concerned with the balance of the electricity market over longer periods.
The monthly market is characterized by high liquidity and quick responsiveness, targeting short-term fluctuations in the electricity market. Traders in the monthly market can conduct transactions based on the electricity demand and supply for the current month, effectively dealing with unforeseen events and short-term supply-demand imbalances. However, due to its short-term nature, this market may not fully reflect the long-term trends of the electricity market.
On the other hand, rolling trading in the medium to long-term market emphasizes the stability and predictability of the electricity market. It allows traders to engage in long-term contract transactions, providing producers with more stable income and buyers with more stable electricity.
Based on the aforementioned research, this article focuses on the coupling and integration of new energy units and thermal power units at the same grid connection point as a unified market competition entity. New energy and thermal power are integrated into a coupled system at the same grid connection point, participating in the electricity market as a unified entity and having unified settlement of revenue and costs. It investigates their participation in the monthly centralized bidding market and establishes an outer supply function equilibrium model that adapts to the participation of the coupled system in the market, aiming to maximize social welfare and obtain the cleared electricity quantity and price for the coupled system. Furthermore, an inner optimization model for the coupled system is developed, with the goal of maximizing the system’s own profits and quantitatively evaluating its economic benefits. Finally, a two-level optimization model is formulated for the coupled system’s participation in the monthly centralized bidding market, and the strategies for the coupled system’s participation are discussed. Using actual operational data from a provincial power grid as a case study, this research verifies the superiority of the coupled system model in the form of monthly centralized bidding from the perspective of the power market. It provides new insights for gradually establishing a pattern where new energy provides the main electricity supply while thermal power provides auxiliary services.
2 The Participation of the Coupled System in the Monthly Centralized Market
2.1 Definition of Coupled System
From a broad perspective, at the provincial power grid level, different types of power generation units are integrated and coupled, and their integration optimization and coordinated control objectives can be achieved through aggregation. From a narrow perspective, this paper refers to the integration and coupling of new energy and thermal power units at the same grid connection point as a multi-source system, which is referred to as a coupled system. The coupled system can be a broad regional power grid or a narrow definition of a coupled system at the same grid connection point. Its essential characteristic is that the coupled system participates in the electricity market as a unified entity. Compared to a coupled system, the traditional bundling of wind, solar, and thermal power involves direct dispatch instructions issued by the dispatch center to various power generation stations for generation scheduling. However, the coupled system referred to in this paper has a different dispatch method than the traditional bundling of wind, solar, and thermal power. The dispatch instructions are issued by the dispatch center to the secondary dispatch center within the coupled system, and then distributed to individual power generation units within the coupled system by the secondary dispatch center. The secondary dispatch center of the coupled system can optimize and coordinate the internal operation of the coupled system, reduce wind and solar curtailment rates, improve the integration capacity of new energy, and enhance the overall generation performance of the coupled system. The coupled system has good control capabilities and cost advantages for new energy, making it easier to participate in market competition and achieve economic benefits for the coupled system. It also helps address the problem of new energy integration, making it a typical coupling method of significant research value. Figure 1 depicts the schematic diagram of a coupled system.

Figure 1 Schematic diagram of the wind-solar-fire coupling system.
2.2 The Significance of the Participation of the Coupled System in the Monthly Centralized Bidding Market
The coordinated collaboration of different types of units within the coupled system contributes to maximizing overall benefits. As the main participant in the power market, the coupled system can enhance the market share of new energy units and improve the proactive regulation capabilities of thermal power units.
From the perspective of power generation, considering the significant impact of natural factors on new energy generation companies and their limited controllability, it becomes challenging for them to establish a presence in the monthly centralized bidding market. To address this issue, integrating new energy units with thermal power units into a coupled system as a unified dispatch and trading entity allows them to participate together in the monthly centralized market. By forming a coupled system, which consists of both flexible thermal power units and environmentally friendly but less controllable new energy units, the system can ensure the overall quality of the electricity output through internal coordination. Additionally, it can strive to increase the integration level of new energy within the system to lower the overall generation cost. This enables the coupled system to gain an advantage in seller bidding competition. Therefore, by participating in the monthly centralized bidding market through the coupled system model, new energy units can generate higher profits. At the same time, thermal power units within the coupled system can also benefit from the overall economic improvements of the coupled system, leading to increased profitability for them as well.
3 Double-layer Optimization Model Applicable to the Participation of Coupled Systems in the Monthly Centralized Bidding
The bidding strategy of the coupled system in the monthly centralized bidding market is a double-layer coordinated optimization process (as shown in Figure 2): the outer layer is the market clearing model, where the coupled system, as a single power generation unit, participates in the centralized bidding along with other power generation companies. By providing a bidding function, the market clearing is achieved, and the final cleared price and quantity of the coupled system are obtained and transmitted to the inner layer. The inner layer deals with the problem of maximizing the economic benefits of the coupled system under its own constraints. It considers the income in the monthly centralized bidding market, market deviation penalties, and the costs of different types of units within the coupled system, ultimately obtaining the monthly centralized bidding revenue for the coupled system. This revenue is then used to generate the bidding function for the following month through power generation forecast, which is fed back into the outer layer model.

Figure 2 Wind-solar-fire coupling system participates in monthly centralized bidding double-layer optimization model diagram.
4 The Outer Layer is the Market Clearing Model in the Monthly Centralized Bidding Market
4.1 The Supply Function Model of the Coupled System
The cost analysis of different types of units in the coupled system takes into account the operating costs of thermal power units and the fixed costs of wind and solar photovoltaic units. Typically, the cost function of thermal power units is a variable cost function or an operating cost function, which can be represented by a quadratic function. Therefore, the monthly transaction cost function of thermal power units in the coupled system is as follows:
| (1) |
Where, is the cost function of the thermal power generation units within the coupled system; , , are the cost coefficient of the thermal power generation units within the coupled system; is the monthly electricity generation of the thermal power generation units within the coupled system.
In most studies related to wind and thermal joint bidding, the fixed costs of renewable energy sources are often overlooked. However, in reality, the upfront investment costs of renewable energy units cannot be ignored.
| (2) | ||
| (3) |
Where, , are the cost function for the wind and solar PV units within the coupled system; , are the cost per unit of electricity for the wind and solar PV units within the coupled system; , are the monthly traded electricity generation volume for the wind and solar PV units.
| (4) | ||
| (5) |
Where, , are the total investment cost for the solar PV and wind power units; , are the operational and maintenance cost for the solar PV and wind power units; , are the financial interest cost for the solar PV and wind power units; , are the government subsidy cost for the solar PV and wind power units; , are the total electricity generation over the entire lifecycle of the solar PV and wind power units.
| (6) | ||
| (7) |
Where, , are the installed capacity of the solar PV and wind power units; , are the annual average operating hours of the solar PV and wind power units; , are the utilization rate of the solar PV and wind power units; , are the discount rate of the solar PV and wind power units; , are the lifespan of the solar PV and wind power units.
Based on the cost characteristics analysis of wind, solar, and thermal power in Equations (4)–(7), we obtain the comprehensive cost function for the monthly centralized bidding of the coupled system.
| (8) |
Where, are the comprehensive cost function of the coupled system.
Based on the equilibrium model of the supply function and the bidding function of the thermal power generation companies in Equation (3), it is necessary to fit the various types of units in the coupled system into quadratic cost function forms that can participate in the market together with other conventional thermal power units.
| (9) | ||
| (10) |
Where, is the fitted quadratic cost function for the coupled system; is the monthly electricity generation of the coupled system, , , are the cost coefficient of the coupled system.
| (11) |
Where, is the comprehensive marginal cost function of the coupled system. Based on this, the linear bidding curve of the coupled system is formed.
| (12) |
Where, is the bidding function curve of the coupled system; is the bidding coefficient of the coupled system; , are the bidding parameters of the coupled system.
4.2 Supply Function Model of Other Thermal Power Companies
The linear supply function model is used in this paper to construct the bidding strategy of traditional power generation companies in monthly centralized transactions. The monthly transaction cost function and marginal cost of traditional power generation companies are given by:
| (13) | ||
| (14) |
Where, is the monthly transaction cost function of the thermal power company; is the monthly transaction marginal cost function of the thermal power unit; , , are the constant coefficient of the thermal power variable cost.
The thermal power company uses the marginal cost curve as a template in the bidding process. The bidding function is often higher than the marginal cost function. Therefore, the marginal cost curve is subjected to an affine transformation to generate its own bidding curve. The intercept and slope of the curve can be adjusted, or both the slope and intercept can be adjusted simultaneously [23]. In this study, the derivation of the formula is based on adjusting the intercept of the variable curve. Thus, the bidding curve of the thermal power company is given by:
| (15) |
Where is the bidding function curve of the thermal power company; is the bidding coefficient of the thermal power company; is the bidding quantity of the power generation company; , are the bidding parameter of the power generation company.
4.3 The Load Demand Function Model
Corresponding to the generation-side bidding function, the load inverse demand function reflects the relationship between the electricity price that consumers are willing to accept and the electricity demand [14].
| (16) |
Where is the electricity price that consumers are willing to accept; is the electricity demand of consumers; , is the constant coefficient of the linear demand function.
Integrating Equation (8), we obtain:
| (17) |
Where is the utility function of the user, where the utility function is the integral of the demand function.
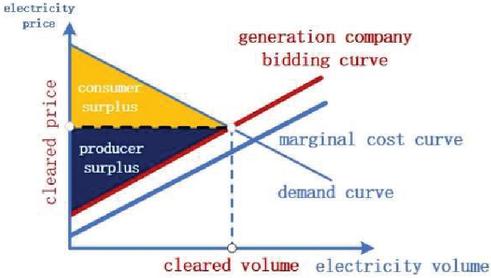
Figure 3 Supply function equilibrium model.
4.4 Monthly Centralized Bidding Market Clearing Model
In the monthly centralized bidding market, there is typically no tacit bidding behavior among power generation companies. The Supply Function Equilibrium (SFE) model is widely applied [24]. Nash equilibrium is achieved during the unified marginal clearing, where the price corresponding to the equilibrium point is the clearing price. At this equilibrium point, no market participant can increase their profit by changing their bidding strategy. Power generation companies formulate bidding strategies based on their own constraints and costs, and submit bidding functions. The bidding function of each market participant is a linear function. The objective is to maximize social welfare, considering constraints such as supply-demand balance, power generation output, and ramp rate. The monthly centralized bidding market clearing in the context of the supply function equilibrium model involves the objective function and constraints as follows:
| (18) | |
| (19) |
Where, the objective function is the difference between total consumer utility (consumer surplus) and production costs (producer surplus); is the constraint for electricity supply-demand balance; , are the lower and upper limits of power generation for the generating units; , are the lower and upper limits of bidding coefficients for the generating units.
4.5 Monthly Centralized Bidding Market Deviation Assessment
The deviation assessment in the monthly centralized bidding market in this paper refers to the “Electricity Medium- to Long-Term Basic Trading Rules 2020”. When there is a deviation between the actual monthly electricity demand and the monthly generation plan, penalties are imposed on the deviating trading units.
Deviation quantity of generation companies refers to the excess or shortfall of electricity generated by a generation company due to its own reasons. Deviation within 2% of the total electricity quantity is exempt from deviation assessment fees. However, if the deviation exceeds 2%, the generation company will be subject to deviation penalty fees for the excess or shortfall in electricity generation.
| (20) |
Where, is the settlement price for excess generation quantity, is the weighted average price for generation-side downward regulation service quantity, is the penalty coefficient for excess generation quantity by generation companies. If the system does not invoke the downward regulation service in a given month, the excess generation quantity will be settled by multiplying the lowest transaction price in the monthly centralized bidding market (or the uniform clearing price) by the penalty coefficient.
| (21) |
Where, is the settlement price for deficient generation quantity, is the weighted average price for generation-side upward regulation service quantity, is the penalty coefficient for deficient generation quantity by generation companies. If the system does not invoke the upward regulation service in a given month, the deficient generation quantity will be settled by multiplying the highest transaction price in the monthly centralized bidding market (or the uniform clearing price) by the penalty coefficient.
5 Inner Coupling-Centralized Bidding Optimization Model
5.1 Wind-Solar Forecast Deviation
Considering that the time scale of the participating bidding market is in months, there is no need for ultra-short-term power forecasting for the uncertainty constraints of the renewable energy portion in the coupled system. Only monthly electricity forecasting is required, which reduces the difficulty and accuracy of the forecasting while ensuring the participation of a certain amount of renewable energy in the centralized bidding market. Reasonably and effectively conducting monthly electricity forecasting can reduce the deviation assessment penalties for renewable energy units in the monthly centralized bidding market. The total error in wind farm and solar power plant generation forecasting is:
| (22) |
If the wind and solar power forecasting error , there will be a shortage of electricity in the coupled system, and it will be necessary for the thermal power units within the coupled system to supplement the electricity ;When the wind and solar power forecasting error , there will be an excess of electricity in the coupled system, and the thermal power units within the coupled system need to reduce their generation; if , the wind and solar power forecasting error exceeds the minimum generation capacity of the thermal power units within the coupled system, it will be necessary to curtail wind and solar power generation.
5.2 The Inner Optimization Objective Function of the Coupled System is as Follows
Based on the current operation mechanism of the long-term trading in the electricity market, considering the constraints of wind power, photovoltaic power, and thermal power units in the coupled system, the objective function for maximizing the economic benefits of the coupled system is as follows:
| (23) |
Where, is the net profit of the coupled system participating in the monthly centralized bidding market; is the unit income, the market clearing electricity price, of the coupled system’s i-th participation in the monthly centralized bidding market; is the electricity volume traded by the coupled system in the i-th monthly centralized bidding; are the unit cost of thermal power, wind power, and photovoltaic power generation in the coupled system’s i-th occurrence; are the power generation of thermal power, wind power, and photovoltaic power in the coupled system’s i-th occurrence; is the deviation penalty cost of the coupled system’s i-th participation in the monthly centralized bidding market; n is the number of monthly centralized bidding occurrences in a year.
5.3 Translation: Internal Constraints of the Coupled System
To ensure the stable operation of the coupled system and to constrain the strategic bidding accordingly, it is necessary to consider factors such as wind and solar forecasting errors, wind and solar power generation constraints, and uncertainties in wind and solar power generation.
(1) Wind and solar uncertainty constraints
Establishing a set of uncertainties for wind power and photovoltaic power generation:
| (24) | |
| (25) |
Where are the uncertainty sets for wind power and photovoltaic power generation in the coupled system; are the actual generation of wind power and photovoltaic power for t days; are the upper and lower limits of wind power and photovoltaic power generation; T represents the number of days in a month; are the robustness factor that controls the robustness of the uncertainty sets.
(2) Other constraint conditions
Constraints on thermal power generation capacity:
| (26) |
Where, is the actual power generation of thermal power units in the coupled system; , are the upper and lower limits of thermal power generation capacity constraints.
Constraints on wind power and photovoltaic power generation:
| (27) |
Where, , are the actual power generation of wind power and photovoltaic units in the coupled system; , are the upper and lower limits of wind power generation capacity constraints; , are the upper and lower limits of photovoltaic power generation capacity constraints.
Baseload power and bilateral contract constraints:
| (28) |
Where is the total power generation of the coupled system; is the baseload power of the coupled system; is the annual bilateral contract power quantity of the coupled system.
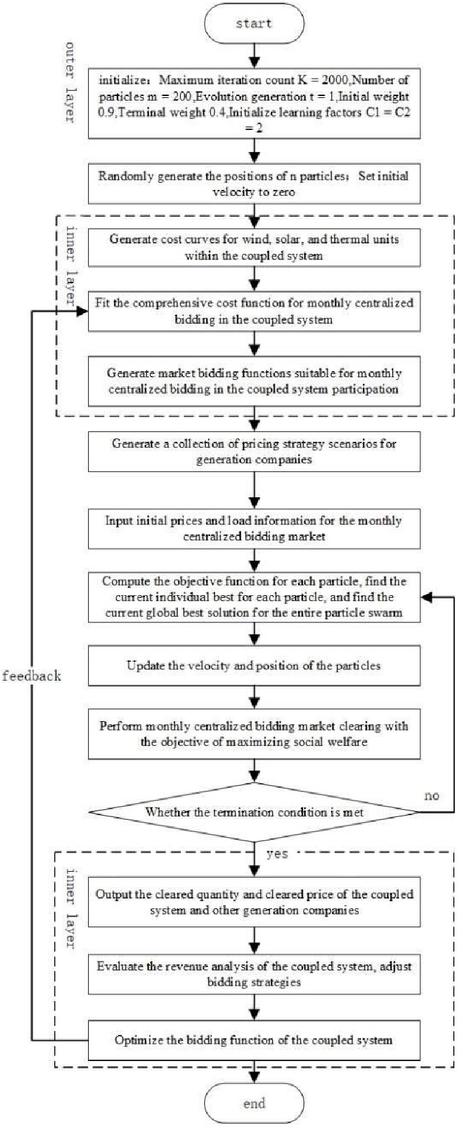
Figure 4 Flow chart of double layer model.
6 Solving the Bi-level Coupled System Optimization Model
According to Equations (18)–(19), the clearing model of the monthly centralized bidding market is a quadratic programming problem with a quadratic objective function and linear constraints. For quadratic programming problems with inequality constraints, methods such as interior point methods [25] and active set methods [26] can be employed. However, as the monthly centralized bidding market gradually matures and involves more participants, solving the system of equations using classical mathematical methods becomes increasingly complex. In this paper, a linearly decreasing weight particle swarm algorithm is used to search for equilibrium solutions, which avoids the complexity of solving the nonlinear system of equations in the supply function clearing model. By ensuring the accuracy of the results, the computational model is simplified using intelligent algorithms. The flowchart of the bi-level model is shown in Figure 4.
7 Case Study Analysis of the Coupled System
7.1 Case Study Parameters
In a certain region, there are 500 kV grid connection points with the potential for coupled offshore wind power, photovoltaic, and thermal power units. It is known that six power generation companies, including the coupled system, participate in the monthly centralized bidding market in a province. The trading takes place once a month, and it is assumed that there is no collusion or alliance behavior among the power generation companies in terms of bidding. Each power generation company participates in the centralized trading as a separate trading unit, and the final clearing result is settled based on a single trading unit. Initialization parameter settings for the linearly decreasing weight particle swarm algorithm: Maximum number of iterations , Number of particles , Number of generations , Initial weight , Final weight , Initial learning factor . T represents the number of days in a month, and in this paper, it is set to 30; is the robustness factor that controls the uncertainty set, and in this paper , A larger value corresponds to a larger uncertainty set. In the deviation assessment, .
The basic information and cost parameters of the thermal power units in the coupled system are shown in Table 1, and the relevant parameter information for new energy sources is shown in Table 2. The cost parameters for market transactions involving five other thermal power generation companies are shown in Table 3.
Table 1 Parameter information of thermal power unit in coupling system
| Coupled System | Parameter Name | Parameter Value | |
| Thermal power unit | Cost coefficient | 0.0217 Yuan/MWh | |
| 132.121 Yuan/MWh | |||
| Installed capacity | 1200 MW | ||
| Benchmark electricity price | 374.9 Yuan/MWh | ||
| Annual generation hours | 4065 h | ||
| Wind power unit | Installed capacity | 300 MW | |
| Annual generation hours | 2500 h | ||
| Photovoltaic unit | Installed capacity | 400 MW | |
| Annual generation hours | 1200 h | ||
Table 2 Parameter information of renewable energy unit in coupling system
| Parameter Information | Wind Power Unit | Photovoltaic Unit |
| Electricity consumption rate | 2.85% | 2.46% |
| Discount rate | 8% | 8% |
| Lifecycle | 25 years | 25 years |
| Total investment cost | 4955.35 Million Yuan | 2234.00 Million Yuan |
| Financial interest expense | 186.97 Million Yuan | 81.23 Million Yuan |
| Operating and maintenance costs | 642.21 Million Yuan | 289.53 Million Yuan |
| Government subsidy fees | 4751 Yuan /KWh | 3751 Yuan /KWh |
Table 3 Cost parameter information of other thermal power enterprises
| Trading Unit | (Yuan /MWh) | (Yuan /MWh) |
| G2 | 0.0195 | 127.789 |
| G3 | 0.0217 | 132.121 |
| G4 | 0.0222 | 148.907 |
| G5 | 0.0244 | 146.200 |
| G6 | 0.0303 | 136.453 |
For the monthly centralized bidding market, the demand forecast is derived from the aggregated demand from the user side by the power trading center. It can be considered as deterministic, while the uncertain factors of demand are left to be handled by the spot market and power dispatching agencies. Considering the actual operating conditions of a certain province, it is necessary to treat all users uniformly, treating the user side as a whole. The trading center provides the total demand for the following month, and the power generation companies use this information to submit their bidding offers. The power trading center organizes monthly centralized bidding after announcing the base load and bilateral contract load in the middle of the year. Therefore, this paper simulates six monthly trading scenarios to reflect the profit situation of the coupled system in monthly centralized trading throughout the year. The simulated market demand information is shown in Table 4.
Table 4 Market demand information of monthly centralized bidding
| Number of Transactions | (Yuan /MWh) | (Yuan /MWh) |
| 1st time | 0.0068 | 171.46 |
| 2st time | 0.0054 | 129.32 |
| 3st time | 0.0049 | 145.75 |
| 4st time | 0.0052 | 136.85 |
| 5st time | 0.0061 | 128.08 |
| 6st time | 0.0043 | 138.54 |
As shown in Figure 5, it displays the actual and predicted generation of wind and solar units in the coupled system for the first month in the monthly centralized bidding market. The data for the remaining months can be found in the appendix. The light green portion represents the actual generation exceeding the predicted generation, in which case the thermal power units reduce their generation by a certain amount based on the deviation. The light orange portion represents the actual generation being lower than the predicted generation, in which case the thermal power units increase their generation by a certain amount based on the deviation. When the thermal power units in the coupled system are unable to adjust the deviation in the generation of wind and solar units, they are subject to penalty costs for the deviation.
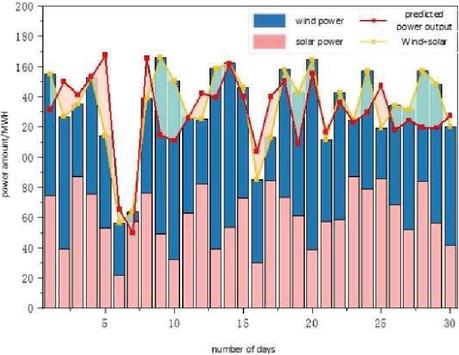
Figure 5 Actual and predicted power generation of wind power and photovoltaic.
7.2 Outer Market Clearing Results
Considering the known information from Tables 1, 2, and 3, the bidding parameters for the coupled system should be adjusted based on the varying renewable energy generation and deviation in each month. Table 5 presents the parameter information for the coupled system’s participation in monthly centralized bidding for each month. The bidding parameters for other thermal power generation companies are provided in Table 6.
Table 5 Bidding parameter information of coupling system
| G1 (Coupled System) | (Yuan /MWh) | (Yuan /MWh) |
| #1 | 0.0173 | 105.151 |
| #2 | 0.0165 | 108.824 |
| #3 | 0.0161 | 103.168 |
| #4 | 0.0169 | 103.774 |
| #5 | 0.0171 | 101.456 |
| #6 | 0.0166 | 104.738 |
Table 6 Bidding parameter information of other trading units
| Trading Unit | (Yuan /MWh) | (Yuan /MWh) |
| G2 | 0.0195 | 127.789 |
| G3 | 0.0217 | 132.121 |
| G4 | 0.0222 | 148.961 |
| G5 | 0.0244 | 146.199 |
| G6 | 0.0303 | 136.453 |
Comparing the iterative process of the six simulated monthly centralized bidding clearing quantities (as shown in Figure 6), based on the cost advantages of renewable energy in the coupled system, it allows the coupled system to have a greater bidding space and capacity in the bidding function. As a result, the coupled system occupies a larger market share in the limited demand, ultimately obtaining more cleared electricity in the market compared to the independent bidding of traditional thermal power units.
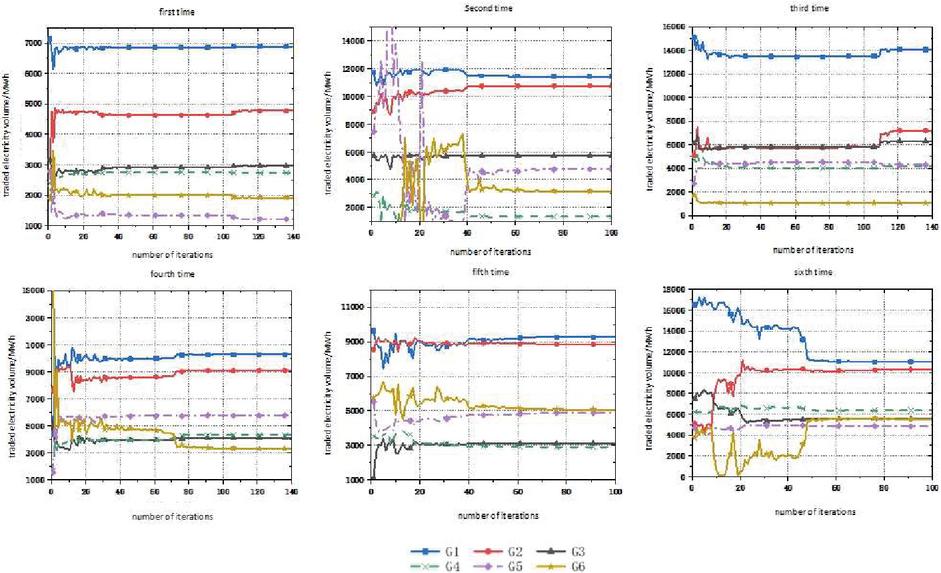
Figure 6 Transacted electricity in evolution.
Comparing the iterative process of the bidding coefficient in the six simulated monthly centralized bidding scenarios (as shown in Figure 7), the coupled system chooses to lower the bidding coefficient to obtain more cleared electricity to a certain extent. However, it still maintains within a reasonable bidding range, reaching the lowest point only in the third transaction.
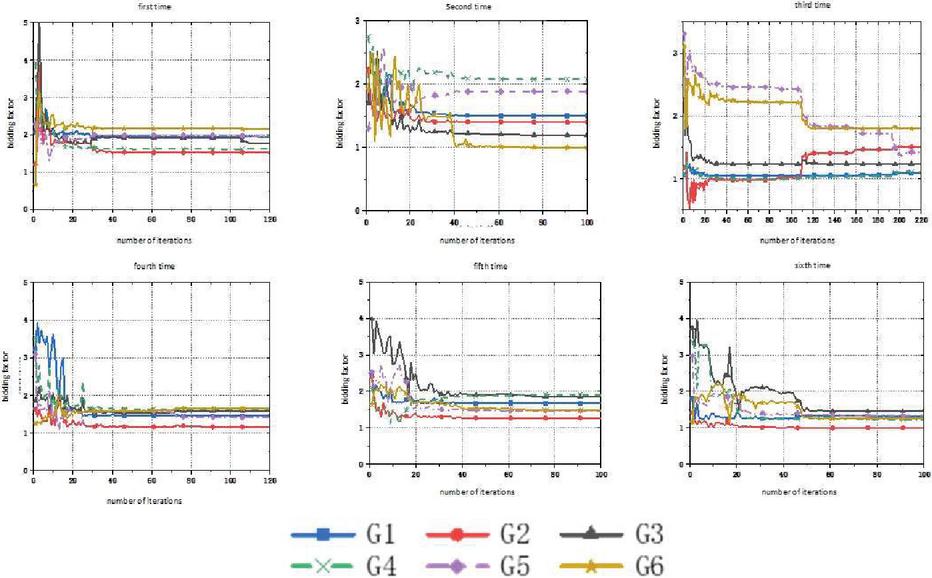
Figure 7 Bidding coefficient in evolution.
Translation: Comparing the clearing results of the six monthly centralized bidding markets (as shown in Table 7), the coupled system G1 maintains a relatively high clearing price even with a higher transaction volume. The power generation companies G2 and G3 aim to obtain more cleared electricity in the market, but they are constrained by the cost function. They can only slightly increase their bidding functions above the marginal cost function by reducing the bidding coefficient. Therefore, their bidding coefficients are the lowest in the first, fourth, fifth, and sixth transactions. On the other hand, the power generation companies G4, G5, and G6 adopt a high bidding strategy, which raises the clearing price. However, due to their higher bidding functions, they can only achieve a relatively smaller volume of transactions in the fiercely competitive centralized market. In contrast, the coupled system G1 stands out from the other five power generation companies. Based on the cost advantage of the bidding cost function, in the third transaction, the coupled system chooses to lower the bidding coefficient, reduce the clearing price, and ultimately achieves the highest cleared electricity volume among the six transactions. In the fifth and sixth transactions, the coupled system chooses to increase the bidding coefficient strategy and also obtains a relatively higher electricity volume. This demonstrates that the coupled system, based on its abundant bidding space, can adopt different bidding strategies for pricing.
Table 7 Clearing results of monthly centralized bidding market
| Number of Transactions | Trading Unit | Bidding Coefficient | Cleared Volume | Cleared Price | |
| #1 | G1 | 1.944 | 6885 | 323.52 | |
| G2 | 1.215 | 4778 | 288.46 | ||
| G3 | 1.762 | 2972 | 297.3 | ||
| G4 | 1.625 | 2732 | 302.72 | ||
| G5 | 1.955 | 1215 | 315.48 | ||
| G6 | 2.145 | 1915 | 350.73 | ||
| #2 | G1 | 1.496 | 11389 | 354.34 | |
| G2 | 1.035 | 10760 | 342.08 | ||
| G3 | 1.208 | 5718 | 283.68 | ||
| G4 | 2.145 | 1261 | 347.52 | ||
| G5 | 1.851 | 3162 | 347.77 | ||
| G6 | 1.011 | 4908 | 286.53 | ||
| #3 | G1 | 1.096 | 14254 | 361.84 | |
| G2 | 1.509 | 8369 | 356.03 | ||
| G3 | 1.233 | 6367 | 301.07 | ||
| G4 | 1.318 | 4291 | 291.59 | ||
| G5 | 1.383 | 4057 | 301.18 | ||
| G6 | 1.801 | 1064 | 277.99 | ||
| #4 | G1 | 1.454 | 10296 | 331.01 | |
| G2 | 1.163 | 9096 | 326.02 | ||
| G3 | 1.578 | 4148 | 298.50 | ||
| G4 | 1.626 | 4334 | 338.43 | ||
| G5 | 1.411 | 5778 | 347.27 | ||
| G6 | 1.659 | 3347 | 327.79 | ||
| #5 | G1 | 1.679 | 9714 | 344.6 | |
| G2 | 1.269 | 8795 | 333.67 | ||
| G3 | 1.864 | 3149 | 314.61 | ||
| G4 | 1.963 | 2814 | 354.88 | ||
| G5 | 1.469 | 5128 | 339.89 | ||
| G6 | 1.356 | 4498 | 321.32 | ||
| #6 | G1 | 1.326 | 10993 | 329.61 | |
| G2 | 1.002 | 10297 | 328.84 | ||
| G3 | 1.453 | 5562 | 312.67 | ||
| G4 | 1.226 | 6381 | 324.28 | ||
| G5 | 1.348 | 4865 | 315.78 | ||
| G6 | 1.257 | 5604 | 341.32 | ||
| Note: Unit for cleared volume: MWh, unit for cleared price: Yuan /MWh. | |||||
Comparing the cleared electricity and bidding coefficient of the coupled system in the six transactions (as shown in Figure 8), the changes in the bidding coefficient of the coupled system have a significant impact on the cleared electricity. For example, in the first and fifth transactions, when the coupled system increases the bidding coefficient, the cleared electricity is relatively low. However, in the second and third transactions, when the coupled system changes its bidding strategy and lowers the bidding coefficient, it leads to an increasing trend in the cleared electricity.
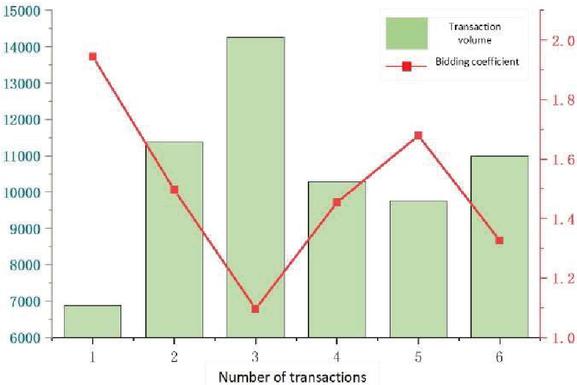
Figure 8 Clearing capacity and bidding coefficient of coupling system.
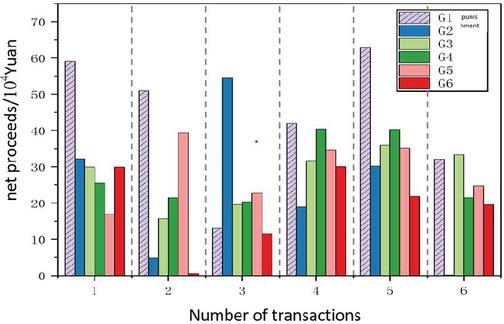
Figure 9 Net income of power generation enterprises.
7.3 Analysis of the Profits of the Inner Coupled System
As shown in Figure 9, the coupled system incurs varying degrees of penalty costs in different months. However, due to the self-regulating capability of the coupled system, the originally high penalty costs for deviations are significantly reduced. The actual penalty costs are only a small portion that the thermal power units in the coupled system are unable to mitigate. Therefore, considering the penalty costs, the coupled system still achieves the highest net profits in the first, second, fourth, and fifth transactions. In the second transaction, the coupled system chose to lower the bidding coefficient in an attempt to obtain more cleared electricity in the bidding market. Although it achieved the highest cleared electricity volume, it also resulted in lower profit margins, which explains the lower net profits in the third transaction. In the fifth transaction, the coupled system adjusted its strategy to maintain a balance between cleared electricity volume and bidding coefficient, ultimately achieving maximum profits 10.
Table 8 Income comparison between coupling system and independent bidding
| Number of | Total | Total | Bias | Net | |
| Transactions | Trading Unit | Revenue | Cost | Penalty | Income |
| 1 | Coupled system | 222.74 | 154.40 | 9.26 | 59.08 |
| Wind-solar-biomass hybrid system | 167.83 | 104.80 | 17.15 | 45.88 | |
| 2 | Coupled system | 403.58 | 344.15 | 15.43 | 44.00 |
| Wind-solar-biomass hybrid system | 298.46 | 237.64 | 21.14 | 39.68 | |
| 3 | Coupled system | 515.76 | 501.38 | 6.16 | 8.22 |
| Wind-solar-biomass hybrid system | 346.37 | 320.29 | 13.68 | 12.39 | |
| 4 | Coupled system | 340.81 | 291.65 | 10.23 | 38.93 |
| Wind-solar-biomass hybrid system | 288.74 | 255.54 | 17.84 | 15.36 | |
| 5 | Coupled system | 344.74 | 265.39 | 9.55 | 69.80 |
| Wind-solar-biomass hybrid system | 274.48 | 238.61 | 16.59 | 19.28 | |
| 6 | Coupled system | 362.34 | 324.66 | 4.62 | 33.06 |
| Wind-solar-biomass hybrid system | 261.72 | 231.07 | 13.67 | 16.98 | |
| Note: Unit for total revenue, total cost, bias penalty, net income: Million Yuan. | |||||
When wind and solar participate in market bidding independently, they face higher deviation penalty costs. Comparing the profits of the coupled system with the independent bidding of wind and solar, the results of the six monthly centralized transactions within a year for the coupled system and wind-solar independent bidding are shown in Table 8 and Figure 10. The analysis shows that the total revenue for the coupled system in the six transactions is 21,899.97 million RMB, while the total revenue for wind-solar independent bidding is 16,376.60 million RMB. This indicates that in the market bidding process, the coupled system leverages its overall cost and capacity advantages to gain a larger market share. In terms of total costs, the coupled system incurs 18,816.63 million RMB, while wind-solar independent bidding incurs 13,879.95 million RMB. This means that the coupled system absorbs the forecast errors of wind and solar, increasing the overall operating costs of the coupled system. Regarding deviation penalties, the coupled system incurs 552.5 million RMB, while wind-solar independent bidding incurs 100.07 million RMB. This shows that the thermal power units in the coupled system compensate for the electricity deviation caused by wind and solar forecast errors, reducing penalty costs. Finally, in terms of net profits, the total net profit for the coupled system’s monthly centralized transactions is 2,530.9 million RMB, which represents a 69.20% increase compared to the net profit from wind-solar independent operation.

Figure 10 Net income comparison and penalty costs between coupling system and independent bidding.
Therefore, when integrating and coupling renewable energy with thermal power generation as a single trading unit in monthly centralized bidding, it exhibits significant cost advantages and self-regulation capabilities. This enables it to have a larger bidding space, more flexible bidding strategies, and lower penalty costs, all while operating at lower marginal costs. As a result, it occupies a larger market share within the limited demand for electricity and ultimately achieves higher profits compared to independent bidding of wind and solar in the monthly centralized bidding market.
8 Conclusion
Through case analysis, the integration and coupling of renewable energy units with thermal power units as a unified entity within the same grid connection point, participating as a single trading unit in the monthly centralized bidding market, have been validated, and the following conclusions have been drawn:
(1) The economic benefits of the coupled system are significantly superior to independent bidding of wind and solar, as well as other power generation companies. By integrating as a coupled system, the renewable energy units gain the ability to actively participate in market bidding, allowing a larger portion of renewable energy generation to be involved in medium- to long-term market transactions. The thermal power units provide a certain amount of electricity support and ancillary services in monthly centralized bidding. Due to the higher net income of the coupled system compared to independent bidding of wind and solar, thermal power can still achieve higher profits under the coupled system model. Therefore, promoting the coupled system can effectively facilitate the market-oriented integration of new energy while driving the transformation of thermal power units.
(2) The environmental benefits of the coupled system are significantly superior to independent bidding of wind and solar. The coupled system mitigates the fluctuations of wind and solar power, reducing the curtailment of renewable energy and improving the economic efficiency of the coupled system. It promotes the integration and coupling of renewable energy with thermal power, focusing on improving the economic benefits of the coupled system. This model facilitates changes in the energy structure of the power market, provides new ideas for further renewable energy integration, enhances the participation of renewable energy in the power market, and effectively alleviates the pressure on the power grid during peak load periods.
(3) The operational model of integrating renewable energy and traditional energy as a unified entity in the monthly centralized bidding market has practical significance and research value. The models and methods studied in this paper, including but not limited to the selected monthly trading format and the integrated trading model, are also applicable to various types of power trading markets currently conducted in China (such as multi-day rolling and day-ahead markets). While ensuring the economic benefits of traditional power units, the coupled system provides new ideas for actively integrating large-scale renewable energy into the medium- to long-term power market, expands the market scope for renewable energy, and gradually establishes a pattern where “renewable energy provides the main power and thermal power provides ancillary services.”
This paper analyzes the revenue situation of the coupled system participating as a whole in the monthly centralized bidding market. In the future, the allocation of benefits among different types of units within the coupled system under different trading environments can be a focus of research.
Acknowledgements
This research is supported by the National Key R&D Program of China (2019YFB1505400).
References
[1] Shu Yinbiao, Zhang Zhigang, Guo Jianbo, Zhang Zhengling. Study on key factors and solution of renewable energy accommodation[J]. Proceedings of the CSEE, 2017, 37(01):1–9 (in Chinese).
[2] Zhang Yan, LÜ Quan, Zhang Na, Wang Haixia, Liu Rao, Sun Hui. Cooperative operation of power-heat regulation resources for wind power accommodation[J]. Power System Technology, 2020, 44(04): 1350–1362 (in Chinese).
[3] Li Xingmei, Zhong Zhiming, Yan Jie. Flexibility Reformation Planning of Thermal Power Units with Large-scale Integration of Wind Power[J]. Automation of Electric Power Systems, 2019, 43(03):51–58 (in Chinese).
[4] Lin Li, Gu Jia, Wang Qian. Optimal Dispatching of Combined Heat-power System Considering Characteristics of Thermal Network and Thermal Comfort Elasticity for Wind Power Accommodation[J]. Power System Technology, 2019, 43(10):3648–3661 (in Chinese).
[5] Ai Xin, Zhou Shupeng, Zhao Yuequn. Research on optimal operation and bidding strategy of power system with virtual power plants[J]. Proceedings of the CSEE, 2016, 36(23):6351–6362+6600 (in Chinese).
[6] Ma Chunyan, Dong Chunfa, Lv Zhipeng, Duan Qing, Wang Kunyu, Ai Xin, Li Yuling. Short-Term Trading and Optimal Operation Strategy for Commercial Virtual Power Plant Considering Uncertainties[J]. Power System Technology, 2016, 40(05):1543–1549 (in Chinese).
[7] Zhang, G, et al. Bidding strategy analysis of virtual power plant considering demand response and uncertainty of renewable energy[J]. Iet Generation Transmission & Distribution, 2017. 11(13):3268–3277.
[8] Ai Qian, Zhang Jian. Optimization bidding strategies of microgrids based on multi-agent system[J]. Power System Technology, 2010, 34(02):46–51 (in Chinese).
[9] Kong Xiangyu, Zeng Yi, Lu Ning, Yan Jiahong, Hu Qian. Optimal Bidding Management for Agent-based Microgrid Operation[J]. Proceedings of the CSEE, 2017, 37(06):1626–1634.
[10] Ma Tiannan, Peng Lilin, Du Ying, Gou Quanfeng, Wang Chao, Guo Xiaofan. Competition game model for local multi-microgrid market based on block chain technology and its solution algorithm[J]. Electric Power Automation Equipment, 2018, 38(05):191–203.
[11] Fang Yuchen, Zhao Shuqiang. Joint optimal operation and bidding strategies of concentrating solar power plants with wind farms[J]. Proceedings of the CSEE, 2020, 40(01):39–49+372 (in Chinese).
[12] Xiufeng L, Lulu Z, Jizhong Z, et al. Research on Wind & Thermal Power Joint Bidding Strategy Considering Penalties for Wind Power’s Bidding Deviation[C]// 2018 2nd IEEE Conference on Energy Internet and Energy System Integration (EI2). IEEE, 2018.
[13] Laia, R, et al. Bidding strategy of wind-thermal energy producers[J]. Renewable Energy, 2016. 99:673–681.
[14] Xie Chang, Wang Beibei, Zhao Shengnan, Tan Jian, Huang Junhui, Xie Zhenjian. Equilibrium solution for electricity market based on bi-level particle swarm optimization algorithm[J]. Power System Technology, 2018, 42(04):1170–1177 (in Chinese).
[15] Yang Yan, Chen Haoyong, Zhang Yao, et al. Computing equilibrium for electricity market using solving system of polynomial equations algorithm[J]. Proceedings of the CSEE, 2010, 30(25):108–116 (in Chinese).
[16] Peng Chunhua, Qian Kun, Yan Junli. A bidding strategy based on differential evolution game for generation side in power grid integrated with renewable energy resources[J]. Power System Technology, 2019, 43(06):2002–2010 (in Chinese).
[17] Zhang Xiaodong, Gao Bo, Song Zhiping. Research on bidding strategy of power generation enterprises[J]. Proceedings of the CSEE, 2004 (09):157–161 (in Chinese).
[18] Tian Jinyu, Wang Le. Research on coping analysis of load curve trading under basic rules of medium and long term electricity transactions[J]. Electric Power Science and Engineering, 2019, 35(02):7–13 (in Chinese).
[19] Chen Siyuan, Wang Bo, Wang Jiali, Lin Gang, Wang Yajun. Spread-back Mechanism Based Simulation and Parameter Impact Analysis of Monthly-centralized Electricity Market[J]. Automation of Electric Power Systems, 2018, 42(16):111–118+235 (in Chinese).
[20] Jing Zhaoxia, Zhu Jisong. Simulation experiment analysis of market rules for monthly electricity centralized bidding[J]. Automation of Electric Power Systems, 2017, 41(24):42–48 (in Chinese).
[21] Zhu Jisong, Research on the assessment of monthly centralized bidding electricity market mechanism under the background of new electric power reform[D]. South China University of Technology, 2018 (in Chinese).
[22] Wang Shengyu. Research on the theory and method of medium and long term trading decision of power products in power generation enterprises[D]. North China Electric Power University (Beijing), 2019 (in Chinese).
[23] Haghighat H, Seifi H, Kian A R. Gaming analysis in joint energy and spinning reserve markets[J]. IEEE Transactions on Power Systems, 2007, 22(4):2074–2085.
[24] Zhang Xiaodong, Gao Bo. Simulation analysis of regional electricity spot market based on supply function equilibrium model[J]. Power System Technology, 2005 (13):80–84 (in Chinese).
[25] Karmarkar N. A new polynomial-time algorithm for linear programming[C] // Proceedings of the Sixteenth Annual ACM Symposium on Theory of Computing, 1984:302–311.
[26] Yan Xiujuan, Wang Yongli, He Guoping. A Survey on the Active Set Methods for Box Constrained Optimization[J]. Mathematics in Practice and Theory, 2012, 42(03):100–107 (in Chinese).
Biographies

Bian Guoliang, male, from Linyi City, Shandong Province, is currently a master’s degree candidate in Electrical Engineering at Northeast Electric Power University. His research focuses on electricity markets and low-carbon optimization operation of power systems.

Meng Yiqun, male, from Changchun City, Jilin Province, holds a master’s degree in Electrical Engineering from the University of Sydney. He is currently a doctoral candidate at Northeast Electric Power University, undertaking a joint training program at the University of California, San Diego from January 2023 to December 2023. His research focuses on electricity markets and low-carbon optimization operation of power systems.

Gu Yi, male, from Anqing City, Anhui Province, obtained a master’s degree in Power System and Automation from Tsinghua University in 2000. He is a senior engineer and currently serves as the Chief Engineer at State Grid Liaoning Electric Power Co., Ltd. His main research interests include planning, preliminary work, and investment in primary distribution networks.

Liu Chuang, male, born in 1985, holds a Ph.D. degree and is a professor. He is a doctoral/master’s supervisor and has been selected as an outstanding young scientific and technological talent in China’s power industry, as well as various other honors and awards. He is currently affiliated with Northeast Electric Power University.

Hu Bo, Ph.D., senior engineer, obtained his bachelor’s, master’s, and Ph.D. degrees from North China Electric Power University, the Shenyang Institute of Automation, Chinese Academy of Sciences in 1995, 2001, and 2013 respectively. He currently holds the position of Secretary and Deputy General Manager at State Grid Liaoning Electric Power Co., Ltd., Dalian Power Supply Company. His main research direction is power systems and their automation.

Zhou Guiping, Ph.D., senior engineer, obtained his bachelor’s, master’s, and Ph.D. degrees from Dalian University of Technology and the Shenyang Institute of Automation, Chinese Academy of Sciences in 2004, 2007, and 2012 respectively. He currently holds the position of Deputy Section Chief at State Grid Liaoning Electric Power Co., Ltd. His main research direction is power systems and their automation.

Luo Huanhuan, male, graduated from Shanghai Jiao Tong University with a bachelor’s degree in Power System and its Automation in 2001. He obtained a master’s degree in Electrical Engineering from Dalian University of Technology in 2009 and a Ph.D. degree in Electrical Engineering from Shenyang University of Technology in 2022. He is currently employed at Liaoning Electric Power Trading Center Co., Ltd. His main research direction is power system operation and power market trading.

Zhao Yuanzhu, female, obtained a master’s degree in Journalism and Communication in 2019. She currently works at State Grid Liaoning Electric Power Co., Ltd., Shenyang Yuhong District Power Supply Branch. Her main research direction is power market marketing.

Chang Yiming, female, holds a master’s degree in Power System and its Automation. She currently works at State Grid Liaoning Electric Power Co., Ltd., Shenyang Power Supply Company. Her main research direction is power market marketing.

Wang Zhonghui, male, obtained a master’s degree in Power System and its Automation from Dalian University of Technology in 2011. He currently works at State Grid Liaoning Electric Power Co., Ltd., Power Dispatch and Control Center. His main research direction is the construction of the electricity spot market and ancillary services market, as well as grid regulation and operation.
Strategic Planning for Energy and the Environment, Vol. 43_2, 215–250.
doi: 10.13052/spee1048-5236.4322
© 2024 River Publishers