Advancing Sustainable Energy Development: A Study of the Factors Influencing Distributed Photovoltaic Industry in Heilongjiang Province
Pingping Fu and Honghao Yang
1Suzhou City University, Suzhou, 215000, China
2Heilongjiang University of Science and Technology, Harbin, 150000, China
E-mail: 2005801533@usth.edu.cn; yanghongh1@gmail.com
Received 07 July 2023; Accepted 30 August 2023
Abstract
In today’s energy industry, the development of clean energy has become a global concern. As an important clean energy technology, photovoltaic power generation (PV) is widely used in various countries and regions, helping to reduce the dependence on traditional fossil energy sources and to reduce greenhouse gas emissions. Existing studies have some shortcomings in terms of factors affecting distributed PV grid-connected capacity. First, previous studies tend to focus on the influence of a single factor on the grid-connected capacity of distributed PV, ignoring the interaction effects among multiple factors. Second, the sample scope in existing studies is relatively narrow, often limited to specific regions or countries, and lacks comprehensive regional comparative analysis. In addition, previous studies often do not fully consider the moderating effect of carbon emission intensity on the influencing factors. Based on the above deficiencies, this study aims to build a regression model by analyzing panel data of central municipalities and provinces including Heilongjiang, Shandong and Beijing over the past three years, and construct an interaction model based on the interaction term. The empirical results show that effective sunshine hours, average feed-in tariff and annual electricity consumption are the main factors affecting the grid-connected capacity of distributed PV with a positive effect. The regional heterogeneity analysis also finds that carbon emission intensity enhances the impact of each factor on distributed PV grid-connected capacity. The regulation effect analysis confirms that the average feed-in tariff and annual electricity consumption have a regulation effect. With the results of this study, we fill the knowledge gaps left by previous studies and provide a new perspective to explore the influencing factors of distributed PV. A deeper understanding of the impact of these factors on distributed PV capacity helps us to better understand and optimize the potential of PV generation. In addition, our findings provide policy makers with recommendations and guidance on how to promote distributed PV generation, thereby contributing to the sustainable development of the clean energy sector.
Keywords: Sustainable development, distributed photovoltaic industry, carbon peaking.
1 Introduction
At the general discussion of the 75th United Nations General Assembly, President Xi Jinping formally presented China’s “double carbon goal.” In November 2021 and 14 May 2022, respectively, the National Energy Administration and the State Council of the Central Committee of the Communist Party of China also released pertinent policies that outlined specific guidelines for reducing overall fossil energy consumption and fostering the growth of renewable energy. The policy documents lay forth specific guidelines for reducing overall fossil fuel consumption and fostering the growth of renewable energy sources. The widespread usage of energy distribution systems, such as solar, wind, and gas systems, at the customer’s location is known as distributed energy. Due to its extensive use of local solar energy resources, adaptability to local conditions, and other advantages, distributed photovoltaic power generation, a type of solar power generation, has emerged as a significant energy supply method in many nations and is seen by many as a vital support project. The growth of the photovoltaic industry is also highly valued in China. China’s photovoltaic sector has the size and capability of the first in the world in 2017 and accounted for more than 70% of the worldwide market. Problems with Heilongjiang Province’s industrial structure, low carbon productivity, and high carbon emission intensity are only a few. To speed up industrial transition and upgrading without depleting resources or compromising environmental quality, it is necessary to find successive alternative industries. According to statistics, Heilongjiang Province had a cumulative grid-connected capacity of distributed PV in the first three quarters of 2022 that was 993,000 kWh, far less than the national average of 2,966,000 kWh and placing Heilongjiang Province last in the nation. A crucial element influencing the growth of PV projects is the total amount of solar resources. Heilongjiang Province has a lot of solar resources, but the level of growth of its PV industry is far lower than anticipated.
The impact of each influencing factor on the grid-connected capacity of distributed PV is empirically analyzed in this paper based on panel data from more than 30 provinces and municipalities directly under the central government, including Heilongjiang, Shandong, and Beijing, for the past three years. This analysis is based on the background information provided above. Based on this, it examines in depth the impact of influencing factors on the grid-connected capacity of distributed PV under various scenarios and elaborates on the theoretical significance of each influencing component. In some ways, this study closes a gap in the understanding of the impact of regulation in the area.
2 Review of the Literature and Research Hypothesis
2.1 Literature Review
The current literature on photovoltaic power generation mainly focuses on the following aspects:
First, internal influencing factors including electricity price, subsidy benefits, electricity demand, technology factors, etc. Photovoltaic power generation is the primary way to utilize solar energy, and to improve its efficiency, it is necessary to fully evaluate solar energy resources. Scholars such as Gil have analyzed the development level of photovoltaics in eight economically developed countries in North America, ultimately finding that Chile has become the leader in photovoltaic power generation in the region due to its sophisticated solar energy resource assessment system and standardized photovoltaic grid system [1]. Fichera pointed out that it is necessary to develop resource advantages and invest heavily in subsidizing the concentration of distributed energy in targeted areas [2]. Scholars such as Xu X have analyzed the current status of renewable energy in seven regions including Asia-Pacific, Middle East, and Canada from different perspectives, finding that factors such as electricity demand and utilization technologies for renewable energy are important factors influencing its development [3]. The feed-in tariff policy is widely used to promote the development of renewable energy. China also adopts the feed-in tariff policy to attract greater investment in solar photovoltaic power generation [4]. Dong R, based on multidimensional big data, quantitatively analyzed the impact of construction costs, hours of sunlight, retail electricity prices, and subsidy benefits on photovoltaic power generation, finding that their impact is the most significant [5]. In addition, some scholars believe that the feed-in tariff will affect the amount of photovoltaic power generation [6].
Second, external influencing factors including policy effects, laws and regulations, and social humanities. Photovoltaic power generation depends on public policies to some extent, and policy formulation plays an important role in the diffusion of photovoltaics. Policy quality is related to policy implementation effects and determines whether photovoltaic projects can receive effective government support [7]. Luo Z constructed a model to evaluate the photovoltaic industry and its influencing factors, and the results showed that policy factors played the most critical role among all influencing factors [8]. Sackey studied the limiting factors hindering Ghana’s photovoltaic investment, finding that the Ghanaian government’s lack of corresponding incentive policies led to slow development of solar photovoltaics [9]. Irfan conducted a questionnaire survey in the four largest cities in Hubei Province, analyzing the results and finding that the intention of consumers to use solar energy is an important factor affecting the development of photovoltaic projects in the region [10]. Zanjirchi believes that promoting the development of the photovoltaic industry requires first improving public environmental awareness, thereby stimulating the public’s demand for photovoltaic products. Effective laws and regulations should be actively implemented to provide protection for the development of the photovoltaic industry [11].
In conclusion, Scholars have investigated the growth of the photovoltaic sector from various perspectives, using diverse measurement techniques to conduct empirical research on influencing factors. Despite accounting for internal and external factors affecting the grid-connected capacity of distributed PV, existing studies need to consider the inter-relationships among various factors in greater detail. The most popular method of completing empirical studies is to construct a regression model that omits the impact of another explanatory variable when examining the marginal effect of the variable on the response variable. This research methodology, however, can distort the empirical results. This paper constructs interaction terms for various variables, based on benchmark regressions, to investigate interaction effects between variables, provide theoretical and empirical support for impact factors and the development of the photovoltaic industry, as well as offer a valuable reference for the industry in Heilongjiang Province.
2.2 Research Hypothesis
The examination of influencing factors in this paper includes three variables – effective sunlight hours, average feed-in tariff, and yearly electricity consumption – that have been the subject of the most research in the literature. The local solar resource pool is richer and the conditions for constructing PV projects in the area are more favorable the longer the effective sunshine hours. The incentive for all stakeholders to engage in PV projects depends on the average feed-in tariff. The yearly power consumption reflects the primary energy demand of families, and the larger the need for electricity, the more urgent the need to find a dependable source of electricity is. The higher the tariff, the stronger the incentive and the better the development of PV projects.
The following three hypotheses are put forth by this publication based on the current status of the research mentioned above.
: Effective sunshine hours have a beneficial impact on distributed PV’s grid-connected capacity.
: The average feed-in tariff has a favorable effect on the capacity of distributed PV that is connected to the grid.
: The capacity of distributed PV that is connected to the grid is positively impacted by annual electricity consumption.
However, in reality several provinces have low distributed PV grid-connected capacity despite having high effective sunlight hours, likely as a result of the low average feed-in tariff in the area. The low feed-in tariff makes it difficult to convince relevant businesses to engage in PV projects, which causes the PV industry to develop slowly. The regional electricity demand is represented by annual electricity usage. This paper argues that the higher the annual electricity consumption, the more significant the effect of effective sunshine hours on the grid will be when the supply of electricity is difficult to meet the demand for electricity, resulting in some provinces having abundant solar energy resources but low demand for electricity due to population and other factors, thus affecting the development of the PV industry. This paper is predicated on the following two sub-hypotheses, which will be tested to see if there is a regulation impact and whether the analysis presented above is accurate.
: The average feed-in tariff reduces the amount of time that the sun is actually shining, and the main effect may be strengthened as a result.
: Effective sunshine hours are moderated by annual electricity consumption, and the main benefit may be strengthened by the moderating effect.
3 Models and Data
3.1 Variable Selection
In this study, panel data from statistical yearbooks, the CSMAR database, and statistics from the National Energy Administration are used. These data come from more than 30 provinces and municipalities directly under the Central Government, including Heilongjiang, Shandong, Hebei, Beijing, and Shanghai. The variables are established as per Table 1’s illustration.
Table 1 Explanation and description of variables
| Variable Type | Variable Name | Variable Codes |
| Explained variables | Distributed PV grid-connected capacity | PV |
| Explanatory variables | Effective sunshine hours | UH |
| Average feed-in tariff | EP | |
| Annual electricity consumption | EC | |
| Effective sunshine hours * average feed-in tariff | UH*EP | |
| Effective sunshine hours * Annual electricity consumption | UH*EC | |
| Control variables | Regional differences | RD |
| Government intervention | GOV | |
| Education level | EDU |
Explanatory variables: Grid-connected distributed PV capacity is used as the explanatory variable in this study to represent the state of distributed PV development.
Explanatory variables: Effective sunlight hours, the average feed-in tariff, and annual electricity consumption were chosen as explanatory variables in the baseline regression. The interaction terms between effective sunshine hours and average feed-in tariff as well as the interaction terms between effective sunshine hours and annual electricity consumption were added as new explanatory variables based on the baseline regression in order to verify the moderating effect of the variables.
Control variables: regional differences, governmental intervention, and educational level were added to the model’s creation based on earlier studies.
Regional differences (RD) are the variations in scientific and technological development as well as awareness of emission reduction in various geographic areas. The levels of PV development in the provinces vary as a result of these variances. The study discovered that areas with high economic growth have a more vital understanding of science, technology, and emission reduction, and that eastern Chinese provinces have a stronger awareness of these topics than western Chinese provinces [12]. Therefore, in the model’s construction, regional differences were given values of 1, 2, 3, and 4, with provinces in eastern China receiving a value of 4, provinces in central China receiving a value of 3, provinces in western China receiving a value of 2, and provinces in northeastern China receiving a value of 1.
Governmental promotion of particular industries by financial subsidies, either given directly to PV companies or indirectly, is referred to as government involvement (GOV). Governmental encouragement also has a significant impact on the advancement of distributed PV [13].
It is commonly accepted that the higher one’s education level, the more conscious one is of the need to reduce emissions and the more openly one accepts new energy sources like solar power. As a result, the level of education(EDU) is determined by this paper’s usage of the GDP share of investments in education [14].
3.2 Model Construction
The following model should be set up to test hypothesis H1.
| (1) |
The capacity of the distributed PV grid is Y. (PV). The controlling factor is control. The random error term is the model constant term, which denotes various areas, years, and variable coefficients. Change the explanatory variables in the model to the average feed-in tariff in order to test hypothesis H2. This model should be based on model (1).
| (2) |
By substituting annual electricity consumption for the explanatory variables, the model was built based on model (1) to confirm hypothesis H3.
| (3) |
The following model was created to test if the average feed-in tariff and annual electricity consumption have a positive moderating effect on the number of effective sunlight hours.
It is significant to notice that when the regression model with interaction terms was built, the main effects were not ignored. Effective sunshine hours, average feed-in tariff, and yearly power consumption are all continuous variables; therefore, if the main effects are eliminated when the regression is included, the interaction term consisting of continuous variables may affect the intercept.
3.3 Sample Selection and Variable Descriptive Statistics
In this study, panel data from statistical yearbooks, the CSMAR database, and statistics from the National Energy Administration are used. These data come from more than 30 provinces and municipalities directly under the Central Government, including Heilongjiang, Shandong, Hebei, Beijing, and Shanghai. The following statistical tables list the model’s primary variables.
Table 2 Descriptive statistics of the main variables of the model
| Variable Name | Average | Standard Deviation | Minimum Value | Maximum Value |
| PV | 296.6 | 427.7 | 2.200 | 1973 |
| UH | 2064 | 628.9 | 858.5 | 3545 |
| EP | 0.399 | 0.0890 | 0.172 | 0.556 |
| EC | 2414 | 1759 | 77.60 | 6940 |
| RD | 2.800 | 0.988 | 1 | 4 |
| GOV | 207.9 | 134.2 | 40.91 | 747.4 |
| EDU | 0.0440 | 0.0250 | 0.0220 | 0.157 |
As can be seen in Table 2, there are large differences in distributed PV grid-connected capacity across regions, regional differences in the degree of distributed PV development, and explanatory variables that indicate large differences in effective sunshine hours and annual electricity consumption across regions. As grid companies price PV generation on a per kWh basis, the values of tariffs are small in all provinces, which may lead to small values of the average feed-in tariff difference across regions.
4 Regression Results
4.1 Correlation Analysis and Multiple Co-efficient Test for Each Variable
By analyzing the correlation between the variables, correlation analysis was done to first confirm the validity of the hypothesis. The following table contains the findings of the correlation analysis of the variables.
Table 3 Table of results of correlation analysis of variables
| PV | UH | EP | EC | RD | GOV | EDU | UH*EP | UH*EC | |
| PV | 1 | ||||||||
| UH | 0.81*** | 1 | |||||||
| EP | 0.67*** | 0.92*** | 1 | ||||||
| EC | 0.77*** | 0.72*** | 0.62*** | 1 | |||||
| RD | 0.52*** | 0.46*** | 0.39*** | 0.43*** | 1 | ||||
| EDU | 0.31** | 0.55*** | 0.66*** | 0.44*** | 0.37*** | 1 | |||
| GOV | 0.51*** | 0.61*** | 0.56*** | 0.68*** | 0.53*** | 0.42*** | 1 | ||
| UH*EP | 0.33** | 0.12 | 0.41*** | 0.09 | 0.11 | 0.52*** | 0.05 | 1 | |
| UH*EC | 0.68*** | 0.27** | 0.08 | 0.55*** | 0.39*** | 0.13 | 0.29** | 0.71*** | 1 |
| Note: Standard errors in parentheses, *p 0.1, **p 0.05, ***p 0.01. | |||||||||
The theoretical hypotheses , and were initially confirmed, as shown in Table 3, and there is a positive link between effective sunlight hours, average feed-in tariff, yearly electricity consumption, and distributed PV grid-connected capacity. First, the theoretical theory is put to the test. The theoretical hypothesis suggests a moderating impact, the positive correlation with the interaction term at the 1% significance level suggests a moderating effect, and this indicates a moderating effect. Initial testing focuses on the theoretical assumptions and .
Table 4 Table of multicollinearity test results
| Variable | VIF | 1/VIF |
| UH | 9.93 | 0.100703 |
| EP | 9.48 | 0.105503 |
| EC | 2.73 | 0.366387 |
| GOV | 2.25 | 0.443691 |
| EDU | 2.00 | 0.499775 |
| RD | 1.55 | 0.645221 |
| Mean VIF | 4.66 |
Table 4 shows that there is no multicollinearity between the variables, demonstrating that the model is built up quite effectively. The VIF values of the variables are all lower than 10, as can be seen. In particular, it should be highlighted that since the interaction term is produced by multiplying two variables, it was not considered in the multicollinearity test. Multicollinearity will invariably result from testing for the interaction term [15]. Because of this, we do not test for multicollinearity in the interaction term in this study.
4.2 Analysis of Regression Results
From column (1) of Table 5, it can be seen that there is a positive correlation between effective sunshine hours and distributed PV grid-connected capacity at 1% significance level. The results in column (2) indicate that the average feed-in tariff is positively correlated with the distributed PV grid-connected capacity at 1% significance level. (3) Column result indicates that there is a positive correlation between annual electricity consumption and distributed PV grid-connected capacity at 1% level of significance. The theoretical hypotheses , and are verified.
Table 5 Table of baseline regression results
| (1) | (2) | (3) | |
| Variables | PV | PV | PV |
| UH | 0.272*** | ||
| (0.036) | |||
| EP | 2429.832*** | ||
| (309.239) | |||
| EC | 0.167*** | ||
| (0.030) | |||
| Control | Yes | Yes | Yes |
| Constant | 768.784*** | 1234.186*** | 487.699** |
| (187.487) | (223.711) | (190.613) | |
| Note: Standard errors in parentheses, *p 0.1, **p 0.05, ***p 0.01. | |||
Based on this research, an interaction term was added to the baseline regression to further investigate whether there is a moderating effect between the variables. The results show a positive correlation between effective sunshine hours, average feed-in tariff, and annual electricity consumption on the grid-connected capacity of distributed photovoltaic.
Table 6 Table of regression results after adding interaction terms
| (4) | (5) | |
| Variables | PV | PV |
| UH | 218.7** | 370.2*** |
| (92.76) | (59.52) | |
| EP | 585.1*** | |
| (156.1) | ||
| EC | 333.2*** | |
| (50.76) | ||
| UH*EP | 1,043*** | |
| (228.9) | ||
| UH*EC | 396.5*** | |
| (63.03) | ||
| Control | Yes | Yes |
| Constant | 209.5 | 85.49 |
| (164.5) | (143.9) | |
| Note: Standard errors in parentheses, *p 0.1, **p 0.05, ***p 0.01. | ||
Effective sunshine hours positively correlate with grid-connected capacity at the 5% significance level, as can be observed from the columns in Table 6(4). At the 1% level of significance, the average feed-in tariff positively correlates with grid-connected capacity. At the 1% level of significance, the interaction term exhibits a positive correlation with grid-connected capacity. The average feed-in tariff enhances the impact of effective sunshine hours on grid-connected capacity, according to regression results that also support a moderating effect. Effective sunshine hours and grid-connected capacity have a positive correlation at a 1% significance level, according to the results in column (5). At a 1% level of significance, there is a positive correlation between annual electricity consumption and grid-connected capacity, as well as a positive correlation between the interaction term and grid-connected capacity. The findings of the regression show that yearly electricity consumption both boosts the effect of effective sunshine hours on grid-connected capacity and moderates the effect of effective sunshine hours.
4.3 Analysis of Heterogeneity
Regional variations in China’s carbon emission intensity have been discovered by some researchers [16]. The data were split into two groups for regression analysis based on the empirical analysis to evaluate for potential regional heterogeneity. LC1 represents the first group, while LC2 represents the second group. Table 7 displays the results of the regression.
Table 7 Table of regression coefficients for subgroups
| (1) | (2) | (3) | (5) | (6) | (7) | |
| Variable | PV | PV | PV | PV | PV | PV |
| Name | LC1 | LC2 | ||||
| UH | 0.209*** | 0.330*** | ||||
| (0.0629) | (0.0528) | |||||
| EP | 1,741*** | 3,521*** | ||||
| (270.2) | (555.8) | |||||
| EC | 0.106*** | 0.168*** | ||||
| (0.0360) | (0.0394) | |||||
| Control | Yes | Yes | Yes | Yes | Yes | Yes |
| Constant | 434.9 | 771.7*** | 191.7 | 875.8*** | 1,579*** | 590.8** |
| (302.0) | (266.5) | (237.7) | (242.3) | (298.2) | (261.5) | |
| Note: Standard errors in parentheses, *p 0.1, **p 0.05, ***p 0.01. | ||||||
The regression results demonstrate that, at the 1% level of significance, the effective sunshine hours, average feed-in tariff, and annual electricity consumption are all positively correlated with the grid-connected capacity of distributed PV. These findings are consistent with the baseline regression findings. The effect of effective sunshine hours, average feed-in tariff, and annual electricity consumption on the grid-connected capacity of distributed PV is more pronounced in regions with high carbon emissions, likely because these regions urgently need to develop new energy projects like PV to achieve carbon emission reduction, according to a comparative analysis of the two sets of regression results. In these areas, distributed PV is developing more rapidly, which causes the influencing factors to have a greater impact.
4.4 Linear Interaction Hypothesis Validation
This paper argues that there is a moderating effect of the average feed-in tariff on effective sunshine hours by constructing an interaction term. This approach actually implicitly assumes a key assumption that the effect of the average feed-in tariff (EP) on effective sunshine hours (UH) is linear, which is also known as the linear interaction assumption. In order to guarantee the robustness of the results a reasonable relationship between the variables is proved by testing the diagnostic method, thus making the linear interaction hypothesis valid.
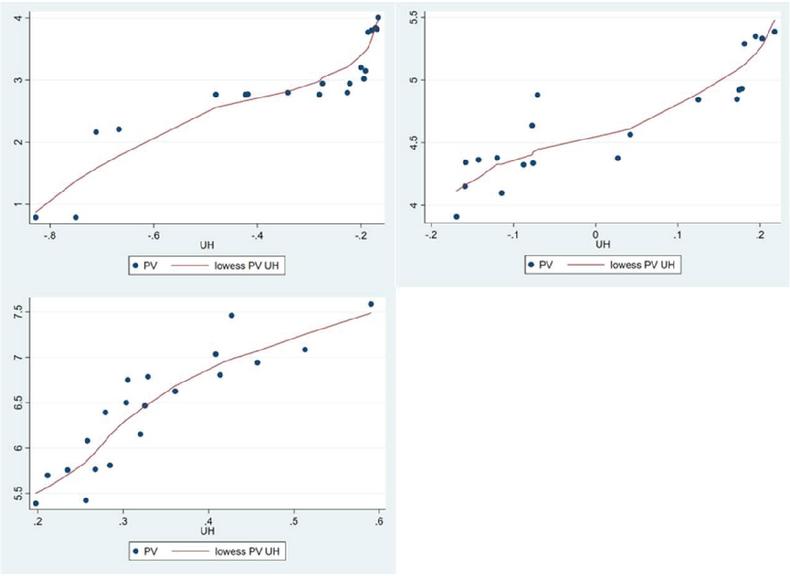
Figure 1 Grouped linear and lowess fit lines.
By using the moderating variables to divide the sample into three equal groups, we follow Jens Hainmueller’s methodology in this study [17]. We next plot linear and lowess fit lines for each group. As shown in Figure 1 the relationship between PV and UH is positive regardless of the value of EP in each group, which can be judged to be consistent with the linear interaction hypothesis. Taking the same approach to argue the premise assumption of the interaction term UH*EC, it can also be judged that the interaction term UH*EC is consistent with the linear interaction assumption.
5 Conclusion
5.1 Study Results
A model based on the perspective of regulation effects is built in this paper using panel data from 30 provinces and municipalities directly under the central government. Based on existing research, these strategies include the deployment of clean energy, stringent regulation of the scale of coal power development, and structural reform of the electricity supply side. The key conclusions are.
First, the benchmark regression model discovered a substantial and positive relationship between distributed PV grid-connected capacity and effective sunlight hours, average feed-in tariff, and yearly electricity consumption. In regions with high carbon emissions, the positive effects of each factor on distributed PV grid-connected capacity were more pronounced, according to the heterogeneity analysis, which found that the coefficients of effective sunshine hours, average feed-in tariff, and annual electricity consumption were higher in high carbon emission regions than in low carbon emission regions.
Second, using the baseline regression model as a foundation, the cross-product term is added to examine the moderating effect’s effects. According to the empirical findings, both the average feed-in tariff and annual electricity consumption strengthen the impact of effective sunshine hours on the grid-connected capacity of distributed PV. The cross multipliers between effective sunshine hours and average feed-in tariff and the cross multiplier between effective sunshine hours and annual electricity consumption are both significantly positive at the 1% significance level. The cross-product term is justified by the argument for the linear interaction hypothesis.
Thirdly, the average feed-in tariff in Heilongjiang Province during the past three years is 0.3734, which is lower than the average of 0.399 when compared to the average data from 30 provinces and municipalities directly under the central government. Heilongjiang Province’s yearly power usage is 103.3 billion kWh on average, which is significantly less than the national average of 2414 kWh. The empirical findings indicate that while effective sunshine hours have a positive impact on the grid-connected capacity of distributed PV, this effect is weakened by the fact that Heilongjiang Province’s feed-in tariff and annual electricity consumption are both below the average level and there is a regulation effect.
At present, some areas in Heilongjiang Province may have problems such as insufficient grid capacity, aging lines and high transmission losses. This can affect the access and grid-connection capacity of distributed PV projects, limiting the construction scale and power generation capacity of PV power plants. In addition, Heilongjiang is a large province, and the construction of distributed PV power plants often requires long-distance transmission of electricity, which can lead to increased transmission losses and increase the construction and operating costs of power plants. Insufficient policy support is also an important factor hindering the development of distributed PV in Heilongjiang province. Heilongjiang province has limited financial strength, and the government may have difficulty providing adequate financial support, including construction subsidies, power generation subsidies, and policy loans. This makes investors’ returns in the PV sector lower and weakens the attractiveness of PV projects. In addition to this, Heilongjiang Province lacks a specific renewable energy policy framework and targets, and policies on generation subsidies, feed-in tariffs and project approvals are not sufficiently clear. This creates uncertainty in project planning and operation and may discourage active investor participation.
5.2 Policy Repercussions
The following suggestions are given in order to create a clean and environmentally friendly transformation of power in Heilongjiang Province and to carry out the “emission peak” aim.
Making a distributed PV demonstration area comes first. According to the regression results, effective insolation hours play a crucial role in the growth of distributed PV, and regions with favorable insolation conditions can serve as demonstration sites for PV projects. Daqing, which is in Heilongjiang province’s southwest, has an annual peak sunshine hour of more than 1400 hours. In addition to abundant solar energy resources, Daqing is a vast city with abundant land resources. Distributed PV projects usually require a certain amount of land space to place PV panels. With its vast farmland and grassland, Daqing City can fully utilize these land resources to place distributed PV power generation systems. In addition, the grid infrastructure in rural areas of Heilongjiang Province is relatively weak and the power supply is not stable enough. Distributed PV projects can directly convert solar energy into electricity and deliver electricity to rural areas through microgrids or grid-connected methods, solving the problem of electricity supply in rural areas. These factors provide an opportunity for the promotion of distributed PV in Heilongjiang Province. The development of distributed PV can not only effectively utilize land resources, but also provide an additional source of income for rural areas and contribute to the improvement of rural power grid infrastructure. Currently, Daqing is in a critical period of transformation, facing the problem of how to deal with backward production capacity and extend the existing industrial chain, the development of photovoltaic projects can not only solve these problems, but also help the transformation and upgrading of Daqing, which will help to realize the regional goal of “carbon peak”.
Second, grid infrastructure should be upgraded to increase investment in grid upgrades and capacity expansion to ensure that power transmission and access capacity meets the needs of distributed PV projects. Specific measures include increasing the construction of transmission lines and substations to ensure that sufficient transmission lines and substations are available to supply the electricity generated by distributed PV projects. Increasing grid capacity according to demand to meet the growing installed capacity of distributed PV power generation and to ensure that power is reliably delivered to the user end; optimizing the grid structure, optimizing and renovating the grid to improve power delivery efficiency and reduce power losses. By upgrading equipment and improving transmission line configurations, the energy loss in the transmission process is reduced and the quality of power transmission is improved; the construction of smart grid is strengthened and smart grid technology is introduced to realize remote monitoring and management of distributed PV projects. Through technical means such as monitoring systems, automated control and smart distribution grids, the reliability and responsiveness of the power system will be improved to adapt to the diversified access needs of distributed PV.
The structure of power generating should also be rationalized. The installed capacity of distributed photovoltaics is significantly influenced by annual electricity usage. In recent years, Heilongjiang Province has had trouble providing power to fulfill demand in specific months, necessitating the necessity to take actions like “pulling the plug,” and the demand for electricity from inhabitants cannot be completely met. In recent years, thermal power generation has continued to be the dominant method of generating electricity from the perspective of Heilongjiang Province’s power generation structure. In order to reach the “carbon peak” between now and 2030, it is not advised to completely stop producing thermal power. In other words, thermal power generation will continue to dominate, and photovoltaic power generation will fill the gap as a necessary supplementary power generation method. The coal industry is still dealing with green transformation, extending the industrial chain, and eliminating backward production capacity.
Fourth, improve the way subsidy policies are created. The growth of PV projects is significantly influenced by the feed-in tariff. Regional differences significantly affect the development of PV projects, as evidenced by the fact that regions with high economic growth rates have favorable conditions for the development of PV projects. This difference will become even more pronounced following the Development and Reform Commission’s announcement in 2021 that the central government will no longer provide subsidies for PV projects. Depending on the situation, the Heilongjiang provincial government may provide partial financial subsidies for PV power plants, which would be the equivalent of a covert increase in the feed-in tariff price. It may be possible to combine the proposal to build a demonstration zone for PV projects, giving priority to subsidizing projects within the demonstration zone, or to set an installed capacity target for each region on a “first-come, first-served” basis, with no further subsidies after the target has been reached, taking into account Heilongjiang province’s financial situation, which may not be able to afford large-scale subsidies.
Fifth, the PV sector should be “lenient in and stringent out.” Only two PV businesses have registered in Heilongjiang Province in the past five years, a low figure that clearly indicates that the environment for building PV projects in Heilongjiang Province is unfavorable. In order for more businesses and people to understand PV projects, it is first necessary to create an effective information disclosure platform, integrate current policy information, and update it on a regular basis. In addition to this, industry standards and norms should be established, and norms and standards should be formulated to clarify the requirements for approval, operation and grid access of distributed PV projects, so as to improve the standardization and transparency of the industry. First of all, it is necessary to formulate clear approval processes and standards for distributed PV projects, and clarify the relevant procedures and requirements. Ensure that the projects meet the requirements for safety, environmental protection and quality, and strengthen the technical assessment and review of the projects to improve their credibility and sustainability. There is also the formulation of operational guidelines for distributed PV projects, including requirements for equipment maintenance, performance monitoring and safety management. Provide technical support and guidance to operators to ensure the normal operation and sustainable development of the projects. Clarify the requirements and procedures for grid connection of distributed PV projects, including technical standards and audit requirements for grid-connected equipment. Ensure that the project can be connected to the grid in accordance with uniform standards and procedures, and connected to the grid in a safe and stable manner. Finally, it is necessary to strengthen the supervision and assessment of distributed PV projects to ensure that the projects comply with the norms and standard requirements. Supervision and inspection, technical assessment and performance evaluation are used to ensure project compliance and operational effectiveness.
We must push for economic expansion and the growth of distributed photovoltaics. The “carbon peak” aim cannot be attained quickly and is a long-term process. The province of Heilongjiang is currently very reliant on fossil fuels like coal. Due to its long-term overreliance on coal resources, the secondary industry now accounts for a sizable share of GDP, while the primary and tertiary industries are severely underperforming. The goal is to reduce reliance on fossil fuels like coal.
Acknowledgments
This work was financially supported by Philosophy and Social Science Foundation of Heilongjiang Province (16GLE03).
References
[1] Gil G M V, Cunha R B A, Di Santo S G, et al. Photovoltaic energy in South America: Current state and grid regulation for large-scale and distributed photovoltaic systems[J]. Renewable Energy, 2020, 162: 1307–1320. https://doi.org/10.1016/j.renene.2020.08.022.
[2] Fichera A, Marrasso E, Sasso M, et al. Energy, environmental and economic performance of an urban community hybrid distributed energy system[J]. Energies, 2020, 13(10): 2545. https://doi.org/10.3390/en13102545.
[3] Xu X, Wei Z, Ji Q, et al. Global renewable energy development: Influencing factors, trend predictions and countermeasures[J]. Resources Policy, 2019, 63: 101470. https://doi.org/10.1016/j.resourpol.2019.101470.
[4] Zhang A H, Sirin S M, Fan C, et al. An analysis of the factors driving utility-scale solar PV investments in China: How effective was the feed-in tariff policy?[J]. Energy Policy, 2022, 167: 113044. https://doi.org/10.1016/j.enpol.2022.113044.
[5] Dong R, Xu J, Lin B. ROI-based study on impact factors of distributed PV projects by LSSVM-PSO[J]. Energy, 2017, 124: 336–349. https://doi.org/10.1016/j.energy.2017.02.056.
[6] Agbo E P, Edet C O, Magu T O, et al. Solar energy: A panacea for the electricity generation crisis in Nigeria[J]. Heliyon, 2021, 7(5). https://doi.org/10.1016/j.heliyon.2021.e07016.
[7] Garcez C G. Distributed electricity generation in Brazil: An analysis of policy context, design and impact[J]. Utilities Policy, 2017, 49: 104–115. https://doi.org/10.1016/j.jup.2017.06.005.
[8] Xue Y, Lindkvist C M, Temeljotov-Salaj A. Barriers and potential solutions to the diffusion of solar photovoltaics from the public-private-people partnership perspective–Case study of Norway[J]. Renewable and Sustainable Energy Reviews, 2021, 137: 110636. https://doi.org/10.1016/j.rser.2020.110636.
[9] Sackey D M, Owusu-Manu D G, Asiedu R O, et al. Analysis of latent impeding factors to solar photovoltaic investments in Ghana[J]. International Journal of Energy Sector Management, 2020, 14(4): 669–682. https://doi.org/10.1108/IJESM-08-2019-0005.
[10] Irfan M, Elavarasan R M, Hao Y, et al. An assessment of consumers’ willingness to utilize solar energy in China: End-users’ perspective[J]. Journal of Cleaner Production, 2021, 292: 126008. https://doi.org/10.1016/j.jclepro.2021.126008.
[11] Zanjirchi S M, Shojaei S, Sadrabadi A N, et al. Promotion of solar energies usage in Iran: A scenario-based road map[J]. Renewable Energy, 2020, 150: 278–292. https://doi.org/10.1016/j.renene.2019.11.104.
[12] Liu J, Li S, Ji Q. Regional differences and driving factors analysis of carbon emission intensity from transport sector in China[J]. Energy, 2021, 224: 120178. https://doi.org/10.1016/j.energy.2021.120178.
[13] Çoban V, Onar S Ç. Modeling renewable energy usage with hesitant Fuzzy cognitive map[J]. Complex & Intelligent Systems, 2017, 3: 155–166. https://doi.org/10.1007/s40747-017-0043-y.
[14] Raina G, Sinha S. Outlook on the Indian scenario of solar energy strategies: Policies and challenges[J]. Energy Strategy Reviews, 2019, 24: 331–341. https://doi.org/10.1016/j.esr.2019.04.005.
[15] Balli H O, Sørensen B E. Interaction effects in econometrics[J]. Empirical Economics, 2013, 45: 583–603. https://doi.org/10.1007/s00181-012-0604-2.
[16] Wang Y, Zheng Y. Spatial effects of carbon emission intensity and regional development in China[J]. Environmental Science and Pollution Research, 2021, 28: 14131–14143. https://doi.org/10.1007/s11356-020-11557-7.
[17] Hainmueller J, Mummolo J, Xu Y. How much should we trust estimates from multiplicative interaction models? Simple tools to improve empirical practice[J]. Political Analysis, 2019, 27(2): 163–192. https://doi.org/10.1017/pan.2018.46.
Biographies

Pingping Fu is a Professor at Suzhou City University, China. She received her PhD from Harbin Institute of Technology in 2014. She worked a visiting scholar at University of North Carolina at Chapel Hill, United States of America. Her research interests are Urban and regional planning, Public Policy, and Renewable energy.

Honghao Yang is a Master candidate at Heilongjiang University of Science and Technology, China. His research interests are Public Policy, and Renewable energy.
Strategic Planning for Energy and the Environment, Vol. 43_3, 569–588.
doi: 10.13052/spee1048-5236.4334
© 2024 River Publishers
