Installation Technique and Numerical Simulation of Stress on High-Pile Footings During the Translation of Offshore Booster Stations
Maoqiang Zhou
State Nuclear Electric Power Planning Design & Research Institute Co., Ltd, Beijing, China
E-mail: Maoqiang_Zhou2023@outlook.com
Received 11 July 2023; Accepted 28 July 2023; Publication 09 January 2024
Abstract
The foundation of the offshore substation mainly adopts the structure of a conductor support frame, and the installation of the upper blocks of the offshore substation mainly employs a lifting vessel for hoisting. The “Zhegen Sha 300 MW Offshore Wind Power Project” adopts a high-pile cap foundation for the offshore substation, making use of a translational installation method for the upper blocks. The innovative foundation design and installation scheme together form the basis of this project, which is explored in detail in this paper. Numerical simulations examining the bearing performance of the high-pile cap foundation during the translational process of the upper blocks are also performed, allowing finer insights into the design and construction of offshore wind power projects.
Keywords: Offshore wind power, high-pile cap foundation, differential settlement, numerical analysis.
1 Introduction
The ever-expanding disparity between global energy supply and demand has stimulated the development of new energy sources. The development of offshore wind energy is crucial for enhancing the sustainability and security of utilizing these new energy sources. As a pivotal hub and vital voltage transformation equipment for the power transmission and distribution in offshore wind farms, the offshore substation occupies a central position in the offshore wind energy development process. Usually employed as a jacket structure, the installation of the upper blocks of the offshore substation is primarily completed via crane vessel lifting. However, an alternative approach for transporting the upper blocks using hydraulic module transporters onto transport ships has gradually replaced the crane vessel lifting scheme, as it is not restricted by the availability of crane vessels and port conditions. With the inspiration by the translational scheme for the upper blocks on the offshore substation, the foundation of the offshore substation has been designed as a high-pile cap structure, allowing for a translational method to be adopted in the installment of the upper blocks. Consequently, the “Zhegen Sha 300 MW Offshore Wind Farm Project” grasped the opportunity to employ this novel foundation design and the translational installment scheme, both of which are pioneering initiatives around the world.
A feasible construction method for the high-pile cap-style offshore substation, reducing crane vessel requirements and installation costs, is the translational installation technique. Despite its promised benefits, this method for the upper blocks on offshore substations is still in its early stages, with a paucity of field-measured data to inform its use. In order to more quickly and efficiently obtain the engineering data necessary for the design of new structures, numerical simulation using software is presented as an appropriate solution. This paper examines the construction details of the Zhegen Sha 300 MW Offshore Wind Farm Project, and numerical simulations are carried out to investigate the bearing performance of the high-pile cap foundation during the translational process of the upper blocks. These findings constitute a useful source for both the design and construction of offshore wind power projects.
2 Project Overview
The “Zhegen Sha 300 MW Offshore Wind Power Project” is located in the sea area of Jiangsu Province, stretching east to west for 21 km and north to south for 6 km. Its elevation ranges from 13 to 2.8 meters, with a gradual change in the seabed topography. It has an irregular polygonal shape, covering a total area of 37 km and possessing a planned capacity of 300 MW.
2.1 Overview of Offshore Substation
The wind power plant is equipped with a 220 kV offshore substation, which is centrally located within the entire wind farm area. It is designed to Grade 1 specification and consists of two parts; the lower foundation structure and the upper blocks. The lower foundation structure consists of steel piles and foundation cap structures. After the construction and installation debugging of the upper blocks are completed, their total weight is 3,000 t, which are then transported as a whole to the offshore site for installation.
2.2 Overview of High-Pile Cap Foundation
Based on the hydrological data of the project area and the topographic and geological conditions from typical boreholes, the high-pile cap foundation for this wind farm is planned to comprise 20 steel pipe piles, with diameters ranging from 1.5 to 2.0 meters, made of Q355C material and designed as a combination of vertical and inclined piles. This foundation will have an octagonal shape, 36.0 meters long, 23.0 meters wide, and 3.0 meters thick. The lower part of the cap will be propped up by 4 steel pipe piles measuring 2.0 meters in diameter and 30 mm in wall thickness; 4 steel pipe piles measuring 1.5 meters in diameter and 30 mm in wall thickness; and 12 steel pipe piles measuring 1.5 meters in diameter and 30 mm in wall thickness and arranged in a 1:5 slope on the cap. The arrangement of the steel pipe piles within the high-pile cap foundation is shown in Figure 1, and the material parameters of the steel pipe piles are given in Table 1.
3 Translocation and Installation Plan for Upper Section Blocks of Offshore Booster Station
3.1 Key Construction Equipment and Plans
3.1.1 Primary tools and equipment
Upper section blocks are moved for translocation and installation using hydraulic module trolleys, for which mobile tracks need to be pre-installed on the transportation vessel and foundation. Dedicated installation brackets, serving as transitional supports, are fabricated for this purpose, and the upper section blocks are placed on the brackets. The brackets, in turn, are moved with the help of the hydraulic module trolleys.
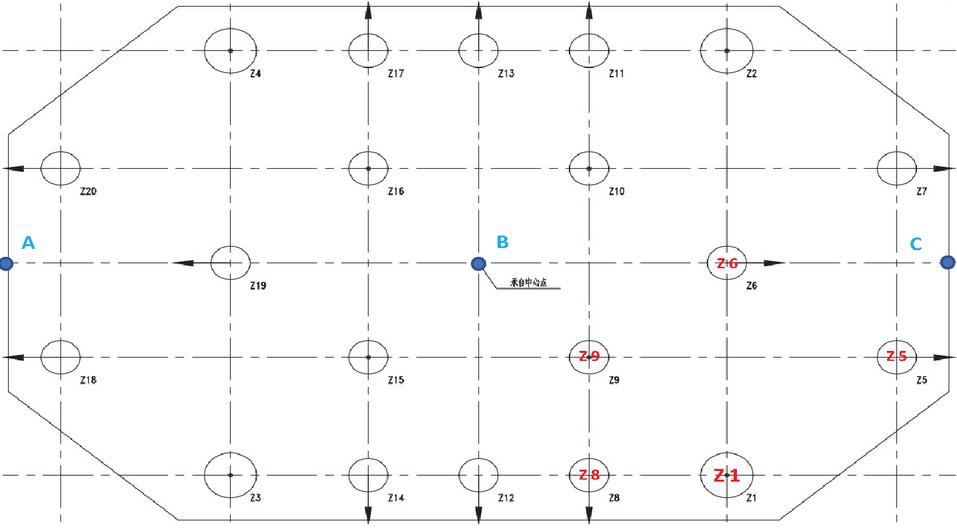
Figure 1 Schematic diagram of steel pile layout of high pile cap.
Table 1 Main parameters of steel pipe pile
| Index | Wall | Pile | |||
| Number | Diameter/m | Type | Thickness/mm | Length/m | Number |
| 1 | 2.0 | vertical pile | 3040 | 54.0 | 4 |
| 2 | 1.5 | vertical pile | 2535 | 51.5 | 4 |
| 3 | 1.5 | 1:5 battered pile | 2535 | 51.5 | 12 |
Table 2 Hydraulic module trolley equipment parameter table
| L*B*H | 5600 mm * 1300 mm * 1400 mm (500) |
| Own weight | 18 t |
| Liftingforce | 450 t per unit |
| Tire pressure | 39 T |
| Wheelbase | 1250 mm |
| Track | QU100 |
| Number of driving cars | 2 |
| Number of trailing cars | 8 |

Figure 2 Hydraulic trolley and specialized bracket.
3.2 Specialized Bracket Lashing Scheme and Verification
Twenty pieces of FB350X20 lashing flat steel are arranged longitudinally and 26 pieces are arranged transversely to create the connection between the booster station and the bracket. To compensate for the horizontal forces between them, wooden pads are placed in-between. The lashing flat steel is welded on both the booster station and the bracket with a minimum weld throat thickness of 9 mm. Therefore, in the calculations between the booster station and the bracket, frictional forces are not taken into account. The support structure verification consists of assessing the lateral and longitudinal sliding balance and the lateral and longitudinal overturning balance between the booster station and the support frame to check if it is matching the regulations’ requirements.
The transverse force at the booster station was found to be F0y 5263.82 kN, and the longitudinal force was determined to be F0y 2880.49 kN. Utilizing “Appendix 1: Strength Standards for Supporting Members and Lashing Components” in the CCS “Guidelines for Towing at Sea” (2011) as a reference and with an unevenness coefficient of 1.5, the safety factor K for angle welds of lashing components was calculated as 2.6, resulting in allowable shear stress of 60 N/mm. These transverse lashing welds of the lashing flat steel were calculated to have a safety working load of 9828 kN, which meets the requirement of forcing F0y 5263.82 kN. For the longitudinal lashing welds of the lashing flat steel, the calculated safety working load of 7560 kN was found to be higher than the required force F0y 2880.49 kN, thus fulfilling the longitudinal design requirement.
The transverse overturning balance must meet the equation F0y a F0z() b CSi di, where F0y is the transverse force on the booster station, 5263.82 kN; a is the lever arm of the transverse force around the center of rotation (8.80 m); F0z() is the vertical force on the booster station, 26430.00 kN; b is the lever arm of the vertical force around the center of rotation (10.0 m); CSi is the safety working load of the i-th securing device; di is the lever arm of the safety working load of the securing device around the center of rotation. For this calculation, a conservative approach is applied, considering only the restoring moment created by gravity when calculating the restoring moment. As a result, the overturning moment is calculated as F0y a 46321.62 kNm, and the restoring moment is calculated as F0z() b 264300.0 kNm. As the restoring moment is greater than the overturning moment, the condition is satisfied.
The longitudinal overturning balance should satisfy the equation F0x a F0z() b CSi di, where F0x is the longitudinal force on the booster station (2880.49 kN), a is the lever arm of the longitudinal force about the center of rotation (8.80 m), F0z() is the vertical force on the booster station (26430.00 kN), b is the lever arm of the vertical force about the center of rotation (8.555 m), CSi is the safety working load of the i-th securing device, and di is the lever arm of the securing device’s safety working load about the center of rotation. Taking a conservative approach, only the restoring moment generated by gravity is considered when calculating the restoring moment. Therefore, the overturning moment is calculated as F0x a 25348.31 kNm, and the restoring moment is calculated as F0z() b 226108.65 kNm. This meets the requirement that the restoring moment is greater than the overturning moment.
3.3 Installation Construction Process
The typical process for the translocation and installation of upper section blocks in an offshore booster station is as follows: The upper section blocks are moved to the transport vessel using hydraulic trolleysThe transport vessel transports the upper section blocks to the designated location of the booster stationThe upper section blocks are moved from the transport vessel to the specified position on the foundation of the booster stationThe upper section blocks are lowered to the designated position.
First, the hydraulic trolleys are utilized to move the upper section blocks of the booster station (total weight approximately 3000 tons) from the platform in front of the dock to the installation vessel, which is connected to the platform track by a connecting beam. The blocks are then loaded onto the transport vessel, secured with pallets, tied down, and towed to the construction site.
Once the transport vessel is anchored and positioned, it waits for the tide to rise. When the water level is sufficient, the transport vessel is smoothly aligned with the track on the foundation of the booster station. The hydraulic trolleys are then employed to move the upper components from the transport vessel to the designated position on the foundation platform. The trolleys then release the lifting devices, lowering the components by 0.5 meters. The four support legs of the components settle onto the foundation platform, and upon removal of the trolleys from the bracket platform, the installation is complete.
The high-pile support platform experiences forces during the implementation steps, as indicated in Table 3.
Table 3 Implementation of the upper block of the offshore substation
| Working Condition | Upper Block to Cap Ratio | Load (t) |
| 1 | 1/4 | 900.8 |
| 2 | 1/2 | 1801.6 |
| 3 | 3/4 | 2702.4 |
| 4 | 4/4 | 3603.2 |
The installation process monitoring includes tilt monitoring and triaxial acceleration monitoring, achieved through tilt sensors and triaxial accelerometers. During the transportation and installation of the offshore booster station, the vertical acceleration should not exceed 0.2 g, the roll should not exceed 20, and the pitch should not exceed 10. The monitoring equipment is powered using ship electricity and UPS voltage stabilization, with power supplied at 9-36V through AC/DC conversion. To reduce energy consumption, the sensors are activated during the transportation stage.
4 Numerical Analysis of Foundation Bearing Capacity Calculation
4.1 Static Load Test of Offshore Single Pile
A vertical bearing performance test of a steel pipe pile foundation was conducted to acquire data on the bearing capacity characteristics of the subsoil for the current project. The pile, referred to as S1, had a height of 51 m, a diameter of 1.8 m, and a wall thickness of 25 mm. It was embedded 29 m deep. The rapidly maintained load method was implemented using seven levels of loading, starting with 2900 kN and finishing with 725 kN, with the intermediate loads split evenly between the two, at 1450 kN per level. Every level of load was maintained for an hour and the load-displacement (Q-s) curve of the static load test at the pile head can be seen in Figure 3.
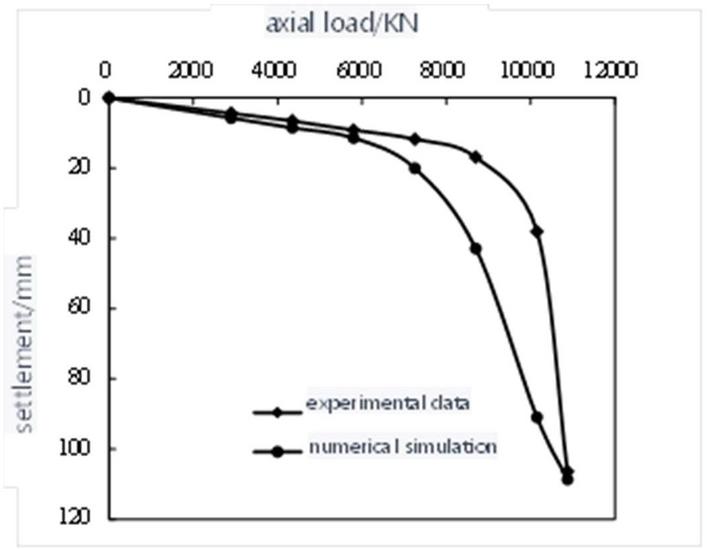
Figure 3 Load-settlement (Q-s) curve of pile top in field test and numerical simulation.
4.2 ABAQUS Numerical Simulation
A finite element numerical model of the entire structure, as shown in Figure 4, was set up using ABQUS software. This model had a semi-cylindrical shape with a radius of 30 m and a depth of 60 m. The bottom and sides of the model were entirely restrained in normal displacement with symmetry plane constraints; however, the top surface was left free. To best simulate the contact between the steel pile and the soil, hexahedral elements were used, with “hard” normal contact and tangential contact that was assigned through penalty function to portray the pile-soil friction. In order to include the force of gravity in the initial stress distribution of the numerical model, the vertical load was applied after computing the initial stress. The ultimate vertical bearing capacity Qu extracted from this ABAQUS numerical simulation was 10450 kN, which was similar to the field test result of 10150 kN for the single pile. This underscores the validity of the numerical model as well as the reasonable selection of soil mechanical parameters and pile-soil friction coefficient in the numerical model.
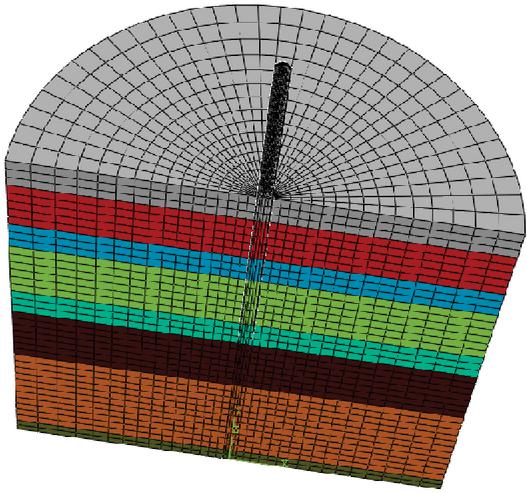
Figure 4 Numerical model of ABAQUS single pile foundation.
For the numerical analysis of the offshore high-pile supporting platform foundation, the soil mechanical parameters obtained from the field vertical static load tests conducted on single piles with a diameter of 1.8 m, as well as the pile-soil contact parameters obtained from the ABAQUS numerical simulation of the single pile were utilized. This is so as the platform consists of steel piles with two types of diameters: 1.5 m and 2.0 m.
4.3 ABAQUS Numerical Model
ABAQUS was utilized to develop a numerical model of the high-pile cap, taking advantage of the symmetry of the pile-soil system and load application. Solely half of the model was selected for convenience; then the results were mirrored. C3D8R elements, with steel pipe piling diameters of 2 m and 1.5 m to simulate vertical and 1:5 inclined piles, were used as elastic piles that involve internal forces. The soil was modeled using EC3D8R elements with the Mohr-Coulomb constitutive model, represented as an elastic-plastic material. General contact was utilized to simulate the pile-soil contact with linear contact for normal and penalty function for the tangential contact, including friction coefficients. The cap was modeled employing C3D8R elements, presumed as elastic and crack-free material, with C45 concrete as the material. The bottom surface of the model was restrained against displacement in all three axes dimensions; additionally, the sides and symmetry plane were restrained against vertical displacement normal to the surface boundary. The upper soil surface was set as a free surface with no restraints. To account for the marine operation atmosphere, the soil in the model was assigned buoyant unit weight during calculation. Prior to applying vertical loads, gravity was initially applied to the model, and a predefined gravity field was set to accelerate the calculation process. Using an explicit calculation method, the simulation is run long enough to eliminate the oscillation and obtain the initial ground stress.
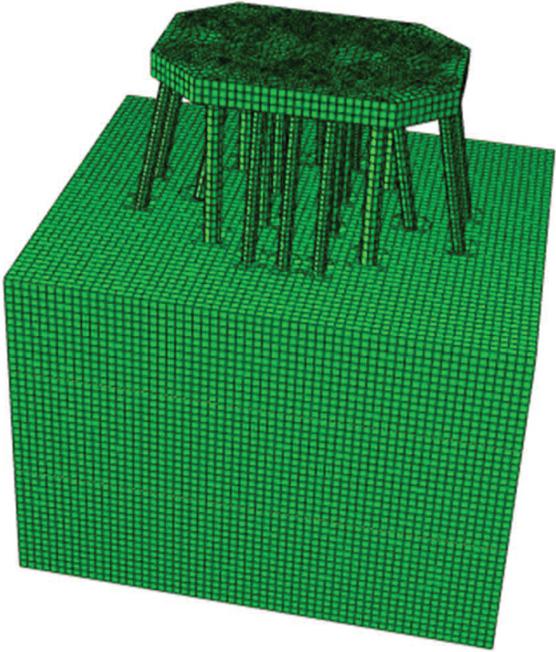
Figure 5 Numerical model of pile foundation of high pile cap.
4.4 Selection of Model Calculation Parameters
Located in the Zhegensha Sea area of Jiangsu Province, China, the project belongs to the coastal depositional landform unit where the underwater beach topography decreases from south to north. The elevation here ranges from 13.0 to 2.8 meters, and the surrounding elevation of the booster station is 8.0 meters. The surface layer of the foundation soil here mainly consists of silt and silt with clay. To analyze the significance of the geological distribution and physical-mechanical parameters of the soil, field pile load tests were conducted, and the data thus obtained were used for numerical simulations of single-pile vertical load-displacement. Numerical simulations of single-pile vertical load-displacement were performed using the initial model. The simulation results were repeatedly compared with the actual measurement values, thus allowing for optimization and adjustment of the numerical simulation parameters. The experimental parameters of the pile and soil obtained from this optimization process are recorded in Table 4. The shear strength parameters of the soil in Table 4 are based on effective strength indicators, while the friction coefficient represents the contact parameter setting between the soil layer and the inner and outer surfaces of the pile.
Table 4 Physical and mechanical parameters of the formation
| Effective | ||||||||
| Stratum | Elastic | Cohesive | Friction | Unit | ||||
| Stratum | Thickness | Modulus | Poisson’s | Strength | Angle | Friction | Dilatancy | Weight |
| Number | (m) | (mpa) | Ratio | (kpa) | () | Coefficient | () | (kn/m) |
| Soil layer 1 | 12 | 140 | 0.3 | 3.5 | 33 | 0.268 | 3 | 9.0 |
| Soil layer 2 | 14 | 70 | 0.3 | 31 | 30 | 0.268 | 0.1 | 8.8 |
| Soil layer 3 | 15.1 | 130 | 0.3 | 3.5 | 33 | 0.268 | 3.5 | 9.3 |
5 Numerical Simulation Results
5.1 Stress Analysis of the Footing and Pile
At the bottom of the footing near the connection with the inclined pile, a stress analysis was conducted and revealed a maximum equivalent stress of 3.11 MPa in working condition 1 (tensile stress) and 8.02 MPa in working condition 2 (compressive stress). This can be seen in Figure 6 which demonstrates an increase in stress at the connection between the footing and the pile.
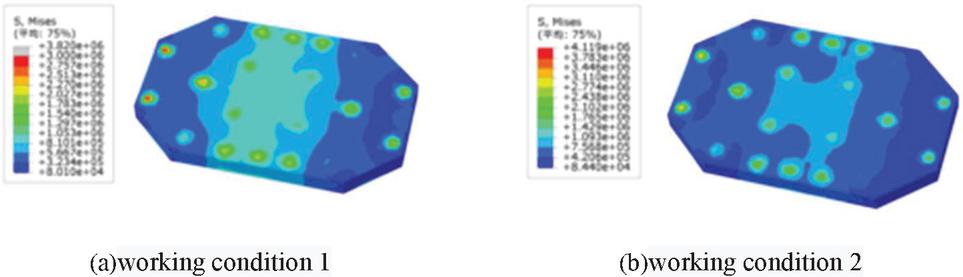
Figure 6 Mises stress analysis of cap.
As shown in Figure 7, the maximum equivalent stress in the pile body is 8.40 MPa in working condition 4, meeting the design requirement. The frictional force and soil resistance acting on the pile body beneath the mud surface reduce the load on the lower part of the pile body, making its stress relatively small. Meanwhile, the stress is more concentrated in the middle and upper parts of each pile.
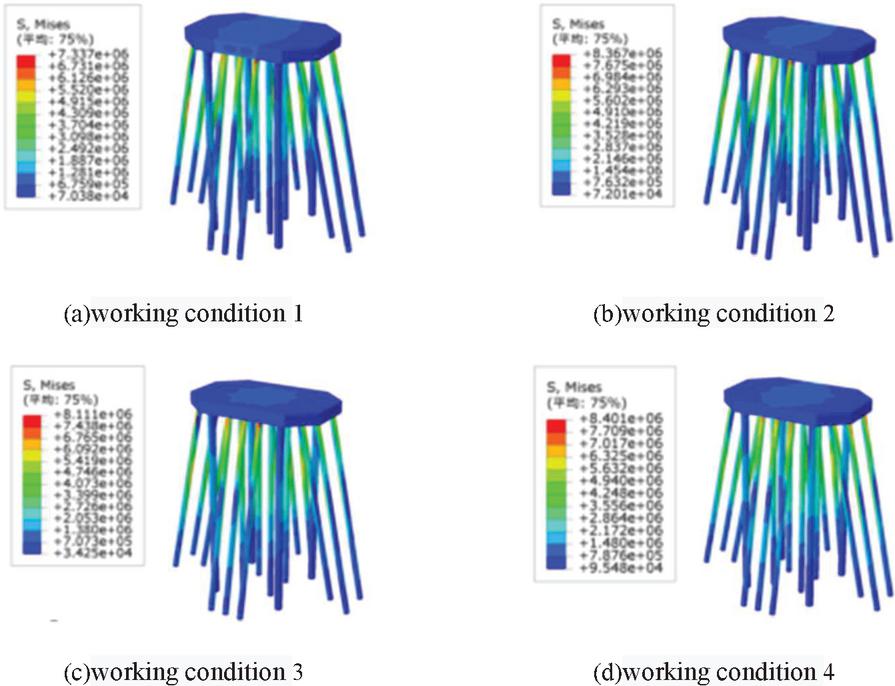
Figure 7 Mises stress of pile.
5.2 Settlement Calculation of the Footing
Table 3 and Figure 8 display the variance in settlement of the high-pile footing throughout the translation of the upper section of the booster station. Working condition 1 shows the initial settlement at center point B to be 2.42 mm, increasing to 7.04 mm after translation. Settlement at left point A first rises to 13.01 mm at working condition 2 before gradually decreasing to 9.03 mm. At right end point C, settlement initially decreases to 0.58 mm in working condition 2, rising to a final settlement of 9.01 mm gradually. The maximum amount of uneven settlement on both sides of the high-pile footing, a critical scenario, is 12.43 mm and occurs in working condition 2. Thus, during actual installation and construction, one should take extra caution to monitor the uneven settlement of the footing. As the translation completes, the settlement in the middle is smaller than the side settlements, which is around 9.00 mm, with a minimum uneven settlement of approximately 2.00 mm. Overall, the uneven settlement caused by the load of the upper section of the booster station fluctuates from 2 mm to 13 mm from start to end.
Table 5 Change of settlement of high pile cap during translation of the offshore substation
| Settlement (mm) | |||
| Working Condition | Left End Point A | Center Point B | Right End Point C |
| 1 | 9.96 | 2.42 | 1.03 |
| 2 | 13.01 | 4.73 | 0.58 |
| 3 | 12.54 | 6.99 | 2.77 |
| 4 | 9.03 | 7.03 | 9.01 |
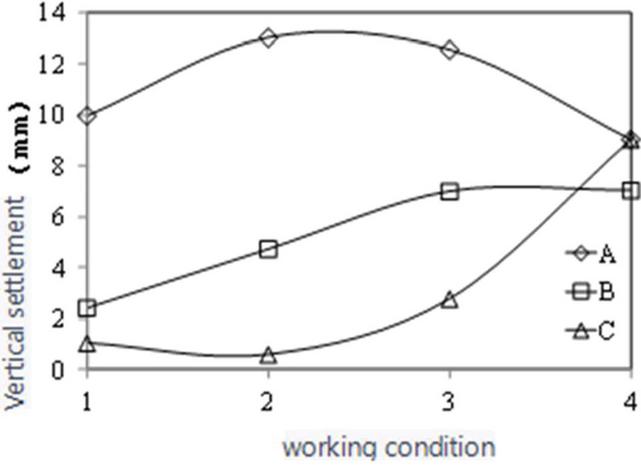
Figure 8 Settlement at a specific point of the cap under different working conditions.
5.3 Ultimate Load Capacity of High Pile Cap
Conducting numerical simulation studies on the bearing performance of high pile cap foundations can provide technical support for the construction of subsequent offshore wind farms in the area, since on-site static load tests for high pile cap foundations are expensive and challenging to conduct offshore. To obtain a continuous Q-s curve, displacement loading was used to vertically load the pile cap in this study, as opposed to stress loading which only yields foundation settlement for specific working conditions and discrete Q-s points. The resulting Q-s curve is illustrated in Figure 9.
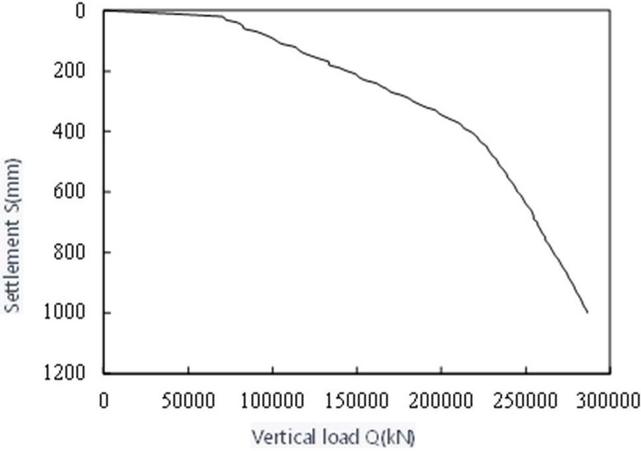
Figure 9 Q-s curve of high pile cap foundation.
Based on Figure 9, the Q-s curves produced from numerical simulations display a marked decrease in slope. As per the “Technical Specification for Testing and Detection of Water Transportation Engineering Foundation” (JTS 237-2017), this study chose the load matching the start point of the steep descent segment as the simulated pile’s ultimate vertical bearing capacity, estimated at 230,437 kN. The platform comprises 20 steel pipe piles, producing an average bearing capacity of 11,521 kN per pile. This is similar to the ultimate bearing capacity of 10,150 kN yielded from the one-pile field test, demonstrating the credibility of the numerical model calculation results.
6 Conclusion
By analyzing the settlement of high-pile caps and the forces acting on the pile group during the installation of upper blocks in the “Zhugensha 300 MW Offshore Wind Farm Project,” together with utilizing the ABAQUS numerical simulation method, the following key findings are obtained:
The most critical condition, during the installation of upper blocks in the “Zhugensha 300 MW Offshore Wind Farm Project”, demonstrated by the maximal uneven settlement of the high-pile cap of 12.43 mm, occurs when the upper blocks are moved to the mid-point of the pile cap. It is recommended to monitor the uneven settlement of the cap during the actual installation. Moreover, the overall uneven settlement of the cap caused by the load of the upper blocks ranged from 2 mm to 13 mm.
In terms of stress on the structure, the maximum equivalent stress on the underside of the cap near the connection with the inclined piles occurred during Condition 1 with a maximum tensile stress of 3.11 MPa, and during Condition 2 with a maximum compressive stress of 8.02 MPa. The maximum equivalent stress in the pile body was 8.40 MPa, which occurred during Step 4, and it mainly concentrated in the upper part of each pile, decreasing rapidly below the mud surface due to the friction and resistance of the soil.
The group piles of the high-pile cap foundation were divided into five types, forming the high-pile cap foundation displayed a similar variation trend in side friction resistance. Starting from the surface down to a depth of 12 m, the side friction resistance showed a sharp increase, but became more gradual in the range of 12–26 m, ultimately reaching a maximum value for vertical piles Z1 and Z9 of approximately 700 kPa and 640 kPa respectively, while inclined piles Z5, Z6 and Z8 had a maximum of less than 520 kPa. Thus, an appropriate combination of various pile types must be considered during engineering design to ensure the stability of the cap and reduce the project cost.
The Q-s (load-settlement) curve obtained from ABAQUS numerical simulation exhibits a distinct inflection point. It yielded an ultimate bearing capacity of 230,437 kN and an average bearing capacity of 11,521 kN per pile, which were in satisfactory agreement with the data from a field test of a single pile, confirming the validity of the numerical model.
References
[1] Mohsen B, Mehdi E, Bijan S. Effect of Seismic Soil–Pile–Structure Interaction on Mid- and High-Rise Steel Buildings Resting on a Group of Pile Foundations. International Journal of Geomechanics, 2018,18(9).378–395.
[2] Jashod R, Ashutosh K, Deepankar C. Natural frequencies of piled raft foundation including superstructure effect. Soil Dynamics and Earthquake Engineering, 2018,112.69–75.
[3] Sun M M, Li X, Li W. Research on the response characteristics of offshore wind turbine high-pile footing foundations. Acta Energiae Solaris Sinica, 2020,41(07).265–273.
[4] Jiang H, Wang B X, Wang Z G, Gu Q, Wang, M, Li C. Comparative study on dynamic response of deepwater high-pile footing group foundations under different types of seismic motions. Building Structure, 2018,48(S2).818–826.
[5] Analysis method for the settlement of jack-up barge spud cans during the translation process of offshore booster stations. Ship Engineering, 2022,44(12).149–156.
[6] Mohsen B, Mehdi E, Bijan S. Effect of Seismic Soil–Pile–Structure Interaction on Mid- and High-Rise Steel Buildings Resting on a Group of Pile Foundations. International Journal of Geomechanics, 2018,18(9).378–395.
[7] Zhao X G, Gao W S. Shaking table test study on high-pile footing group foundations under seismic action. Building Structure, 2019,49(17). 120–129.
[8] Zhang X F, Miao Rusong. Simulation analysis of service performance and damage evaluation of high-pile footing foundations. Journal of Jilin University, 2020,50(03).1006–1016.
[9] Li T F, Jiang J. Structural and parameter optimization analysis of high-pile footing foundations for offshore wind turbines. Inner Mongolia Water Resources, 2018(10).66–69.
[10] Zhang X. (2020). Research on damage analysis model of deepwater high-pile footing foundations. Journal of Disaster Prevention and Mitigation, 2020,1–6.
[11] Wang X P, Jiang M J, Jiang G D. Design of High-Pile+Low-Wide Footing Structure Scheme. Port & Waterway Engineering, 2019(08). 101–105.
[12] Zhang R H, Huang L. A Review of Pile Foundation Settlement Calculation Methods. China Water Transport, 2013,13(3).243–245.
[13] Hossain M S, Randolph M F. Deep-Penetrating Spudcan Foundations on Layered Clays: Numerical Analysis. Géotechnique, 2010,60(3). 171–184.
[14] Anish S, Serhan G. System-level modelling methodology for capturing the pile cap, helical pile group, and soil interaction under uplift loads. Engineering Structures, 2020,220.110977.
[15] Nishant S, Kaustubh D, Arindam D. Natural period of reinforced concrete building frames on pile foundation considering seismic soil-structure interaction effects. Structures, 2020,27.1594-1612.
Biography

Zhou Maoqiang, male, holds a Master’s degree in Engineering and is a Senior Engineer. He currently serves as the Deputy Chief Engineer of the New Energy Division at State Nuclear Electric Power Planning Design & Research Institute Co., Ltd. He has led the development and construction of several offshore wind power EPC turnkey projects in China. His primary research direction focuses on innovative management models for offshore wind power project development and design-construction technology innovation.
Strategic Planning for Energy and the Environment, Vol. 43_2, 293–310.
doi: 10.13052/spee1048-5236.4325
© 2024 River Publishers