Prediction and Management of Building Energy Consumption Based on Building Environment Simulation Design Platform DeST and Meteorological Data Analysis Algorithm
Chaoqin Bai* and Junrui Liu
School of Civil Engineering and Architecture, Henan University of Science and Technology, Luoyang, 471000, China
E-mail: 9903255@haust.edu.cn; 9906432@haust.edu.cn
*Corresponding Author
Received 02 August 2023; Accepted 01 November 2023; Publication 09 January 2024
Abstract
Currently, the carbon emissions of building energy consumption account for a significant portion of all carbon emissions. How to reduce carbon emissions to achieve carbon neutrality is an important current research direction. Therefore this research builds a predictive algorithm model for analyzing energy consumption data of meteorological buildings using DeST platform for energy saving and emission reduction to achieve carbon neutrality. The new model uses Internet of Things and cloud platform technology to build a simulation building platform, and uses the support vector machine algorithm in the analysis algorithm to vectorize building energy consumption data, which can achieve normalization processing of building energy consumption and meteorological data. By processing building energy consumption data, prediction of building energy consumption at the next moment can be achieved. The experimental results show that the precision and accuracy of the new algorithm are higher than genetic algorithm 1 and 0.15 respectively, and 0.6 and 0.07 higher than clustering analysis algorithm respectively. Therefore, applying this algorithm model to building energy consumption prediction can significantly improve the accuracy and precision of the algorithm.
Keywords: Carbon emissions, building energy consumption, internet of things, cloud platform, support vector machine algorithm.
1 Introduction
At present, China’s energy consumption has surpassed that of the United States and Japan, becoming the country with the largest energy consumption in the world. To achieve the goal of energy conservation and emission reduction, reducing energy consumption is the main goal of current development. Building energy consumption (BEC) has become the focus of current attention due to its extremely high proportion of carbon emissions. How to achieve prediction of BEC and improve the accuracy and precision of the prediction has become the key to solving this problem [2]. The main approach to building energy conservation is to adopt more efficient and reasonable energy-saving technologies, which requires accurate prediction of BEC. However, due to the lack of processing function for annual meteorological data on the building environment simulation design platform, the accuracy of energy consumption prediction is relatively low [4]. Therefore, based on this, by combining DeST simulation with meteorological data analysis, a more accurate prediction of the energy consumption of buildings under different meteorological conditions can be realized. At the same time, new energy management strategies are developed to enable buildings to achieve more efficient energy utilization under different meteorological conditions. Effective energy management can also reduce the energy consumption of buildings, alleviate the environmental burden and promote the development of sustainable buildings. This study combines building environment simulation and meteorological data analysis to provide a comprehensive approach for building energy consumption prediction and management. At the same time, DeST and weather data analysis algorithms enable a higher degree of building performance simulation and data-driven energy management. It provides a smarter and more sustainable building energy management solution for the construction industry, which helps to meet the challenges of climate change and resource scarcity. The study is divided into four parts in total, the first part is the elaboration of the research results at home and abroad, the second part introduces the process of building the algorithm model and platform, the third part is the analysis of the experimental results on the predictive ability of the algorithm, and the fourth part is the summary of this study.
2 Related Works
In recent years, with the increasing attention paid to the carbon emissions generated by buildings, more experts and scholars have focused their research on predicting BEC. Peng Bao et al. believed that central air conditioning in some large shopping malls was the main equipment for BEC, and reducing the energy consumption of air conditioning could reduce BEC. Therefore, based on the long and short-term memory neural network, a BEC regression model has been constructed. The new model could analyze and utilize the energy consumption data of air conditioning, and compare the predicted value of BEC with the actual value to obtain its maximum deviation. The experiment outcomes denoted that the deviation between the actual and predicted values of the model was less than 10%, which had higher accuracy in BEC [5]. Lei et al. believed that efficient prediction of BEC could improve the management level of the power system. Therefore, a new BEC prediction model was built on the basis of deep neural networks. The new model could extract features from key factors of BEC and identify the key factors of BEC. The research findings indicated that the combination of the rough set of BEC and the deep neural network model could most accurately predict the BEC, and at the same time provide a practical scheme for the future BEC prediction [6]. Wenninger Simon et al. found in their research that carbon emissions from many buildings were currently the main source of carbon emissions, so it was necessary to invest research in reducing building carbon emissions. However, traditional research only tested predictive performance and did not consider neural network algorithms. Therefore, a BEC prediction model based on throwing neural network algorithm was proposed. The experimental findings expressed that the model using neural network algorithms could predict BEC and replace some traditional prediction schemes [7]. Sun Jian et al. believed that BEC played an important role in resource management planning, but the accuracy and optimization speed of prediction models limited their performance. Therefore, an enhanced fusion framework based on light superposition was proposed. The new framework could optimize and integrate different types of parameters. The research outcomes expressed that the new framework could increase the prediction accuracy of the model and reduce computational time [8].
Yibo Chen et al. believed that many studies on the prediction of BEC focused on the basis of overall energy consumption, without distinguishing different characteristic data. Therefore, based on linear regression and cluster analysis, an improved recognition prediction model was proposed. The new model could utilize fluctuation feature data and implicit relationships of various factors to achieve prediction of BEC. The experiment findings indicated that the new model could provide prediction accuracy and improve its applicability to BEC [9]. Luo X J et al. found that the prediction of BEC was related to some meteorological factors and time characteristics. Therefore, to accurately predict BEC, a new BEC prediction system based on long and short-term memory network and hybrid genetic algorithm was proposed on the traditional prediction model. The new model could achieve the relationship between energy consumption data and time. The experimental results showed that the new model outperformed other algorithm models in accuracy and precision [10].
Manan Singh et al. found in their research on BEC that computational fluid dynamics could better predict the impact of indoor environment on BEC. Therefore, on the basis of fluid dynamics, a new framework for predicting building energy dissipation performance was proposed. The experiment outcomes indicated that the new framework could improve the accuracy and applicability of BEC prediction [11]. Maltais Louis Gabriel et al. believed that traditional BEC required predicting the consumption of domestic hot water, but it was difficult to accurately predict the model data in daily life. Therefore, an optimized BEC model has been proposed, which could predict the energy consumption of key domestic hot water buildings. The experiment findings illustrated that the new model had good performance in prediction accuracy [12].
In summary, many experts and scholars have achieved many research results in the prediction of BEC. However, there are still many problems with BEC, and many models are unable to accurately predict BEC data. At the same time, the lack of accuracy in current algorithm models is also the key to the current problem. Therefore, based on this, a new prediction research platform has been designed and a new algorithm model has been built in this study.
3 Algorithm Model Construction for BEC Prediction Based on DeST Platform Meteorological Data Analysis Algorithm
This chapter mainly builds a new DeST platform through research on the IoTs and cloud platforms. SVM algorithm is used for analyzing meteorological data. Finally, under the DeST platform framework, a BEC algorithm model applying meteorological data analysis is proposed.
3.1 Construction of a Building Environment Simulation Design Platform
The IoTs refers to a new network technology that can collect and process data, images, and other information at that time through various technologies such as information perception, system positioning, stable perception and laser scanning technologies [13]. The general framework of the IoTs can be divided into device perception, network usage, and system applications. The IoTs is the most commonly used and effective method for achieving connectivity between network systems and materials. The platform of the Internet of Things can build a network platform of information data through cloud technology to realize the unified and stable processing of data. The current use of the Internet of Things is divided into four platform layers, and different platform layers play different roles and work together to build a complete Internet of Things system. As shown in Figure 1.
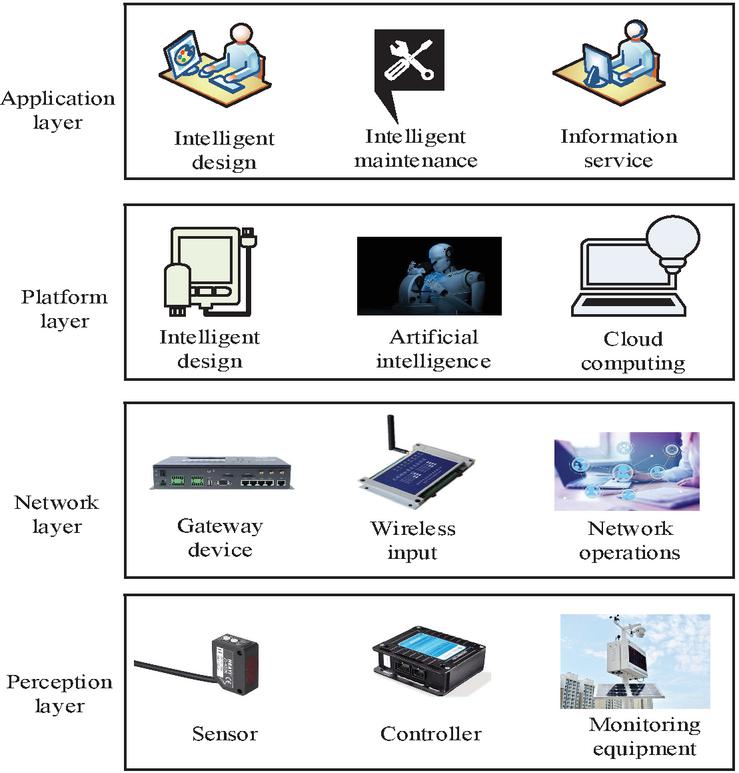
Figure 1 IoT system structure.
In Figure 1, the IoTs is divided into four platform layers, including the packet buckle application, platform, network and perception layers. The application layer mainly connects users and system networks to achieve refined management of some intelligent products, such as smart home appliances, smart healthcare, etc; The platform layer is an integrated functional layer that manages and controls some terminal devices, and also plays a role in connecting the upper and lower functional layers in the IoTs; The perception layer is a functional layer that perceives some sensor devices in the system platform, such as temperature sensors, photosensitive sensors, etc; The network layer is a functional layer that perceives and stores information for some networks, while also serving as a connection between the perception layer and the platform layer [14]. The use of the Internet of Things (IoT) is mainly for real-time data monitoring of some current systems, such as air conditioning, lighting, drainage and other systems in building energy consumption. The cloud platform is a platform network for storing and processing building energy consumption data. At the same time, cloud platform is used in many fields because of its strong security and extensibility. Through the connection of the Internet of Things and the cloud platform can realize the flow and calculation of some data, as shown in Figure 2 for the current use of the cloud platform information flow structure.
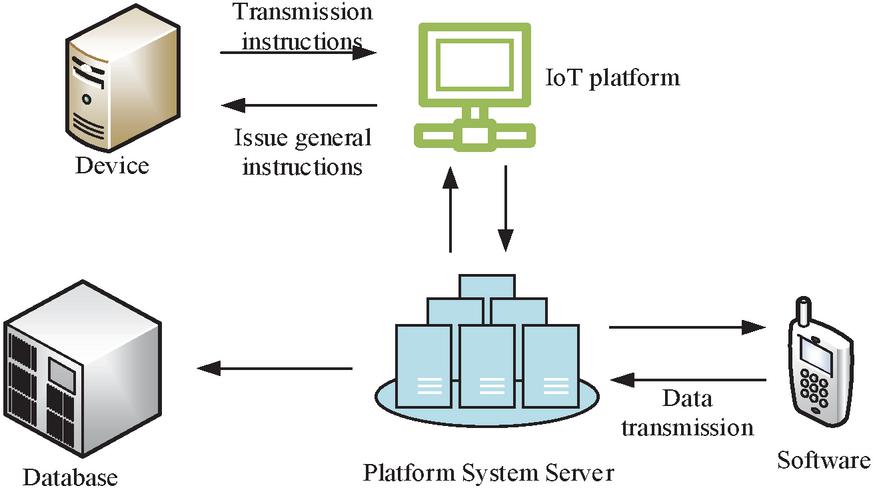
Figure 2 Cloud platform system information flow.
The entire cloud platform system in Figure 2 consists of a database, user software, platform system servers, etc. When the platform is running, the information data input into the server is first processed, and then the transmitted data is called to obtain it into the IoTs platform. At the same time, the data being processed at this time is input into the database. The data is classified and processed in the IoTs platform, and then transmitted to the current equipment to issue general instructions. Finally, the transmission instructions complete the data entry into the IoTs platform, and the software data instructions are executed through the flow into the server.
When building a meteorological parameter data collection platform, the system framework is constructed using IoTs technology and cloud platforms. The DeST environment building simulation software is used to calculate the algorithm for meteorological data and energy consumption data. Finally, multiple data are obtained and uploaded to the cloud platform, achieving visual platform construction in the IoTs. The specific operation and application are as follows: first, it needs to design and build a sensor system to collect data such as temperature and humidity, air, and BEC; Secondly, it needs to build a simulation model of the building to conduct experiments on the simulation model, to obtain experimental data and improve the current system; The collected data are stored into the current cloud platform; Finally, after all data collection is completed, a visual interface design for building meteorology, building environment, and BEC will be implemented on the cloud platform [15]. The overall framework of the design platform is shown in Figure 3.
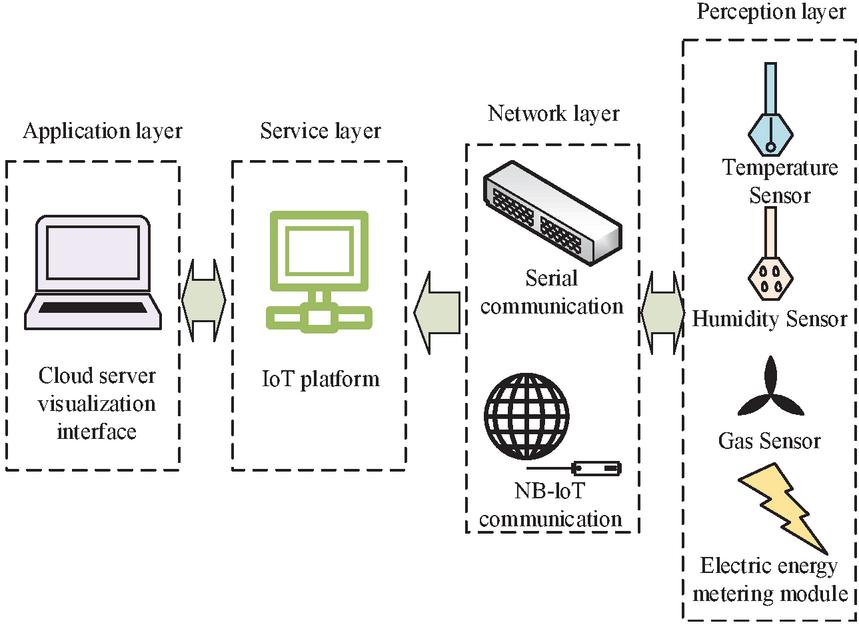
Figure 3 Overall framework of the design platform.
In Figure 3, the application layer of the system framework is composed of a visualized cloud server that can process and transmit information data transmitted by the cloud platform. The service layer is a functional layer that can analyze the transmitted data and also has the function of accessing devices in the network layer. The network layer receives device data from the perception layer and enables secure network connectivity to the cloud platform. The perception layer is the information acquisition layer of the entire framework, which can collect some perceptible information data, input the data into the network layer, and then process it. Therefore, in the design of the system framework, the use of cloud platforms and the IoTs can enrich the current framework, while connecting the network and real data to achieve visual design of the framework.
3.2 Algorithm for BEC Prediction Based on DeST Platform Meteorological Data Analysis Algorithm
DeST is mainly capable of reflecting some of the problems in building simulation through mutual coupling, and is currently used as a system design software to quickly deal with building simulation problems. DeST is able to simulate the data in the study of meteorological data, and get the simulation model to make the study more simple and easy to understand. The working structure of DeST includes a database, input and output interfaces, applications, and user interfaces. The central idea is to read, process, and transmit data, and finally save the data for processing in the data center [16]. The working principle is shown in Figure 4.

Figure 4 Divided into five modules.
The DeST framework in Figure 4 is divided into five modules. Firstly, it is the thermal characteristics module of the building, which mainly collects and analyzes the building’s lighting information, ventilation information, indoor and outdoor meteorological information, and building shadow information; The system module model is to analyze, design, and organize the entire scheme of the system to find the most suitable scheme. Air treatment module analysis is to analyze some air indicators to obtain a better analysis scheme; Wind system analysis is the analysis of the wind force magnitude and intensity of the entire ventilation system; The analysis of cold and heat source pump stations involves analyzing the temperature data of the building’s thermal and cold sensing sources, as well as the data of the water pump station. The process of building the DeST framework can be achieved through the analysis of multiple sets of data. The main working principle of DeST framework is to simulate the characteristics of some building systems, such as building thermal process analysis, DeST framework can provide some parameters such as the thermal properties of the building enclosure, and then realize the simulation of the system. The main process is to construct a building model and then draw the structure of the building enclosure, set specific parameters such as weather for simulation and analysis, and finally output the analysis results. The analysis of the data is mainly realized by the support vector machine algorithm.
The SVM (SVM) algorithm is a supervised learning algorithm. It mainly maps some linear data into the feature space through the introduction of functions, realizes the process of algorithm data from low dimensions to high dimensions, and can express data through the feature space [17]. SVM algorithm is the most commonly used neural network algorithm in predicting BEC. When performing dimensionality reduction on the data samples, the regression data samples can be represented as expressed in Equation (1).
| (1) |
In formula (1), denotes the number of samples; means the vector expression when input data; expresses the vector expression when output data; denotes the sample of data when regression; is space; will project data into high dimensions when nonlinear mapping, so the regression function expression in high dimensional space is shown in formula (2) [18].
| (2) |
In formula (2), indicates the weight vector in the regression sample ; represents the transformation function from space to another space, and indicates the intercept of the function at this time, where , . When dealing with a given training set, the expression of the training set can be represented by formula (3).
| (3) |
In formula (3), denotes the training set, and represents the vector coordinates of the data. The coordinate information of can be expressed by formula (4).
| (4) |
In formula (4), means the input vector value mapped when the number of samples is . The core content of SVM algorithm is to project low latitude nonlinear kernel functions into high-dimensional space through algorithmic operations, so the low latitude operation space of the algorithm needs to be mapped by some algorithms. Formula (5) is a linear kernel function expression.
| (5) |
In formula (5), represents the kernel function; denotes the coordinates of the kernel function at this time; denotes the high-dimensional coordinates after the kernel function of is mapped to . When the linear kernel function is expressed through the SVM algorithm vector, the entire expression is transformed to obtain formula (6) [19].
| (6) |
In formula (6), the kernel function expression is the same as the original kernel function expression, but the difference is that the vector coordinate is the initialization vector coordinate. When the number of kernel functions increases, the expression of the kernel function becomes a polynomial kernel function expression, as shown in formula (7).
| (7) |
In formula (7), refers to the number of kernel functions. When the number of kernel functions is sufficient and the class of multiple kernel functions is high enough, the value of the kernel function will infinitely approach infinity, and the complexity of the function will increase, resulting in an increase in computational complexity. The radial basis function is an expression function of sample performance, as shown in formula (8).
| (8) |
In formula (8), stands for the parameters of the compute kernel. When new parameters are introduced into the SVM algorithm, the linear regression problem of the algorithm will become a convex quadratic programming problem, and its expression will become as shown in formula (9).
| (9) |
In formula (9), is the relaxation variable of the kernel function; expressed the penalty function; refers to the weight vector. The decision function expression shown in formula (10) can be obtained by Lagrange transformation of the kernel function.
| (10) |
In formula (10), , where calculates the dual function value in the expression to calculate the value of . When a perceptron is added to the SVM algorithm, the expression of the function becomes as shown in formula (11).
| (11) |
In formula (11), stands for the constant in the function expression, with a value greater than 0. When calculating the accuracy and precision of algorithms, algorithm formulas are usually used to measure performance, as shown in formula (12).
| (12) |
In formula (12), refers to accuracy; represents the true case of the data; means the true negative case of the data; stands for the false positive case of the data; indicates the false negative case of the data. The precision expression of its algorithm is shown in formula (13).
| (13) |
In formula (13), means the accuracy of the data. To achieve higher accuracy or precision of the algorithm, it is necessary to improve the calculation parameters in the algorithm. To improve the parameters of the algorithm, the cross validation method needs to be introduced into the algorithm. Its principle is to select the best parameter value from the penalty factor in the algorithm and the parameters in the radial basis function. At this time, the algorithm strength will be enhanced by the improvement of the accuracy of the two factors [20]. Figure 5 shows the algorithm calculation steps of SVM algorithm when processing meteorological analysis data.
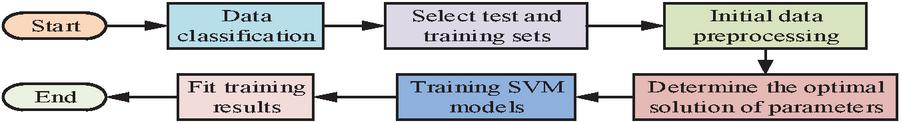
Figure 5 Calculation process of SVM algorithm.
As shown in Figure 5, when processing the meteorological data, first it needs to classify the data of the input algorithm, distinguish the training set and test set to be used. Then it needs to preprocess the initial data through the algorithm operation, and use the cross validation method to determine the penalty factor of the current algorithm and the optimal value of the parameters in the radial basis function. The SVM algorithm is optimized through parameter training, then the predicted calculation results are fitted, and finally the calculation results are output. At the same time the algorithm mainly considers the trend of meteorological data when processing the data, which includes the influence of factors such as temperature, humidity and solar radiation. After achieving the optimal solution of the algorithm, the calculated algorithm data will be analyzed on some building simulation models to predict the current predictable data and obtain a complete data prediction process model structure. The flowchart for building a prediction model is shown in Figure 6.
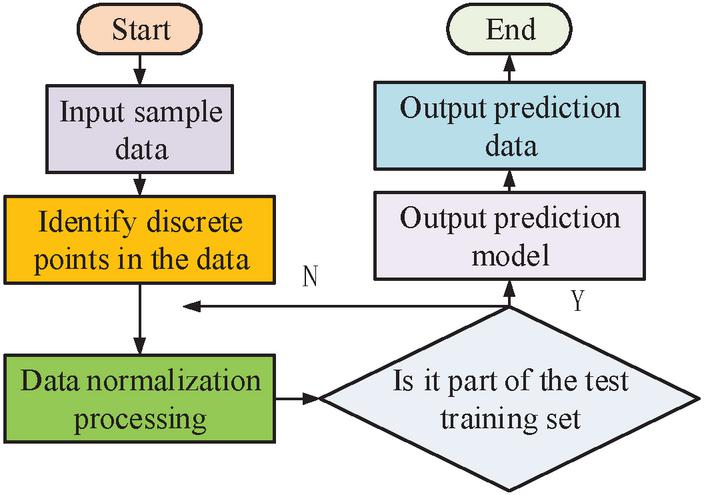
Figure 6 Prediction model building process.
As shown in Figure 6, after obtaining the sample data, the first step is to establish the discrete points of the sample data. By normalizing the data, the test and training sets calculated by the algorithm can be obtained. The two sets of data are transmitted into the prediction model fused with the SVM algorithm, and the prediction results can be obtained through algorithm operation and data processing. Finally, after outputting the results, the error of the results is calculated to obtain the optimal solution and optimize the algorithm model.
4 Result Analysis of BEC Prediction Based on DeST and Meteorological Data Analysis Algorithm
The database selected for this experiment is Ali Information Database, CPU is selected as 1 core, memory is selected as 16 GB, data selection frequency is 30 Hz, and 420 sets of sample data are selected. This experiment selected 420 sets of sample data, of which 320 sets were divided into training sets and 100 sets were divided into testing sets. The algorithm penalty parameter was set to 5.6569, and the radial basis function parameter was set to 2.8284. It calculated the error of the prediction algorithm model for the sample data. At the same time to select the measured data of a city, such as meteorology, surface temperature and other parameters, of which the selection range needs to take into account the climate throughout the year, selecting a more stable climate throughout the year in the region for parameter selection. The comparison between predicted values and simulated values is shown in Figure 7.
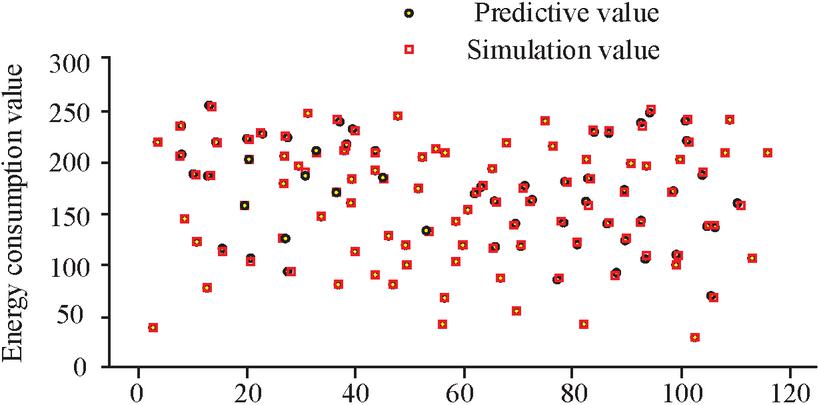
Figure 7 Comparison between predicted and simulated values.
As shown in Figure 7, when the number of samples increased, the energy consumption value of the building changed randomly as a function and was not directly related to the number of samples. This was mainly because the energy consumption of the building was mainly affected by the current temperature and humidity of the building. However, when comparing the predicted and simulated values, the energy consumption value changed significantly less when using the algorithm to predict the predicted values, and many of the predicted values that changed coincide with the simulated values. This indicated that the SVM algorithm could achieve high prediction accuracy in the processing of sample data when predicting BEC. Through images, the comparison error between the predicted and the simulated results of the sample varied between 0 and 1.3%. Comparing the simulation data obtained from the experiment with the predicted values, the results are shown in Table 1.
Table 1 Simulated and predicted value data
| Outdoor Humidity | Humidity After 1 Hour | Outdoor Temperature | Temperature After 1 Hour | Air-condition Temperature | Current Energy Consumption | Energy Consumption After 1 Hour | Predictive Value |
| 75 | 65 | -4 | -3 | 22 | 140.08 | 107.68 | 106.68 |
| 69 | 65 | -3.5 | -3.1 | 22 | 131.28 | 102.75 | 103.01 |
| 77 | 77 | -1 | 0 | 22 | 6.76 | 116.69 | 115.4 |
| 80 | 80 | 1.6 | 2.4 | 22 | 111.84 | 100.86 | 101.5 |
| 57 | 58 | 4.8 | 5.0 | 22 | 67.5 | 62.51 | 61.84 |
| 64 | 61 | 8.2 | 8.2 | 22 | 37.08 | 40.35 | 39.52 |
| 68 | 60 | 17.9 | 18 | 22 | 12.8 | 25.2 | 24.95 |
| 56 | 56 | 22.8 | 23.4 | 23 | 105.99 | 115.38 | 115.12 |
| 80 | 79 | 31.5 | 32.8 | 24 | 269.06 | 253.84 | 251.73 |
| 50 | 49 | 37.4 | 36.4 | 24 | 241.5 | 236.8 | 236.4 |
In Table 1, when predicting energy consumption at the next moment, the predicted values were compared with the true values, and the predicted values were close to the true values. When the numerical deviation was large, the difference was 2.11 kilowatts per hour. When the outdoor temperature was above 30, the overall energy consumption of the building simulation model was higher than 200 kilowatts per hour, which may be due to an increase in air conditioning energy consumption. When the outdoor temperature was below 30, the energy consumption of the simulated building was less than 200. At an outdoor temperature of 31.4, the maximum energy consumption of the simulated building was 269.06. When the outdoor temperature was 1, the minimum energy consumption of the simulated building was 6.76. After comparing the predicted and simulated values of the algorithm simulation model, it could be known the error and algorithm prediction ability of the building simulation model currently in use when dealing with BEC. However, conclusions cannot be drawn on the stability of the algorithm. Therefore, when testing the stability of the SVM algorithm, some traditional neural network algorithms are added for comparative experiments, As shown in Figure 8, Recurrent Neural Network (RNN) is a class of algorithmic models that take sequence data as input and recursively evolve in the direction of sequence,and clustering algorithm (CA) is a kind of statistical analysis algorithm, the main representative algorithm is K-means algorithm.
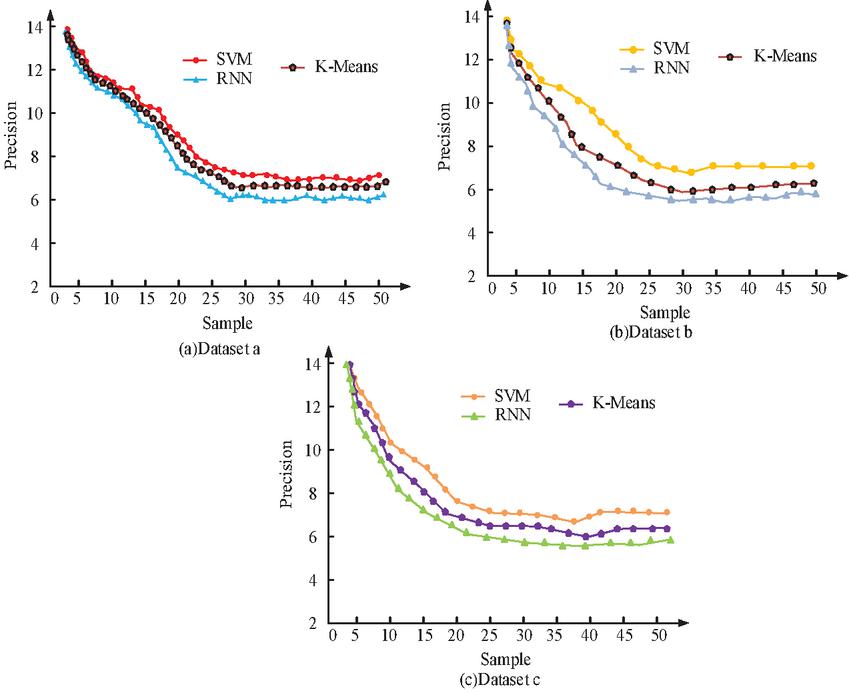
Figure 8 Comparison of precision of three algorithms under different datasets.
Figure 8 shows a comparative experiment on the precision of the SVM, RNN and K-Means algorithms under different datasets. As shown in Figure 8, when in dataset a, the precision of the SVM algorithm decreased with the increase of the number of data samples and tended to stabilize. At this point, the precision value stabilized at around 7, while the trend of the other two algorithms was the same as that of the SVM algorithm. However, the precision of the RNN algorithm was stable at around 6, and the K-Means algorithm was stable at around 6.4. The trend of changes in the other two datasets was roughly the same as that in dataset a, and there was little difference in algorithm accuracy. From this, the SVM algorithm outperformed the other two algorithms in predicting BEC in meteorological data, with high RNN algorithm 1 and high K-Means algorithm 0.6. When comparing the stability of energy consumption prediction among the three algorithms, the stability diagram of the energy consumption prediction algorithm shown in Figure 9 was obtained.
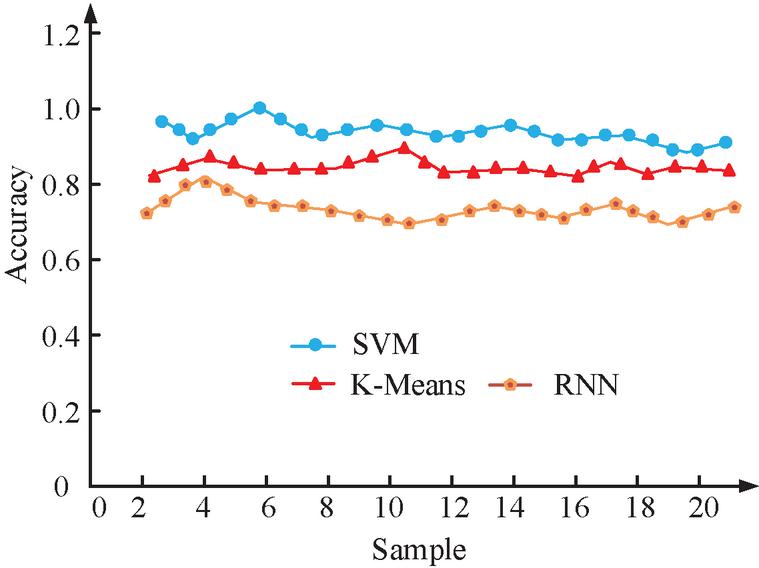
Figure 9 Comparison of the accuracy of three algorithms for predicting BEC.
In Figure 9, as the number of samples increased, the accuracy of all three algorithms fluctuated up and down as the number of samples increased. The accuracy of the algorithms presented an irregular wave curve, but the accuracy curve changed within a relatively stable range. The accuracy of the SVM algorithm varied from 0.9 to 1.0, with the highest accuracy of 0.96 when the sample size was 6. The curve variation range of the RNN algorithm was between 0.7 and 0.8, and the accuracy of the algorithm was relatively low. When the number of samples was 4, the maximum accuracy was 0.81. The accuracy of the K-Means algorithm varied between 0.8 and 0.9, with the highest accuracy of 0.89 when the sample size was 10. The accuracy of SVM was 0.15 higher than that of RNN and 0.07 higher than that of K-Means. When comparing the errors of SVM algorithm and two traditional neural network algorithms, the error variation curve shown in Figure 10 was obtained.

Figure 10 Comparison of root-mean-square error (RMSE) and average percentage error (APE) of three algorithms.
In Figure 10, when comparing the RMSE of the three algorithms, the RMSE of the SVM algorithm decreased with the increase of the iteration times. When the number of iterations was 50, 30 and 40, the minimum root mean square errors of SVM, SVM and K-Means algorithms were 0.12, 0.25 and 0.20, respectively. When comparing the APE of the three algorithms, the error value of SVM, RNN and K-Means algorithms had a minimum error of 0.2 at 20 iterations, 0.3 at 40 iterations and 0.34 at 60 iterations, respectively. The RMSE of SVM algorithm was less than 0.13 of RNN algorithm and 0.08 of K-Means algorithm. The APE was less than 0.1 for RNN algorithm and 0.14 for K-Means algorithm. The accuracy of the SVM algorithm with the training and test sets was compared, which varied with the increase of training times. The result is shown in Figure 11.
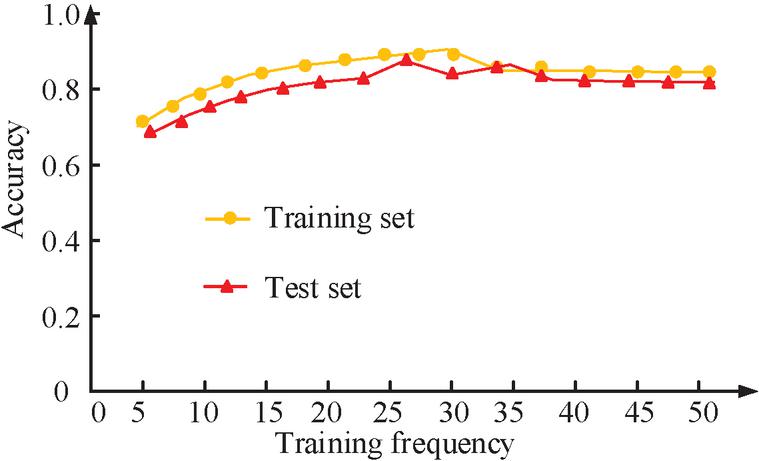
Figure 11 Comparison of accuracy between training and testing sets.
In Figure 11, as the number of training sessions in the algorithm data increased, the accuracy of the entire training set would increase with the increase of training sessions. The maximum value was 91% when the training sessions reached 30. At the peak, increasing the number of training sessions would reduce the accuracy with the increase of training tests and then stabilize. The accuracy of the test set reached its highest value of 87% when the training frequency was 25, and the test set tended to stabilize after reaching its maximum accuracy due to a decrease in accuracy due to increased training frequency.
5 Discussion
The development of the construction industry drives the development of the smart home appliance industry, and in the rapid development of the Internet of Things today, people’s lives gradually tend to intelligent development. When there are more and more buildings, how to reasonably predict the energy consumption of the building and reduce energy consumption has become an important issue, in order to promote the development of the intelligent building industry, it is necessary to study and analyze the energy saving and emission reduction and the prediction of building energy consumption. Therefore, this research addresses the building energy consumption problem and proposes a building energy consumption prediction algorithm model to solve the building energy consumption problem. As shown in Figure 7 of the analyzed results, the predicted results of building energy consumption have the same amount of change as the real results, but there are some points where there are deviations in the values. The possible reason is that in the prediction of building energy consumption, there are some differences in the data information of some samples, or the algorithm can’t completely predict the results of the results of the numerical prediction, and can only predict some data. When Table 1 was analyzed, it was found that when the temperature is higher, the building energy consumption is increased when the temperature is lower the building energy consumption is lower when the temperature is lower, which may be due to the fact that the temperature affects the use of some home appliances, which makes the building energy consumption increase or decrease. However, the degree of building energy consumption reaches its lowest value when the temperature is 1. This may be due to the fact that the current building has a better thermal insulation effectiveness, while the temperature has not reached the time when the air conditioner is open, so the energy consumption is reduced.
When analyzing Figure 8, it was found that the trend of the accuracy of all three algorithms decreased with the increase in the number of samples, probably due to the decrease in the stability of the algorithms when the number of samples increased during the operation of the algorithms. At the same time the accuracy of the three algorithms in the SVR algorithm model has the highest accuracy, may be the SVR algorithm in the processing of meteorological data in the algorithm is more stable. In the analysis of Figure 9, it is found that the three algorithms on the accuracy of the test, the change curve is fluctuating changes, which is due to the different sample data, the algorithm for the sample data processing process and processing data caused by differences. When comparing the error values of the three algorithms, the error trends of the three algorithms show interval trends, which may be due to the algorithms in the processing of the data, the changes in the sample data will have an impact on the final results and the error caused by the algorithms, and at the same time the SVR algorithm model error is smaller, which is due to the SVR algorithm’s performance is more excellent. When the test accuracy of the algorithm was studied, it was found that the accuracy of both the test and training sets of the algorithm were at a high level, which was due to the fact that the SVR algorithm was able to analyze and process the meteorological data, which resulted in a higher accuracy of the data. Therefore, in the study of meteorological data, the SVR algorithm and IoT combined to build a more accurate model and more accurate prediction of the data, which is more practical significance to reduce the energy consumption of the building to reduce carbon emissions and build a cleaner and more energy-saving building.
6 Conclusion
This study established a building environment simulation design platform based on DeST, and achieved the utilization of the IoTs and cloud platforms in the DeST platform through analysis and design. Then, the SVM algorithm was used to build a BEC prediction algorithm model in meteorological data. Finally, the SVM algorithm was applied to the simulation model of BEC, and the accuracy of the algorithm and the processing ability of BEC data were analyzed. The experiment outcomes denoted that the SVM algorithm model could maintain a prediction error of within 1.3% in predicting simulated BEC models. In comparison with traditional algorithms, prediction precision of SVM algorithm was higher than RNN and K-Means algorithms 1 and 0.6, respectively. The accuracy of SVM algorithm was 0.15 higher than RNN accuracy and 0.07 higher than K-Means accuracy. The RMSE of SVM algorithm was less than 0.13 of RNN algorithm and 0.08 of K-Means algorithm. The APE was less than 0.1 for RNN algorithm and 0.14 for K-Means algorithm. The highest accuracy rates were 91% for the training set and 87% for the test set, respectively. In summary, this study can to some extent predict BEC through meteorological data, but there are still many shortcomings. Firstly, only 420 sets of data were selected for testing in terms of data selection, and more data will be tested for algorithm models in the future. At the same time, in the study of meteorological data, only the air conditioning parameters and humidity were set, and subsequent tests will be conducted with multiple parameters changed. Finally, the research is affected by human and material resources and other factors can not analyze the real building data, so the research should also analyze the real building data when conditions allow.
References
[1] Frimpong E, Twumasi E. Prediction of unregulated energy usage in office buildings. International Journal of Building Pathology and Adaptation, 2022, 40(2): 269–282.
[2] Moghadasi M, Ozgoli H A, Farhani F. Steam consumption prediction of a gas sweetening process with methyldiethanolamine solvent using machine learning approaches. International Journal of Energy Research, 2021, 45(1): 879–893.
[3] Pandey K, Basu B, Karmakar S. An Efficient Decision-Making Approach for Short Term Indoor Room Temperature Forecasting in Smart Environment: Evidence from India. International Journal of Information Technology & Decision Making, 2021, 20(2): 733–774.
[4] Zhao Q. A short-term prediction method of building energy consumption based on gradient progressive regression tree. International Journal of Global Energy Issues, 2022, 44(3):182–197.
[5] Peng B, Zou H M, Bai P F, YY Feng. Building energy consumption prediction and energy control of large-scale shopping malls based on a noncentralized self-adaptive energy management control system. Energy Exploration & Exploitation, 2020, 39(5):1381–1393.
[6] Lei L, Chen W, Wu B, Chen Chao, Liu Wei. A building energy consumption prediction model based on rough set theory and deep learning algorithms. Energy and buildings, 2021, 240(1):2–20.
[7] Wenninger S, Kaymakci C, Wiethe C. Explainable long-term building energy consumption prediction using QLattice. Applied Energy, 2022, 308(8):3–16.
[8] Sun J, Liu G, Sun B, Xiao, Gang. Light-stacking strengthened fusion based building energy consumption prediction framework via variable weight feature selection. Applied Energy, 2021, 303(10):5–19.
[9] Chen Y, Berardi U, Zhang F. Day-ahead prediction of hourly subentry energy consumption in the building sector using pattern recognition algorithms. Energy, 2020,211(10):5–17.
[10] Luo X J, Oyedele L O. Forecasting building energy consumption: Adaptive long-short term memory neural networks driven by genetic algorithm. Advanced Engineering Informatics, 2021, 50(3):357–376.
[11] Singh M, Sharston R. A literature review of building energy simulation and computational fluid dynamics co-simulation strategies and its implications on the accuracy of energy predictions: Building Services Engineering Research & Technology, 2022, 43(1):113–138.
[12] Maltais L G, Gosselin L. Predictability analysis of domestic hot water consumption with neural networks: From single units to large residential buildings. Energy, 2021, 229(1):2–15.
[13] Jang J, Han J, Leigh S B. Prediction of heating energy consumption with operation pattern variables for non-residential buildings using LSTM networks. Energy and Buildings, 2022, 255(1):2–13.
[14] Dong Z, Liu J, Liu B, Li K, Li X. Hourly energy consumption prediction of an office building based on ensemble learning and energy consumption pattern classification. Energy and Buildings, 2021, 241(2):2–15.
[15] Fan B, Xing X. Intelligent Prediction Method of Building Energy Consumption Based on Deep Learning. Scientific programming, 2021, 21(14):2–9.
[16] Fu H, Baltazar J C, Claridge D E. Review of developments in whole-building statistical energy consumption models for commercial buildings. Renewable and Sustainable Energy Reviews, 2021, 147(9):2–10.
[17] Wang Y, Gillich A, Lu D, Saber E M, Yebiyo M, Kang R, Ford A, Hewitt M. Performance prediction and evaluation on the first balanced energy networks (BEN) part I: BEN and building internal factors. Energy, 2021, 221(15):2–24.
[18] Ma L, Huang Y, Zhao T. A synchronous prediction method for hourly energy consumption of abnormal monitoring branch based on the data-driven. Energy and buildings, 2022, 260(4):2–14.
[19] Gao L, Liu T, Cao T, Hwang Y, Radermacher R. Comparing deep learning models for multi energy vectors prediction on multiple types of building. Applied Energy, 2021, 301(1):2–25.
[20] Usman A M, Abdullah M K. An Assessment of Building Energy Consumption Characteristics Using Analytical Energy and Carbon Footprint Assessment Model. Green and Low-Carbon Economy, 2023, 1(1): 28–40.
Biographies

Chaoqin Bai graduated from Southwest Jiaotong University with a bachelor’s degree in architecture in 2004 and a master’s degree in architecture in 2007. He is currently a doctoral candidate in Earth and Human Settlement Science and Engineering at Xi’an Jiaotong University. Currently, he is an associate professor and master tutor of the Department of Architecture, College of Civil Engineering and Architecture, Henan University of Science and Technology. He is a director of the Architectural Education Branch and the Local Architecture Branch of the Architectural Society of China. He is mainly engaged in research and teaching work in architectural design and theory, architectural history and cultural heritage protection, building energy conservation and sustainable development, building information technology and digital design.

Junrui Liu graduated from Southwest Jiaotong University with a Master’s degree in Architecture in 2009 and Tongji University with a Doctor’s degree in architecture in 2021. Currently, he is a lecturer of the Department of Architecture, College of Civil Engineering and Architecture, Henan University of Science and Technology. He is mainly engaged in research and teaching work in architectural history and theory, conservation of architectural heritage and sustainable development.
Strategic Planning for Energy and the Environment, Vol. 43_2, 357–380.
doi: 10.13052/spee1048-5236.4328
© 2024 River Publishers