Deep Thermal Power Peak Shaving Compensation Considering Operating Costs and Electricity Revenue
Yiqun Meng1,*, Guoliang Bian1, Yi Gu2, Chuang Liu1, Bo Hu3, Guiping Zhou2, Huanhuan Luo4, Yuanzhu Zhao5, Yiming Chang5 and Zhonghui Wang3
1Northeast Electric power University, 169 Changchun Road, Jilin, China
2State Grid Liaoning Electric Power Co., Ltd, Shenyang, China
3State Grid Liaoning Electric Power Co., Ltd. Dalian Power Supply Company, Shenyang, China
4Liaoning Power Trading Center Co., Ltd, Shenyang, China
5State Grid Liaoning Electric Power Co., LTD. Shenyang Power Supply Company, Shenyang, China
E-mail: karlsson.meng@outlook.com
*Corresponding Author
Received 08 August 2023; Accepted 06 September 2023
Abstract
Unlike traditional methods of electricity generation such as thermal power, renewable energy sources like wind power exhibit characteristics of randomness and volatility, leading to unstable power generation. With the continuous increase in grid-connected capacity of renewable energy sources like wind power, the demand for grid peak shaving is on the rise, highlighting the issue of inadequate peak shaving capacity in China’s power system. As a primary source for peak shaving in the country, thermal power units incur significant revenue losses when participating in deep peak shaving, and under the current mechanism, they cannot obtain sufficient compensation for deep peak shaving. In response to these issues, the paper proposes a method for compensating thermal power units for deep peak shaving. Firstly, considering the reduced efficiency of thermal power units during low-load operation, a cost model for the operation of thermal power units is established. Secondly, building upon the existing compensated peak shaving baseline, a method for compensating thermal power units for deep peak shaving is introduced. Finally, using a simulation of a local power grid in Liaoning Province as an example, an analysis of the compensation for thermal power peak shaving and overall profits under the existing mechanism and the proposed mechanism is conducted. The results obtained validate the rationality and effectiveness of the method proposed in the paper, offering insights for the development of a compensation mechanism for thermal power deep peak shaving.
Keywords: Deep peak shaving, thermal power units, operation costs, compensation method.
1 Introduction
To reach the target of carbon neutrality, China vigorously develops renewable energy power generation [1]. A prominent source of renewable energy is wind power, and it has gradually grown the installed capacity previous decades [2]. By the end of April 2022, China’s capacity installation of power generation had reached 2.41 billion kilowatts, with wind power generation accounting for 340 million kilowatts, a 17.7% growth year on year. Due to its unpredictability and seasonality, large-scale access to the dependable and steady functioning of the power grid is challenged by wind power [3]. The exponential rise of wind power and other renewable energy sources has resulted in an increased demand for flexible power sources within the system. This demand is expected to continue to grow. Thermal power is the primary flexible regulating power supply in China and is responsible for the majority of peak shaving [4]. As of the end of April 2022, thermal power installed capacity had been 1.3 billion kilowatts in China. Thermal power makes room for renewable energy generation and participates more in system regulation, resulting in a decrease in its annual utilization hours [5]. And when thermal power operates at low load, its coal consumption increases and energy efficiency decreases [6].
To encourage extensive peak shaving in thermal energy units, the operation rules of the electricity ancillary services market have been sequentially piloted in several areas of China [7]. In Northeast China, for example, the Northeast Electricity Ancillary Services Market was officially launched on January 1, 2017, and was revised and improved in 2019 and 2020. Up to now, It has made significant contributions to increasing the usage of renewable energy in power production and decreasing peak trimming strain [8]. However, As the installed capacity for the production of electricity from renewable sources keeps increasing, the renewable energy market is expected to grow, the existing peak-shaving correction mechanism’s deficiencies have progressively come to light, and Northeast Power faces issues including a lack of peak trimming resources and significant losses in thermal power enterprises [9]. On October 28, 2021, the Northeast China Energy Regulatory Bureau of National Energy Administration revised and issued Notice on Temporary Adjustment of the Operation Rules of the Northeast Electricity Ancillary Services Market during the Period of Guaranteeing Power Supply and Heating Supply [10], enhancing deep peak pruning recompense by increasing the upper limit of quotation intervals and the standard for paid peak regulation. However, the thermal power still cannot obtain sufficient peak regulation compensation. How to devise a reasonable compensation mechanism for peak regulation auxiliary services is a pressing concern for the power system at present.
Numerous studies have been conducted on the thermal power plant peak reduction service. Gu et al. [11] discussed the issues that arise, such as high energy-consumption, when extensive peak shaving is performed using coal-fired power plants. Van den Bergh and Delarue [12]. The limitations and costs of traditional power plant cycling were calculated, and the scheduling impact of different cycle settings was examined. Brouwer and co [13] offered a consistent dataset of power plant flexibility metrics and examined thermal power plant operational flexibility and economics in low-carbon energy networks. Brouwer et al. [14] evaluated how intermittent renewable energy sources affect present-day power networks and their thermal generators to better understand their effects on low-carbon power systems and how to simulate them. Hu et al. [15] Analysed the impact of the peak-regulation market pilot regulations on thermal and wind power and offered methods and strategies to improve the ancillary services market mechanism for renewable energy integration into the northeastern power grid. Troy and Twohig [16] presented that by allowing wind to contribute to the demand for spinning reserve, The decreased need for thermal power facilities to maintain a reserve enables them to operate at higher outputs, thereby increasing their efficiency and decreasing the overall system’s costs. Fan et al. [17] Presented the wind power plant and thermal power unit’s cooperative participation in the power market to increase their profit margins. Yin and Duan [18] presented a deep peak-regulation service pricing system that employs market actors’ substitution impact to measure coal-fired power stations’ value. Jian et al. [19] to accomplish benefit redistribution among participants, a new method for deep peak trimming based on Kaldor enhancement was proposed. Zhao et al. [20] a criterion was proposed for the classification of paid and unpaid peak reduction for various categories of thermal energy units, and developed a compensation model that accounts for the capacity of thermal power units to reduce peaks. The research listed above offer theoretical justification for boosting thermal power units’ peak-shaving incentive and optimising their peak-shaving potential, however the economic analysis of thermal power units is inadequate.
In this research, a thermal power unit operation cost model is established and then proposes a deep peak-shaving compensation and cost allocation method that takes into account thermal power plant operating costs and electricity revenue, resulting in a significant increase in peak-shaving compensation and Deep peak reduction makes thermal power facilities significantly less profitable.
This essay is structured as follows: Section 2 provides the paper’s fundamental structure. On the basis of Section 3’s thermal power unit operating cost model, the deep peak-shaving compensation and cost allocation model is established. Section 4 presents Liaoning Province local power grid simulation findings. The findings of this investigation are summarised in Section 5.
2 Framework
During operation, thermal power plants incur significant expenses. And low thermal power unit output reduces efficiency and increases the cost of generating one unit of energy. Taking into account the cost of coal consumption, the cost to the environment, and the cost of wear and tear, this paper establishes the operating cost model for thermal power units and calculates the additional costs of thermal power units in the deep peak shaving phase.
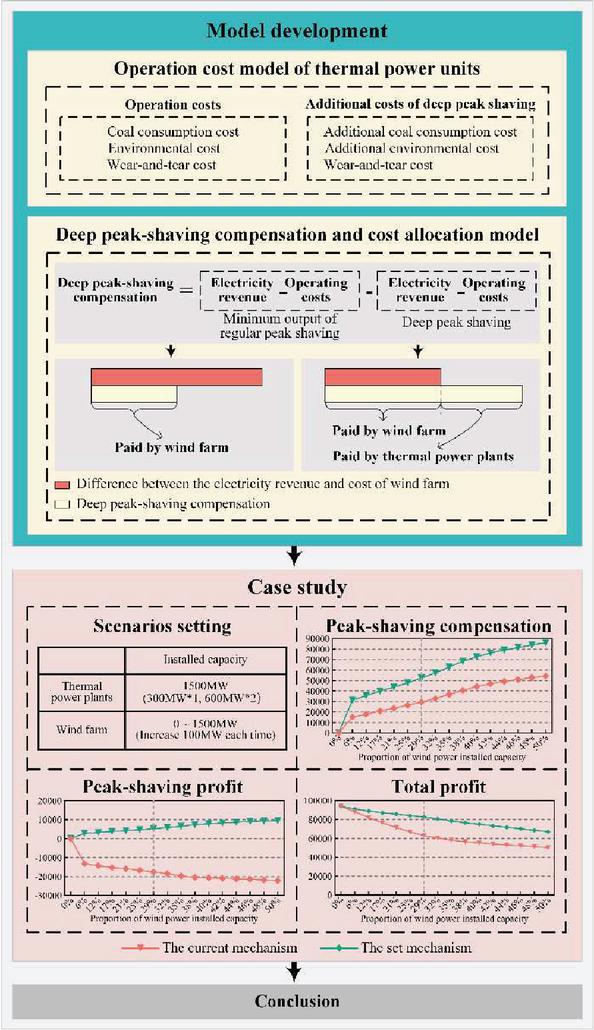
Figure 1 Framework.
In order to foster the use of wind energy, thermal power provides wind energy with auxiliary services. Thermal power that participates in severe peak reduction will incur significant revenue losses. Although the operation costs will also be lower, the reduction in operating costs will be significantly less than the decrease in electricity revenue. Thermal power cannot earn sufficient peak-shaving compensation under the current method, resulting in a lower profit than if It did not engage in extensive peak trimming. The assumption used in this study to calculate the minimum peak-shaving compensation for thermal power plants is that the total profit of thermal power plants that engage in deep peak shaving won’t fall below the total profit when operating at the minimum power output during the regular peak shaving phase. In addition, wind energy is required to pay compensation for peak shaving before thermal power facilities. The portion that cannot be covered by wind power is the responsibility of thermal power facilities.
Comparing the peak-shaving compensation, peak-shaving profit, and total profit of thermal power plants under the current mechanism and the set mechanism when the installed capacity of wind power increases from 0% to 50% demonstrates that the peak-shaving compensation and cost allocation method proposed in this paper is reasonable and effective.
3 Methodology
3.1 Thermopower Operation Cost Model
Thermal power peak shaving has two stages: normal and deep. Figure 2 shows two steps of deep peak shaving.
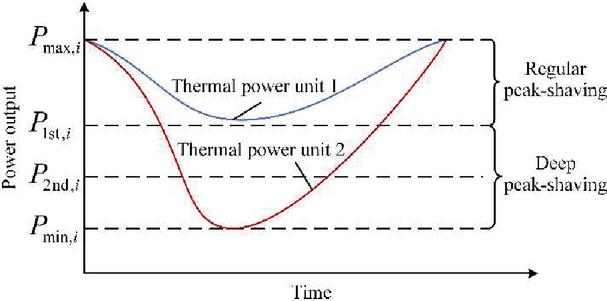
Figure 2 Power plant peak regulation schematic.
where is the maximum amount of electricity that a thermal power unit can produce; is the absolute lowest amount of electricity that the regular peak shaving stage; and are deep peak shaving’s first and second stages’ minimal power outputs.
Regular peak shaving is something that the thermal power unit takes part in when its power output is somewhere in the range of Pmax,i to P1st,i. When the power output of the unit is between P1st,i and P2nd,i, the device is in the first stage of the deep peak shaving process. As soon as the power output drops below P2nd,I, the gadget begins the second step of its deep peak shaving process.
When a thermal power unit takes part in peak shaving on a regular basis, its principal operating expenses are the consumption of coal and the costs associated with the environment. When a thermal power plant is running in deep peak shaving, the majority of the costs associated with running the plant are those related to coal consumption, the environment, and general wear and tear.
During the deep peak shaving stage of the thermal power plant’s operation, the power output of the plant is decreasing, which results in an increase in the rate at which coal is used. During the second stage of deep peak shaving, the power generation will continue to reduce, which will cause the efficiency of the equipment used for desulfurization, denitrification, and dust removal to continue to decline [21]. Even though thermal power plants produce the same amount of energy during the deep peak shaving stage as they do during the standard peak shaving stage, the deep peak shaving stage results in a greater cost of coal use as well as an increased impact on the environment. Although thermal power plants produce the same amount of energy during the deep peak shaving stage as they do during the standard peak shaving stage. These additional costs are referred to as the additional cost of peak shaving to the environment and the additional cost of peak shaving connected with the consumption of additional coal. Both of these types of additional costs are associated with peak shaving. These two additional fees, in addition to the costs connected with wear and tear, are included in the sum total of the additional costs that are incurred as a result of peak shaving.
The cost of coal consumption will be greatly decreased when thermal power units participate in deep peak shaving as opposed to when they operate in the regular peak shaving stage. This is in comparison to when they operate in the regular peak shaving stage. On the other hand, the additional expenses of peak shaving will greatly increase, but the amount of revenue gained from electricity will significantly fall. This is because peak shaving will reduce the quantity of energy used during peak demand.
| Conventional Peak Shaving | Deep Peak Shaving | |
| Cost | Coal Consumption Environmental Loss |
Coal Consumption Additional Coal Consumption Environmental Additional Environmental Loss Additional Loss |
The procedure for determining how much it costs to operate a thermal power unit is as follows:
3.1.1 Coal consumption cost
Coal usage is the biggest cost for thermal power plants during peak shaving. Thermal power plants’ running costs will rise during heavy peak shaving, although coal consumption will still be a major price. Formula (1) shows how to calculate thermal power unit i’s coal consumption over time.
| (1) |
Where is the thermal power plant ’s coal consumption during period ; cost of coal consumption for thermal power plant during period ; is the thermal power output of unit at time ; , , are the coefficients of the thermal power unit ’s consumption characteristic function; is the unit coal price in the current season.
When the demand fluctuates, there is not much of an impact on the rate of coal consumption that is used to generate thermal power during the period of peak shaving known as “regular peak shaving.” Nevertheless, when the load is reduced during the deep peak shaving period of peak shaving, the coal consumption rate experiences a considerable increase, leading to a conclusion that [22]. Thermal power that is running in the deep peak shaving stage will result in an increase in the amount of coal that is consumed, which will lead to an increase in the cost of generating the same amount of energy as when operating at the minimal output of the standard peak shaving stage. The cost of peak shaving, which corresponds to this higher cost of coal use, can be determined as follows:.
| (2) |
Where is the coal usage of thermal power plant during period when operating at the lower limit of the regular peak shaving stage and generating the same amount of electricity as in deep peak shaving stage; is deep peaking during period costing thermal power unit more coal than it would have consumed otherwise?.
3.1.2 Environmental cost
China officially implemented the “Environmental Protection Tax Law” on January 1, 2018. This was China’s first dedicated law for taxing pollution emissions. The purpose of this law is to enhance environmental protection, reduce pollution, and promote sustainable, green development. Coal-fired power plants, due to their extensive use of fossil fuels and emissions of significant greenhouse gases and other pollutants, have become one of the primary subjects of taxation under the environmental protection tax.
The collection of emission taxes is based on the quantity of major pollutants emitted, such as sulfur dioxide, nitrogen oxides, particulate matter, and others. The specific tax rates depend on regional policies and the types and quantities of pollutants. The “Environmental Protection Tax Law” sets tax rate ranges for various types of pollutants, and each province, autonomous region, and municipality directly under the central government can determine the specific tax rates within this range based on their local circumstances.
| (3) |
Where is the type of pollutant emitted; is the unit taxable amount of the pollutant ; is the pollution equivalent of the pollutant ; is the emission of pollutant during period .
The emissions of SO, NO and soot are calculated as follows.
| (4) |
Where is the thermal power plant ’s SO emission during period ; is the sulfur content of the coal-fired receiving base; is the rate of conversion of coal-fired sulfur to flue gas sulfur; is the molar mass ratio of SO to S; is the desulfurization efficiency of the desulfurization equipment.
| (5) |
Where is the NO emissions from thermal plant unit during period ; is the nitrogen content of the coal-fired receiving base; is the rate at which coal-fired nitrogen is converted to flue gas nitrogen; is the molar mass ratio of NO to N; is the denitrification efficiency of the denitrification equipment; is the ratio of NO generated from fuel nitrogen to the total NO emissions.
| (6) |
Where is the thermal power unit I’s periodical soot emission; is the ash content of the coal; is the percentage of fly ash carried out in the flue gas; is the percentage of combustible matter in the soot; is the dust removal efficiency of the dust removal equipment.
When the load is decreased, there is a quick increase in the rate of coal consumption for the deep peak shaving stage of the thermal power plant. In addition, during the second phase of deep peak shaving, the low production of thermal power will cause desulfurization equipment, denitrification equipment, and dust removal equipment to function less effectively than they did during the first phase. When it comes to thermal power, the environmental cost of unit electricity generation while participating in deep peak shaving is greater than that of standard peak shaving for the reasons that have been discussed previously.
When thermal power contributes to peak reduction at great depths, in Formulas (4)(6) is replaced by , and the calculation results are plugged into Equation (3) to determine the environmental cost generated by the thermal power unit during period while operating at the minimum power output of the regular peak reduction stage. The thermal power plant’s additional environmental cost is the disparity between its environmental cost and its previous environmental cost and , as shown in Formula (7).
| (7) |
Where represents the extra environmental cost that thermal power unit paid for taking part in deep peak shaving during the time period .
3.1.3 Wear-and-tear cost
Thermal power units that frequently engage in prolonged deep peak shaving will experience excessive alternating stress on the rotor, which will accelerate rotor life loss and increase the cost of wear-and-tear [23]. Formula (8) is used to calculate the cost of thermal power’s wear and tear.
| (8) |
Where is the actual thermal power operating loss coefficient and the second stage of deep peak reduction has a higher actual operating loss coefficient than the first stage; is the cost to acquire thermal power unit ; represents the amount of rotor fracture cycles, and the expression is .
In conclusion, the operational costs of thermal power units include coal consumption costs, environmental costs, and wear-and-tear costs. Deep peak reduction of thermal power incurs additional costs associated with coal consumption, the environment, and wear and tear. The thermal power operating costs and additional costs are computed according to Formula (9).
| (9) |
Where: is the operating expense of thermal power unit for period , denotes the additional costs incurred by thermal power unit during period as a result of its participation in deep peak shaving.
3.2 Deep Peak-shaving Compensation and Cost Allocation Model
3.2.1 Current mechanism deep peak-shaving compensation and cost allocation
(1) Deep thermal power peak-shaving correction model
Table 1 shows the thermal power paid peak-shaving benchmark under the deep peak-shaving compensation method.
Table 1 Current method thermal power plant peak shaving benchmark
| Period | Thermal Power Facility Type | Paid Peak Trimming Benchmark |
| Non-heating | Pure condensing | Load rate 50% |
| Cogeneration | Load rate 48% | |
| Heating | Pure condensing | Load rate 48% |
| Cogeneration | Load rate 50% |
The “ladder” style of quoting is used for real-time deep peak shaving trading, and a price mechanism is utilised. The Northeast Electricity Ancillary Services Market Operating Rules divides deep peak shaving transaction into two quotation intervals and sets the corresponding quotation upper limit and quotation lower limit. The peak-shaving compensation is calculated by taking into account the market clearing price for each quote interval in addition to the amount that was paid for peak shaving during that interval.
| (10) |
where represents the peak-shaving compensation provided by thermal power plant during time in accordance with the existing system; represents the amount of peak shaving accomplished by thermal power plant in quote interval j throughout the course of time period ; is the compensation price for peak shaving of thermal power plants in the quote period according to the current system; is the factor of correction, which during the heating phase is 1 and during the non-heating interval it is 0.5.
(2) Peak-shaving cost allocation model
The existing system requires thermal power plants and wind farms that don’t engage in deep peak shaving to pay compensation for deep peak shaving. In order to enhance the allocation proportionally, the thermal power facilities that are a part of the cost allocation have been separated into three classifications depending on the real load rate. This was done in order to boost the allocation. The revised power generation ratio will be used to determine the level of participation of wind farms in the cost allocation. The formula to use in the computation is as follows.
| (11) |
where and represent the cost allocations for peak shaving that thermal power plant and wind farms had to make during period , respectively; under the current mechanism; represents the quantity of thermal power facilities; and represent the revised power output of thermal power plant and wind farms during period , respectively [24].
In summary, the mathematical formulas for thermal power’s peak-shaving profit and wind power’s overall profit are as follows.
| (12) |
Where and represent, respectively, the total profits made by thermal power plants and wind farms during period ; denotes the peak-shaving profit of thermal power plant over time ; and represent, respectively, the electricity revenues from wind farms and thermal power plant over the time .
3.2.2 Deep peak-shaving compensation and cost allocation model under the set mechanism
The peak-shaving compensation price is determined at a specified interval by the existing system. In addition, under the framework that is now in place, peak-shaving compensation prices are paid out to thermal power units of varying installed capacities in exactly the same manner. Because of these concerns, thermal power plants are less likely to provide auxiliary services that lower peak demand. As a means of addressing the problems described above, the findings of this study present a model of a peak-shaving compensation mechanism that takes into account both the operational cost and the electrical advantage of using thermal power.
(1) Deep thermal power peak-shaving correction model
Thermal power participating in deep peak trimming reduces power generation significantly. Although there will be a reduction in operational expenses as well, this reduction will be far less significant than the loss of money generated from the sale of energy, which will lead to a fall in the overall profit generated by thermal power. The minimum power output of the regular peak shaving stage functions as the threshold for an increase in the operating costs per unit of thermally generated energy. The minimum peak-shaving compensation price for thermal power is based on the paid peak-shaving benchmark under the current mechanism and the principle that thermal power participating in deep peak shaving will not incur a loss in profit relative to thermal power operating at the minimum power output of the regular peak shaving stage.
| (13) |
Where and represent, respectively, the thermal power plant ’s power production and peak-shaving quantity during time ; is the on-grid electricity price of thermal power; is the peak-shaving compensation price of thermal power plant during period under the set mechanism; and are the power generation and operating costs of thermal power plant during period while the deep peak shaving step is operating at its lowest power output.
Under the set mechanism, the following is the minimum peak-shaving compensation price for thermal power plant during period .
| (14) |
According to the established system, thermal power stations receive the following peak-shaving compensation..
| (15) |
Where is the peak-shaving compensation of thermal power plant during period under the set mechanism; represents all of the thermal power plants’ peak-shaving compensation during period .
(2) Peak-shaving cost allocation model
The proportion of installed capacity that is comprised of wind energy is growing. In order to guarantee that wind power is given priority, thermal power companies are willing to give up a percentage of their revenues in order to provide peak shaving auxiliary services to wind farms. As a result, the findings of this article demonstrate that wind energy will receive preferential treatment for the payment of peak-shaving compensation. If the amount of compensation for peak shaving is lower than the gap between the amount of money made from selling energy and the cost of wind power, then wind power is required to pay for peak shaving. If the peak-shaving compensation is more than the difference between the cost of wind energy and the revenue from selling electricity, the shortfall is covered by thermal power.
The cost of wind energy is primarily comprised of construction and fundamental operation and maintenance expenses. The precise phrase is as follows [25].
| (16) |
Where is the average annual cost of the wind farms, which is the sum of construction and fundamental operation and maintenance costs; construction cost per unit of wind energy capacity; is the wind farms’ combined installed capacity; is the bank interest rate; is the wind turbine’s lifespan; is the equipment’s corresponding yearly coefficient; The cost of operation and upkeep per unit of wind energy capacity is known as .
The peak-shaving cost allocation is wholly carried by wind power when its compensation is less than the difference between the electricity revenue and the cost of wind power; in this case, thermal power is not required to contribute to the peak-shaving cost allocation. In the following form, peak-shaving compensation provided by wind energy is expressed:.
| (17) |
where: is the cost allocation for wind farms to reduce peak demand during period t according to the defined method.
The difference between the wind farms’ electricity revenue and cost is the peak-shaving compensation that the wind farms are required to pay. The thermal power plants are responsible for the balance when the peak-shaving compensation is greater than the difference between the wind farms’ revenue and cost of electricity. This element of peak-shaving compensation can be compensated for by thermal power facilities using either of two different approaches. If any thermal power plants decide not to participate in deep peak shaving, then those thermal power plants will be responsible for contributing to this portion of the compensation in proportion to the amount of electricity that they produce. On the other hand, if all thermal power plants participate in deep peak shaving, then those thermal power plants will be responsible for contributing to this portion of the compensation in proportion to the amount of electricity that they produce. This is how the phrase should be read:
| (18) |
Where: is the cost allocation for peak-shaving performed by the thermal power plant that is participating in the cost allocation; is the value of averaged to each time period.
Replacing , , in Formula (15) with , , can get the thermal power plant ’s overall earnings and wind farms and the peak-shaving profit of thermal power plant under the set mechanism during period .
4 Case Study
A local power system in Liaoning Province is utilized here as the simulation object for the purposes of this work. The duration of the simulation is one year, with each day being broken up into 96 intervals of fifteen minutes. The profits of thermal power plants and wind farms under the current mechanism and the proposed mechanism are compared to demonstrate the validity of the proposed peak-shaving compensation and cost allocation method. This is done under the assumption that the installed capacity of thermal power plants and the load level remain unchanged and that the installed capacity of wind farms gradually increases.
A societal requirement is to give preference to the use of greener, renewable energy sources within the context of a specific capacity for the grid. This article aims for the least amount of abandoned wind and the lowest total coal consumption of the system while calculating the power output of wind farms and thermal power plants under various scenarios of installed wind power capacity ratios.
4.1 Parameters Setting for Case Study
For the purposes of this study, we will assume that the demand will remain same, the total installed capacity of thermal power plants will be 1,500 MW, and the total installed capacity of wind farms will gradually expand. The relevant parameters are presented down here for your perusal.
4.2 Parameters Setting for Thermal Power
The entire distributed power of 1500 MW is contributed to by three thermal power plants, each of which has a capacity of 300 MW, two of which have a capacity of 600 MW, and one of which has a capacity of 600 MW. Only pure condensing thermal power units are covered in this article’s discussion.
This image shows 300 MW and 600 MW thermal power reactors that may peak-shave. The units’ minimum load rate is 50% during regular peak shaving, 40% during first deep peak shaving, and 30% during second deep peak shaving.
The thermal energy cost on the grid is 0.3749 yuan per kilowatt-hour. The price per ton of coal is 800 yuan. The actual operational loss coefficient during the first and second phases of deep peak reduction is 1.2 and 1.5, respectively. Table 2 displays the unit taxable quantity and pollution equivalent for the pollutants SO, NO, and particulates.
Table 2 Thermal power plant air pollutants
| Unit Taxable Amount | Pollution | |
| Pollutants | (Yuan/Pollution Equivalent) | Equivalent (kg) |
| SO | 2.4 | 0.95 |
| NO | 2.4 | 0.95 |
| Soot | 1.2 | 2.18 |
According to the current mechanism, the price of the peak-shaving compensation is determined by using the highest point of each quote range to determine the price for In-depth peak-shaving trades. In accordance with the established mechanism, the peak-shaving compensation for thermal plants is computed based on the minimum price for peak-shaving compensation.
4.2.1 Parameters setting for wind power
The wind farms’ total installed capacity is steadily raised from 0 MW to 1500 MW, each time by 100 MW. The construction cost per unit capacity is 6900 Yuan/kW, while the operating and upkeep expenses cost per unit capacity is 300 Yuan/kW/year, with a 25-year lifespan. operating and upkeep expenses of wind power is 0.3749 Yuan/kWh.
When wind farms have an installed capacity of 600 MW, the fraction of installed capacity is 29%, and the power produced by wind can be utilized in its entirety. When wind farms exceed 700 MW of installed capacity, the proportion of wind farms’ installed capacity increases to 32%. As a result of the production of certain thermal power units having hit rock bottom and being unable to be decreased any more, wind power has been abandoned.
4.2.2 Simulation data
This research simulates the wind power forecast curve and load power prediction curve of a local power system in Liaoning Province for a given year, updating the wind power prediction curve proportionally as wind power capacity rises. Figure 3 shows a typical wind power forecast curve and load power prediction curve for 500 MW wind farms.
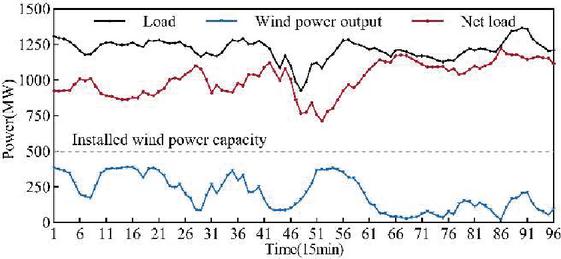
Figure 3 Daily load and wind power projection for 500 MW wind power.
4.3 Peak-shaving Compensation and Peak-shaving Cost Allocation
On the basis of the model that was presented in this work, it is possible to calculate the minimal peak-shaving compensation price for each moment of thermal power. In this analysis, a typical day is utilized in which there is 500 MW of installed capacity for wind generation.
The mechanism outlined in this study calls for the minimum peak-shaving compensation price for thermal power plants to fluctuate according to the amount of power that these plants generate. Figure 4 depicts the minimum peak-shaving compensation price that the thermal power station with an installed capacity of 300 MW must pay on an average day.
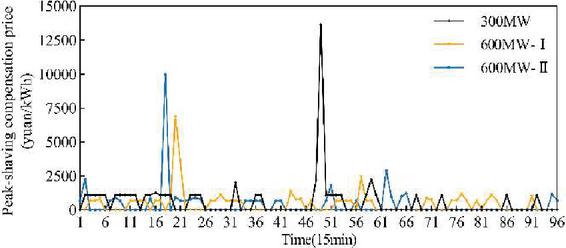
Figure 4 Typical daily minimum peak-shaving compensation price for thermal power plants under the set mechanism.
In accordance with the predetermined method, the customary daily peak-shaving quantity and peak-shaving compensation for a 300 MW thermal power plant are depicted in Figure 5. The thermal power plant is eligible for a higher degree of peak-shaving compensation whenever the plant is able to reduce its peak demand by a bigger amount. It should be noted that the changing trend of peak-shaving compensation with peak-shaving quantity is likewise the same in thermal power plants that have an installed capacity of 600 MW.
As a result of the fact that the set mechanism uses the minimum peak-shaving compensation price to calculate the peak-shaving compensation, the peak-shaving compensation is calculated as follows: the peak-shaving compensation is equal to the operating costs plus the electricity revenue of thermal power plants when they operate at the minimum output of the regular peak shaving stage, minus the sum of the operating costs and the electricity revenue when they participate in deep peak shaving, and the quotient of the peak-shaving compensation an. As a direct consequence of this, the peak-shaving quantity and the minimal peak-shaving compensation rate display contrasting patterns of variation.

Figure 5 Peak-shaving compensation and amount of thermal power plant with installed capacity of 300 MW under the set mechanism.
Tables 3 and 4 depict thermal power plant peak-shaving compensation and cost allocation on a typical day under the current and set mechanisms.
Table 3 Peak-shaving compensation and cost allocation under the current mechanism
| Peak-shaving | Peak-shaving Cost | |
| Thermal Power | Compensation (10 Yuan) | Allocation (10 Yuan) |
| 300 MW | 17.58 | 11.02 |
| 600 MW-I | 36.62 | 20.63 |
| 600 MW-II | 20.31 | 33.47 |
Table 4 Peak-shaving compensation and cost allocation under the set mechanism
| Peak-shaving | Peak-shaving Cost | |
| Thermal Power | Compensation (10 Yuan) | Allocation (10 Yuan) |
| 300 MW | 54.68 | 9.25 |
| 600 MW-I | 73.35 | 20.33 |
| 600 MW-II | 44.67 | 30.17 |
As shown in Tables 3 and 4, peak-shaving compensation for thermal power facilities under the set mechanism increases substantially on a typical day, and the proportion of peak-shaving cost allocation in peak-shaving compensation decreases. Under the existing mechanism, thermal power plants obtained a total of 745,100 yuan in peak-shaving compensation on the typical day. Thermal power plants, however, were required to pay a total of 87.40% of the peak-shaving compensation since some of them chose not to engage in deep peak-shaving at specific periods. Under the set mechanism, thermal power plants received 981,900 yuan more in peak-shaving compensation on the typical day, and thermal power plants needed to pay 34.60% of the peak-shaving compensation, which is a lower percentage than under the existing system.
As the installed capacity of wind farms continues to increase, Figure 6 presents an illustration of the annual peak-shaving compensation that will be provided to thermal power plants by the two compensation mechanisms. As shown in Figure 6, the peak-shaving compensation that thermal power plants are eligible for under the proposed approach is greater than what they are eligible for under the current mechanism. In addition, the gap between the two peak-shaving compensatory systems widens as the capacity of wind farms grows.
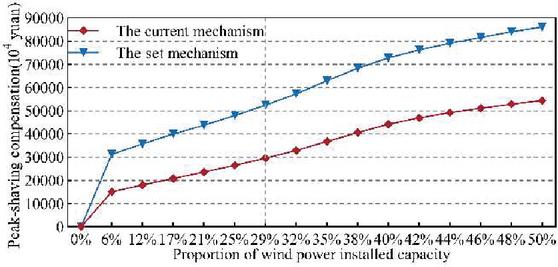
Figure 6 Thermal power plant annual peak-shaving compensation.
4.4 Peak-shaving Profit and Total Profit
Additional costs related to coal consumption, the environment, and general wear and tear are incurred while a thermal power plant is operating in its deep peak-shaving stage of operation. Peak-shaving profitability for thermal power facilities are determined by peak-shaving compensation as well as any additional costs associated with peak-shaving. The overall yearly peak-shaving profit of thermal power plants is depicted in Figure 7. This profit increases as the installed capacity of wind power does as well.
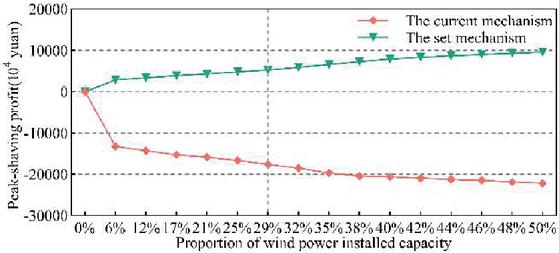
Figure 7 Annual profit for thermal power facilities from peak reduction.
Under the current method, peak shaving compensation is modest, and peak shaving profits are negative and decline as the percentage of installed wind power capacity increases. This is because peak shaving reduces the amount of energy that is needed to meet peak demand. Thermal power plants are able to obtain enough compensation for peak shaving under the framework that has been established, and the peak-shaving profit is positive and grows as the share of installed wind generating capacity increases.
Figure 8 depicts the average daily peak-shaving amount and peak-shaving profit of a 300 MW fixed-capacity thermal power facility.
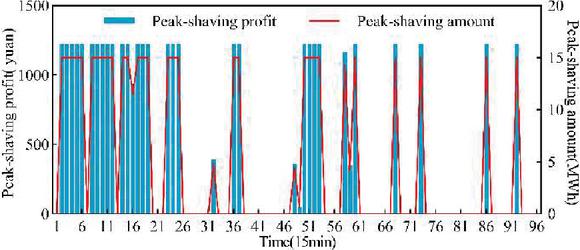
Figure 8 Peak-shaving profit and quantity of 300 MW thermal power plant under defined procedure.
The 300 MW thermal power plant demonstrates that peak-shaving profits for thermal power plants are positive under the established method, and that peak-shaving profits increase with peak-shaving amounts.
A thermal power plant’s total profit consists of electricity revenue, peak-shaving compensation, peak-shaving cost allocation, and operating expenses. The annual profit is depicted in Figures 9 and 10.
The current system connects the peak-shaving compensation, the on-grid electricity of thermal and wind power, and the price of wind power to the peak-shaving cost allocation for thermal power plants. This was done in order to encourage the use of wind power. According to this research, the price of on-grid electricity generated by a combination of wind and thermal sources comes to 0.3749 yuan per kilowatt-hour. Figures 9 and 10 show the total profit made by thermal power plants under the current and fixed procedures, respectively. Even if the established method results in an increase in the peak-shaving cost allocation for thermal power plants, the gap between peak-shaving compensation and cost allocation is always larger than it is when using the process that is now in place.
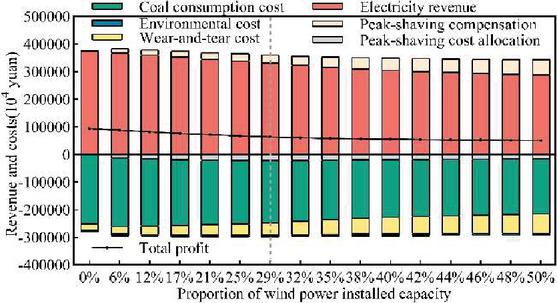
Figure 9 Profits generated annually by thermal power facilities under the current system.
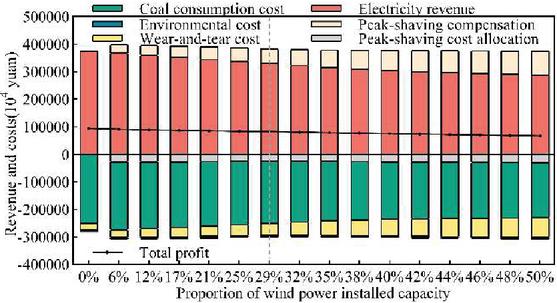
Figure 10 Profits generated annually by thermal power facilities under the set mechanism.
There is no difference in the total annual profit made by thermal power plants employing either approach when the capacity of installed wind turbines is equal to zero percent. According to the current system, there is a large decline in the aggregate profit made by thermal power plants whenever there is an increase in the capacity of wind power that has been added. The annual profit of thermal power facilities drops by 46.59 percent for every percentage point that the share of installed wind producing capacity increases from 0% to 50%. According to the technique that has been stated, there will be a significant rise in the overall profit made by thermal power plants when compared to the system that is currently in place whenever there is a greater proportion of installed wind generating capacity. In comparison to the existing system, the aggregate yearly profit of thermal power plants will increase by 33.5% when 50 percent of the capacity of wind farms is put into operation.
Figure 11 depicts the variation in the annual total profit of wind farms as the installed capacity ratio ratio increases under the two mechanisms. Under the set mechanism, the peak-shaving cost allocation of wind farms increases, but it can still ensure that the total profit rises as the installed capacity percentage rises.
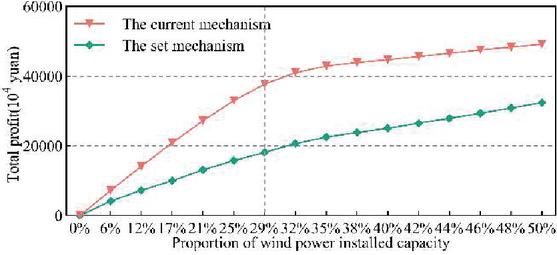
Figure 11 Total annual profit of wind farms.
The preceding study reveals that the peak-shaving compensation approach presented in this work may effectively boost thermal power plant peak-shaving compensation and compensate thermal power plants for the higher expenses incurred as a result of deep peak-shaving. It can also ensure that the total profit of wind farms continues to grow as installed capacity increases.
5 Conclusion
This research addresses the issue of inadequate deep peak-shaving compensation for thermal power plants using the method that is currently in use by providing a model of deep peak-shaving compensation and a cost distribution mechanism that takes into consideration both operational expenses and revenue from the sale of electricity. The following are the most significant takeaways from this study.
(1) This study makes a recommendation for a model of deep peak-shaving compensation and cost allocation that is based on the paid peak-shaving benchmark that is used by the existing system. This model takes into account the increased costs and income loss that thermal power facilities experience as a direct result of a dramatic fall in peak demand. In addition to this, it determines the minimum price of peak-shaving compensation that is required to make up for the loss of thermal power plants that are participating in deep peak shaving. This makes it possible for peak-shaving compensation to be greatly enhanced in comparison to the system that is currently in place.
(2) In the case study that this article uses as an illustration, the profit that thermal power plants make from peak shaving under the current system is negative and decreases as the capacity of wind generators grows. The peak-shaving profit of thermal power facilities is positive according to the methodology that has been created, and this profit continues to climb as the installed capacity of wind power increases.
(3) When compared to the system that is now in place, the proposed solution results in a large improvement in the overall profit of thermal power plants. And even while wind farms are required to pay a higher compensation for peak shaving in accordance with the standard procedure, their overall profit rises as their installed capacity increases.
This paper proposes a change to the peak-shaving compensation price that, when applied to the existing mechanism of paid and unpaid peak shaving, will result in an increase in the peak-shaving profit made by thermal power facilities. On the other hand, neither the responsiveness of the supply side nor additional resources for flexibility control, such as energy storage, are taken into account. These concerns are going to be looked into further in the future.
Acknowledgements
This research is supported by the National Key R&D Program of China (2019YFB1505400).
References
[1] N. Ding, J. Duan, S. Xue, M. Zeng, J. Shen. Overall review of peaking power in China: status quo, barriers and solutions. Renew. Sustain. Energy Rev., 42 (2015), pp. 503–516.
[2] S. Yin, S. Zhang, P. Andrews-Speed, W. Li. Economic and environmental effects of peak regulation using coal-fired power for the priority dispatch of wind power in China. J. Clean. Prod., 162 (2017), pp. 361–370.
[3] T.A. Deetjen, J.D. Rhodes, M.E. Webber. The impacts of wind and solar on grid flexibility requirements in the Electric Reliability Council of Texas. Energy, 123 (2017), pp. 637–654.
[4] Y. Meng, Y. Cao, J. Li, C. Liu, J. Li, Q. Wang, et al. The real cost of deep peak shaving for renewable energy accommodation in coal-fired power plants: Calculation framework and case study in China. J. Clean. Prod., 367 (2022), p. 132913.
[5] P. Eser, A. Singh, N. Chokani, R.S. Abhari. Effect of increased renewables generation on operation of thermal power plants. Appl. Energy, 164 (2016), pp. 723–732.
[6] R. Turconi, C. O’Dwyer, D. Flynn, T. Astrup. Emissions from cycling of thermal power plants in electricity systems with high penetration of wind power: life cycle assessment for Ireland. Appl. Energy, 131 (2014), pp. 1–8.
[7] J. Liu, Q. Wang, Z. Song, F. Fang. Bottlenecks and countermeasures of high-penetration renewable energy development in China. Engineering, 7 (2021), pp. 1611–1622.
[8] X. Zhao, S. Zhang, Y. Zu, J. Yao. To what extent does wind power deployment affect vested interests? A case study of the Northeast China grid. Energy Pol., 63 (2013), pp. 814–822.
[9] J. Li, Y. Chen, S. Liu, X. Zhang, Z. Ma. Mechanism design of day-ahead market considering deep peak regulation. Automation of Electric Power Systems, 43 (2019), pp. 9–15+78.
[10] National Energy Administration. Northeast China Energy Regulatory Bureau of National Energy Administration uses auxiliary services market mechanism to stimulate the improvement of power supply and heat supply capacity. (2021). http://www.nea.gov.cn/2021-11/02/c\_1310286049.htm.
[11] Y. Gu, J. Xu, D. Chen, Z. Wang, Q. Li. Overall review of peak shaving for coal-fired power units in China. Renew. Sustain. Energy Rev., 54 (2016), pp. 723–731.
[12] K. Van Den Bergh, E. Delarue. Cycling of conventional power plants: Technical limits and actual costs. Energy Convers. Manag., 97 (2015), pp. 70–77.
[13] A.S. Brouwer, M. van den Broek, A. Seebregts, A. Faaij. Operational flexibility and economics of power plants in future low-carbon power systems. Appl. Energy, 156 (2015), pp. 107–128.
[14] A.S. Brouwer, M. van den Broek, A. Seebregts, A. Faaij. Impacts of large-scale intermittent renewable energy sources on electricity systems, and how these can be modeled. Renew. Sustain. Energy Rev., 33 (2014), pp. 443–466.
[15] J. Hu, Q. Yan, F. Kahrl, X. Liu, P. Wang, J. Lin. Evaluating the ancillary services market for large-scale renewable energy integration in China’s northeastern power grid. Util. Pol., 69 (2021), p. 101179.
[16] N. Troy, S. Twohig. Wind as a price-maker and ancillary services provider in competitive electricity markets. IEEE PES General Meeting (2010), pp. 1–6.
[17] W. Fan, L. Huang, B. Cong, Z. Tan, T. Xing. Research on an optimization model for wind power and thermal power participating in two-level power market transactions. Int. J. Electr. Power Energy Syst., 134 (2022), p. 107423.
[18] G. Yin, M. Duan. Pricing the deep peak regulation service of coal-fired power plants to promote renewable energy integration. Appl. Energy, 321 (2022), p. 119391.
[19] X. Jian, L. Zhang, L. Yang, X. Han, M. Wang. Deep-peak regulation mechanism based on Kaldor improvement under high-penetration wind power. Automation of Electric Power Systems, 42 (2018), pp. 110–118.
[20] X. Zhao, M. Wang, Y. Zhao, Q. Wu. A model of compensation mechanism on peak-regulating ancillary services based on capacity variance across thermal power units. Automation of Electric Power Systems, 37 (2013), pp. 57–61.
[21] Y. Zhang, C. Luo, Y. Lu, Y. Zhang, C. Zhou. Technology development and cost analysis of multiple pollutant abatement for ultra-low emission coal-fired power plants in China. J. Environ. Sci., 123 (2023), pp. 270–280.
[22] T. Simla, W. Stanek. Influence of the wind energy sector on thermal power plants in the Polish energy system. Renew. Energy, 161 (2020), pp. 928–938.
[23] J. Wang, S. Zhang, J. Huo, Y. Zhou, L. Li, T. Han. Dispatch optimization of thermal power unit flexibility transformation under the deep peak shaving demand based on invasive weed optimization. J. Clean. Prod., 315 (2021), p. 128047.
[24] Northeast China Energy Regulatory Bureau of National Energy Administration. Notice on the Issuance of the Operating Rules of the Northeast Electricity Auxiliary Services Market. (2020). http://dbj.nea.gov.cn/zwfw/zcfg/202012/t20201223\_4055300.html.
[25] Y. Chang, Z. Liu, S. Huang, W. Liu, S. Wang. Coordinated planning and profit distribution of wind power, thermal power and grid based on mixed game theory. Power System Technology, 43(2019), pp. 3899–3907.
Biographies

Yiqun Meng, male, from Changchun City, Jilin Province, holds a master’s degree in Electrical Engineering from the University of Sydney. He is currently a doctoral candidate at Northeast Electric Power University, undertaking a joint training program at the University of California, San Diego from January 2023 to December 2023. His research focuses on electricity markets and low-carbon optimization operation of power systems.

Guoliang Bian, male, from Linyi City, Shandong Province, is currently a master’s degree candidate in Electrical Engineering at Northeast Electric Power University. His research focuses on electricity markets and low-carbon optimization operation of power systems.

Yi Gu, male, from Anqing City, Anhui Province, obtained a master’s degree in Power System and Automation from Tsinghua University in 2000. He is a senior engineer and currently serves as the Chief Engineer at State Grid Liaoning Electric Power Co., Ltd. His main research interests include planning, preliminary work, and investment in primary distribution networks.

Chuang Liu, male, born in 1985, holds a Ph.D. degree and is a professor. He is a doctoral/master’s supervisor and has been selected as an outstanding young scientific and technological talent in China’s power industry, as well as various other honors and awards. He is currently affiliated with Northeast Electric Power University.

Bo Hu, Ph.D., senior engineer, obtained his bachelor’s, master’s, and Ph.D. degrees from North China Electric Power University, the Shenyang Institute of Automation, Chinese Academy of Sciences in 1995, 2001, and 2013 respectively. He currently holds the position of Secretary and Deputy General Manager at State Grid Liaoning Electric Power Co., Ltd., Dalian Power Supply Company. His main research direction is power systems and their automation.
Guiping Zhou, Ph.D., senior engineer, obtained his bachelor’s, master’s, and Ph.D. degrees from Dalian University of Technology and the Shenyang Institute of Automation, Chinese Academy of Sciences in 2004, 2007, and 2012 respectively. He currently holds the position of Deputy Section Chief at State Grid Liaoning Electric Power Co., Ltd. His main research direction is power systems and their automation.

Huanhuan Luo, male, graduated from Shanghai Jiao Tong University with a bachelor’s degree in Power System and its Automation in 2001. He obtained a master’s degree in Electrical Engineering from Dalian University of Technology in 2009 and a Ph.D. degree in Electrical Engineering from Shenyang University of Technology in 2022. He is currently employed at Liaoning Electric Power Trading Center Co., Ltd. His main research direction is power system operation and power market trading.

Yuanzhu Zhao, female, obtained a master’s degree in Journalism and Communication in 2019. She currently works at State Grid Liaoning Electric Power Co., Ltd., Shenyang Yuhong District Power Supply Branch. Her main research direction is power market marketing.

Yiming Chang, female, holds a master’s degree in Power System and its Automation. She currently works at State Grid Liaoning Electric Power Co., Ltd., Shenyang Power Supply Company. Her main research direction is power market marketing.

Zhonghui Wang, male, obtained a master’s degree in Power System and its Automation from Dalian University of Technology in 2011. He currently works at State Grid Liaoning Electric Power Co., Ltd., Power Dispatch and Control Center. His main research direction is the construction of the electricity spot market and ancillary services market, as well as grid regulation and operation.
Strategic Planning for Energy and the Environment, Vol. 43_3, 609–640.
doi: 10.13052/spee1048-5236.4336
© 2024 River Publishers