Application of Digital Economy Machine Learning Algorithm for Predicting Carbon Trading Prices Under Carbon Reduction Trends
Yisheng Liu1 and Fang Xu2,*
1School of International Business, Zhejiang Yuexiu University, Shaoxing 312000, China
2Center for International Education, Philippine Christian University, Manila 9990005, Philippine
E-mail: xufang1234w@163.com
*Corresponding Author
Received 20 September 2023; Accepted 08 November 2023; Publication 09 January 2024
Abstract
Due to the increasing demand for fossil fuels, excessive emissions of greenhouse gases such as CO have been caused. With the intensification of global climate anomalies and warming, how to reduce greenhouse gas emissions is an important issue currently facing the international community. The influencing factors of carbon price are complex, and accurate prediction of carbon price is a difficult problem. There are still some problems in the existing carbon trading price prediction models, such as insufficient understanding of the enormous potential of machine learning models to ilift the performance. The study will use two machine learning models that can address the shortcomings of traditional artificial intelligence models as the basic prediction models. The specific content includes machine learning prediction models that extend to extreme learning machine theory and fuzzy inference system theory. By integrating data preprocessing algorithms, artificial intelligence optimization algorithms, feature selection algorithms, etc., this study constructs and applies a carbon trading price prediction model from multiple perspectives to compensate for the shortcomings in current research. The corresponding values for each indicator in the algorithm are 5.6214E-12 (maximum), 2.8546E-12 (minimum), 4.0239E-12 (mean), and 5.4402E-13 (variance). Compared with other comparative optimization algorithms, this indicates that the hybrid optimization algorithm is an efficient optimization method for the model, which can effectively optimize different problems. In theory, the proposed multiple improved carbon trading price prediction models can theoretically compensate for the shortcomings in existing carbon trading price predictions.
Keywords: Fuzzy reasoning, carbon trading, machine learning model, digital economy, price Forecast.
1 Introduction
Carbon trade is an important means of addressing climate change and reducing emissions, and has become a hot topic of global attention [1–3]. The fluctuation of carbon prices is a key factor affecting the healthy and stable operation of the carbon trading market (CTM). Effective prediction can not only better understand the changes in carbon prices in various regions, but also provide scientific and effective decision-making references for relevant departments and investors, thereby promoting the healthy operation of China’s carbon prices and reducing carbon emissions [3–5]. The CTM, as an essential tool for mitigating climate change, its price fluctuations will have a significant impact on its normal development [6, 7]. Therefore, in the current research on the CTM, the urgent problem to be solved is that the existing carbon trading price prediction models (CT-PPM) do not fully recognize the enormous potential of machine learning models (MLM) to improve prediction performance. In existing carbon price prediction models, the definition of carbon prices has high uncertainty, and due to the influence of institutional design and government regulatory adjustments, there are high moral risks and regulatory costs. In addition, due to the characteristics of the carbon trading market as a financial market and the wide range of market participants, it is likely to generate financial systemic risk issues. To further study the CT-PPM, this paper constructs an efficient prediction model to accurately forecast the tendancy of carbon trading prices (CTP). By utilizing machine learning algorithms to analyze and learn historical carbon price data, a more accurate and reliable prediction model can be established to predict future carbon prices, thereby reducing the uncertainty of carbon prices. At the same time, machine learning algorithms can be used to predict market trends and identify potential financial risks, thereby helping investors better manage risks and avoid the occurrence of financial systemic problems. This study is mainly divided into four parts. The first part provides an overview of the research background and summarizes the research in related fields. The second part elaborates on the specific methods for constructing a CT-PPM. In the third part, the performance of the MLM for CTPP is experimentally verified, and the prediction results of the designed model based on hybrid optimization algorithm (HOA) are compared with those of other single models. The final part summarizes and prospects the entire study.
2 Related Works
In the current context of reducing carbon emissions, carbon trading has become an important method for addressing climate change and energy conservation and emission reduction. Many scholars have studied and developed CT-PPMs from various directions. Liu Z et al. established a carbon option trading model built on GARCH and fractional Brownian motion, expecting to give a reference for upcoming carbon option market trading. The GARCH can compensate for the shortcomings of tne fixed FBM volatility. This study selected the daily closing price of European Energy Exchange option contracts as a price prediction sample, which could greater fit the price in fact [8]. Chen Z et al. established a model to describe the environmental effectiveness of emission trading schemes. Under the benchmark rules, the effectiveness has been effectively improved by introducing price discrimination. They added content to the environmental effectiveness theory by formulating a framework that allows for price discrimination and allocation rules for various emission permits [9]. Wang L et al. proposed a multi-objective extended plan for park level integrated energy systems that considers the fluctuation of CETP. It filtered and downscaled the influencing factors of CETP, and applied the kernel limit learning machine grounded on the improved multi-objective grey wolf algorithm optimizer to the probability interval forecast of CETP. They analyzed the operating characteristics of each device and proposed a calculation model for carbon trading costs. The simulation effect of the model was verified through European carbon trading data, and a comparative analysis was conducted on the planning schemes [10]. Qi C et al. used directional distance function and stochastic frontier analysis methods to estimate the marginal CO emission reduction cost of 92 coal-fired generators from 27 power plants in Shanghai, a pilot city for carbon emission trading in China. Market prices have a significant impact on trading activities within the carbon emissions trading market, and the conclusion drawn is that for the high carbon and high CO coal-fired power generation industry, the current market prices are unreasonable [11]. Luo Y et al. used the AIM/Enduse to analyze the changes in installed capacity, power supply, energy usage, and CO emissions under different CEA auction ratios and price combinations. The results indicate that an appropriate mechanism can benifit the economy of the power sector [12].
This study selected machine learning algorithms for CTPP, and machine learning algorithms have also been widely applied in many fields beyond this. Li M Q et al. proposed a new dynamic defense method called DyAdDefender, demonstrating that a dynamic defense method can utilize previous experience to defend against blackbox attacks. Numerous experiments have shown that DyAdvDefender outperforms existing static ways in defense effectiveness, while maintaining the original classification accuracy with limited additional time [13]. Brari Z et al. proposed a new machine learning framework using derivative determination and chaotic injection to reconstruct a new version of the studied EEG signal. Secondly, they proposed a new way for fractal analysis taking Higuchi Fractal Dimension (HFD), which achieved 100% accuracy in diverse classification scenarios utilizing a simple linear classifier [14]. Wang Y et al. constructed a MLM to calculate the predicted emotional perception tendencies of human populations, and thus proposed a dual channel neural network model. The subjects were invited to perform emotional recognition on aria segments to establish a multi classification standard dataset of differences in subject emotional recognition. This model clusters participants based on the predicted values of emotional perception tendencies in the sample test group, and then compares the clustering results. Its neural network accurately predicted the emotional perception tendencies of classification groups with three attributes of subjects [15]. Azzone M et al. used the random forest method to predict the life insurance contract invalidation decision of policyholders. This method is superior to the logical model and found that non economic features play a significant role in determining failure decisions [16]. Salunkhe V G et al. proposed a fault diagnosis and support vector machine (SVM) based on mathematical models using advanced strategies for early detection and analysis of tapered rolling bearings. It uses matrix method and SVM for dimensional analysis to establish a mathematical model that can be used to predict the vibration characteristics of rotor bearing systems. This model uses electric discharge machining to generate and analyze defect types, and establishes correlations between relevant and independent parameters to experimentally evaluate the rotor dynamics characteristics of healthy and unhealthy bearings. The experimental results verified the correctness of the DAMM and SVM models [17].
In summary, MLMs have a wide range of applications, and many scholars have conducted research and development on CT-PPMs. In the current research on the CTM, the enormous potential of MLMs to improve the prediction performance of CTP is not fully recognized in the existing CT-PPMs. Therefore, this study chooses to use MLMs to optimize the CT-PPM, which has unique innovation.
3 Construction of a CT-PPM Based on Digital Economy Machine Learning Algorithm
Feature Selection Algorithms (FSA) can effectively screen out the best input variables with strong correlation with prediction variables, and are an essential part of machine learning based prediction models [18]. Therefore, conducting in-depth theoretical and applied research on it has important theoretical and practical significance. This study constructs a CT-PPM based on multi-objective optimization (MOO) and constructs a machine learning price prediction model based on Fuzzy Inference System Theory (FIST).
3.1 Construction of a CT-PPM Based on 2S-FS and MOO
Due to global climate change issues and the rapid development of carbon trading markets, research has chosen to conduct research on predicting carbon trading prices. And accurate carbon trading price prediction can help governments and enterprises formulate reasonable carbon pricing policies to promote carbon reduction and economic development, so it is important in the context of reducing greenhouse gas emissions. Most previous CT-PPMs did not take into account the influencing factors of selecting appropriate input features, and only focused on improving prediction accuracy, neglecting the importance of prediction stability. This study proposes a hybrid model built on two-stage feature selection (2S-FS) and MOO algorithm. It mainly consists of 4 steps: data preprocessing, MOO, feature selection, and prediction. The study intends to use the ICEEMDAN signal decomposition method to decompose the carbon futures price series into multiple IMF and residual components, in order to reduce the impact of these factors on prediction accuracy. On this basis, the complexity of CTP is measured using the SE method, and multiple sub sequences with similar entropy are fused into one sequence to obtain the restructured carbon trading price. Among them, n is the number of reorganized subsequences, which can provide the optimal input for the model and improve its predictive ability. A FSA based on PACF and Relief two-step methods was proposed to obtain the optimal input variable. Firstly, using the PACF model, identify the main factors that affect carbon trading pricing; Using the Relief algorithm to further choose all possible and the optimal input variables for each subsequence are obtained. On this basis, the MOGOA-WRELM is used to forecast each subsequence separately, and the results of each subsequence are provided; Then add the predicted values of each subsequence to obtain the final predicted value. Figure 1 shows the process of the CTPP model for 2S-FS and MOO.
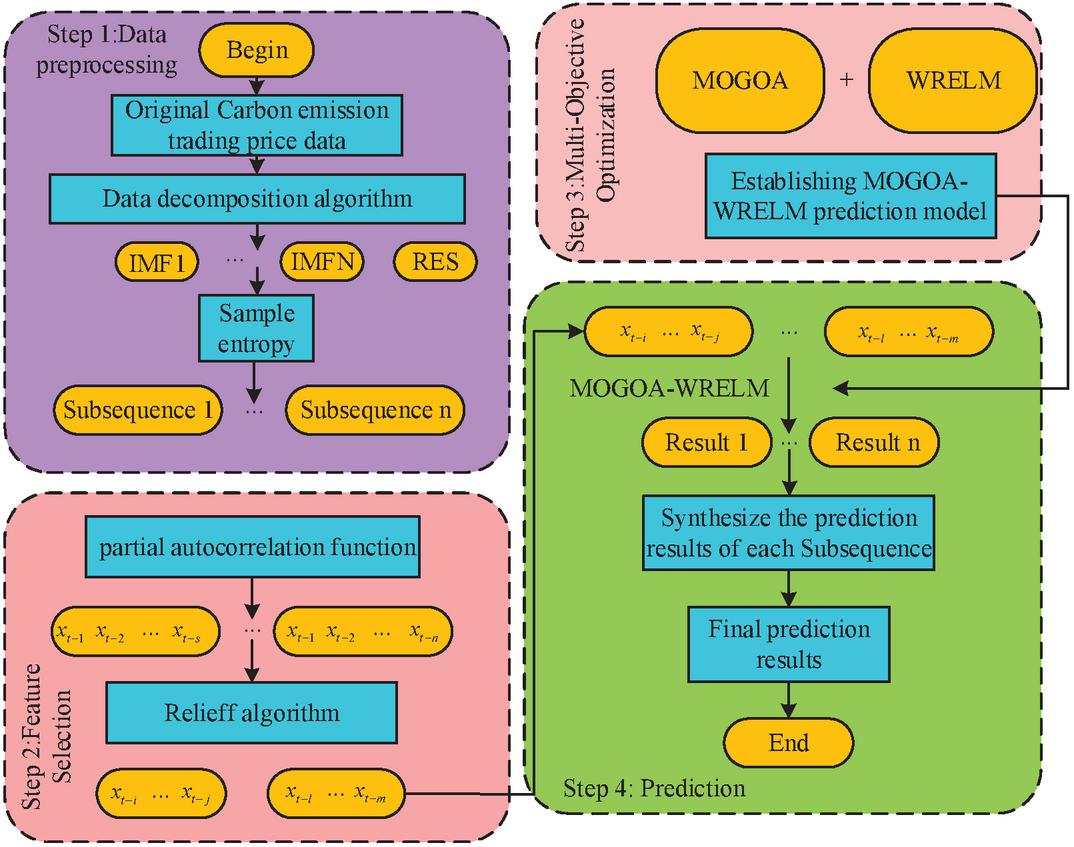
Figure 1 Process of Carbon emission trading price measurement model based on 2S-FS and MOO.
With the development of science and technology and the deepening of problem research, a large number of FSAs have been proposed and widely applied in different research fields [19]. Due to the constraints of data size, quality, type, and time, corresponding FSAs can be selected for research based on the quantity and quality of the data. To enhance the effectiveness of feature selection in CTPP, a two-step FSA based on PACF method and Relief algorithm was proposed. It first determines the possible input features in the prediction model through PACF, and then selects an input variable from the possible input features through ReliefFFSA to gain the optimum input variable. The expression of the -order autoregressive model is formula (1).
| (1) |
In formula (1), is the -th regression coefficient in the -order regression formula. is a function of the lag period . is a partial autocorrelation function. The Relief algorithm based on statistical methods measures the discriminability of features based on distance distance, and measures the classification and recognition ability of features through weight values. is the amount of features in the dataset, and is the quantity of randomly selected samples. The weight update formula for attribute is formula (2).
| (2) |
In formula (2), and are the nearest neighbor sample points of sample in the same category and different categories. The definition of the function for continuous attributes is formula (3).
| (3) |
In formula (3), and are the min and max values of . The definition of the function for discrete attributes is formula (4).
| (4) |
The weight update formula of the ReliefF algorithm is Equation (3.1).
| (5) |
In formula (3.1), is the category corresponding to sample , is the proportion of class , and the expression for is formula (6).
| (6) |
In formula (6), is the number of C class samples in set . is the amount of all samples in set . The randomness of initial values in WRELM has a significant impact on its prediction performance. Therefore, MOGOA is used to optimize the initial value of WRELM to obtain a model with high precision prediction ability and stable predictability, namely the MOGOA WRELM model. The application of this model first involves initializing the relevant parameters of the MOGOA algorithm and WRELM model. To achieve high stability and prediction accuracy, the objective function of the MOGOA was subsequently determined. The two functions of the MOGOA are shown in formula (7).
| (7) |
In formula (7), and are the objective functions, means the length of the data sequence. and represent the observed and predicted values. The termination condition of the algorithm has been determined and optimization has been initiated; Based on the objective function, update the buffer position and execute a loop; In the WRELM model, terminate optimization and obtain the optimal parameters. Carbon trading mechanisms include international emission trading mechanisms, joint compliance mechanisms, and clean development mechanisms [20, 21]. In addition, voluntary emission reduction mechanisms have emerged in developing countries, and Figure 2 is a schematic diagram of the carbon trading mechanism.

Figure 2 Schematic diagram of Carbon emission trading mechanism.
In Figure 2, the current carbon trading mechanisms mainly include IET mechanism, JI mechanism, and CDM mechanism. In addition, the main participants of the Voluntary Emission Reduction Mechanism (VER) are individuals or enterprises who have a willingness to voluntarily reduce emissions. They can obtain corresponding independent emission reduction indicators by developing emission reduction projects. Figure 3 shows the VER mechanism.
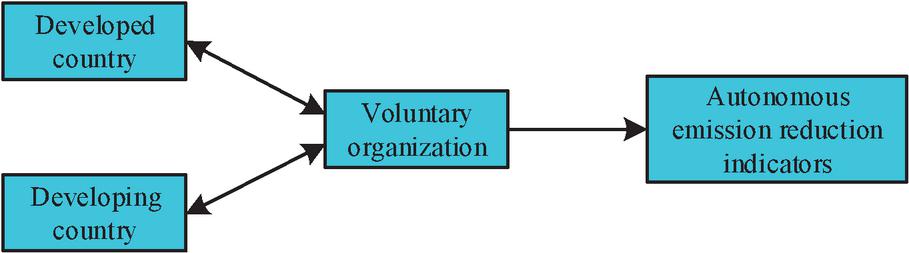
Figure 3 Schematic diagram of voluntary emission reduction mechanism.
Currently, there is no unified understanding of the classification of CTMs in China, which can be divided according to different standards. Figure 4 shows a detailed classification.
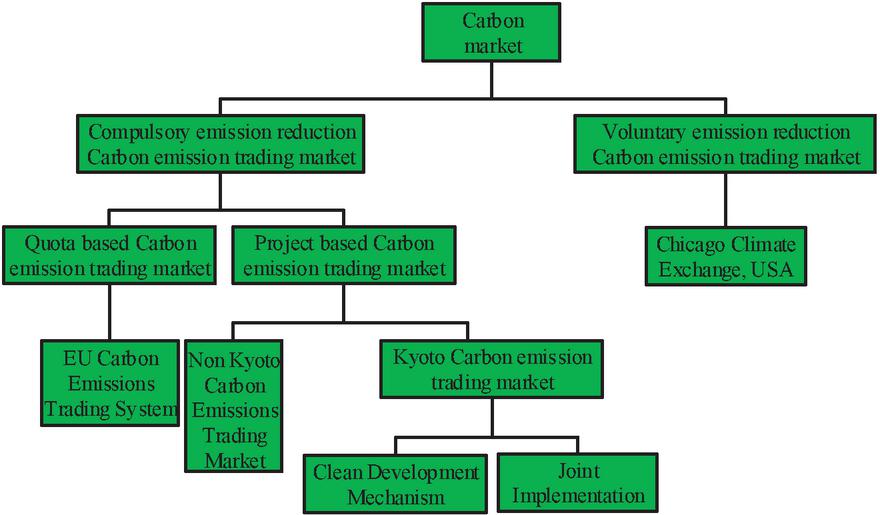
Figure 4 Classification of trading markets.
The price formation mechanisms of different carbon trading markets may vary, and these different mechanisms may have different impacts on carbon trading prices. Therefore, it is necessary to adjust and optimize the model according to the situation of different markets. Carbon trading markets in different regions may also have different policy environments and market conditions, which may have an impact on carbon trading prices. Therefore, it is necessary to consider these factors in the model to more accurately predict carbon trading prices in different regions. Different types of prediction models also have different applicability, and the machine learning based model proposed in this study is more suitable for predicting the long-term trend of carbon trading prices.
3.2 Machine Learning Prediction Model Extended to FIST
Extreme learning machine theory and fuzzy inference system theory have strong complementarity. Extreme learning machine theory has the advantages of fast training and simple parameter adjustment, but sometimes important nonlinear features may be overlooked. The theory of fuzzy inference systems can handle uncertainty and imprecise information, but the training time is long and parameter adjustment is complex. Combining these two models can fully utilize their advantages and achieve more accurate and efficient predictions. Fuzzy Reasoning System (FRS) is a type of uncertain reasoning with the capacity of processing fuzzy information. Using fuzzy logic theory as the main computational tool, complex nonlinear mapping relationships can be achieved. FRS is not only widely used in fields such as pattern recognition, expert systems, and automatic control, but also achieves good fitting results in function modeling and nonlinear regression problems. Figure 5 shows the structure of FRS.

Figure 5 The Framework of FRS.
In Figure 5, is the input vector, which can be fuzzy or precise; After reasoning, a fuzzy output is obtained, and after de fuzzification, an accurate output is obtained, denoted as . In addition, ‘ is ’ is a precursor of an ambiguous rule, which defines an ambiguous region in the input space. ‘ is ’ is the later part of the fuzzy rule, which defines the output within the fuzzy range. The commonly used FRS models in research are Mamdani, Sugeno, and Tsukamoto fuzzy models. Mamdani performs deblurring, which is a necessary condition for converting the fuzzy variables output by the model into accurate values. The most widely used deblurring method among them is the area center method, whose calculation expression is formula (8).
| (8) |
In formula (8), is the output membership function. The conditions that the area bisection method should meet are shown in Equation (9).
| (9) |
In formula (9), the expression of is formula (10).
| (10) |
The expression of is formula (11).
| (11) |
The maximum average method is the average value of that causes the membership function to reach its maximum value, that is, when , the membership function of a fuzzy set reaches its maximum value, and its expression is formula (12).
| (12) |
In formula (12), the expression for is formula (13).
| (13) |
Sugeno is the most commonly used method in sample based fuzzy modeling, with precise input and output values that do not require deblurring operations. The fuzzy rules are shown in formula (14).
| (14) |
is the polynomial of the input variable, and when is a constant, the result is Sugeno of zero order. When it is a first-order polynomial, the first-order Sugen is obtained, and the exact function of its regular consequent is formula (15).
| (15) |
In Tsukamoto, the aftermath of each fuzzy rule is described by a fuzzy set with monotonic membership, avoiding the tedious process of defuzzification. The study proposed a CT-PPM consisting of an analysis module and a prediction module, and Figure 6 shows the corresponding flowchart of the model.
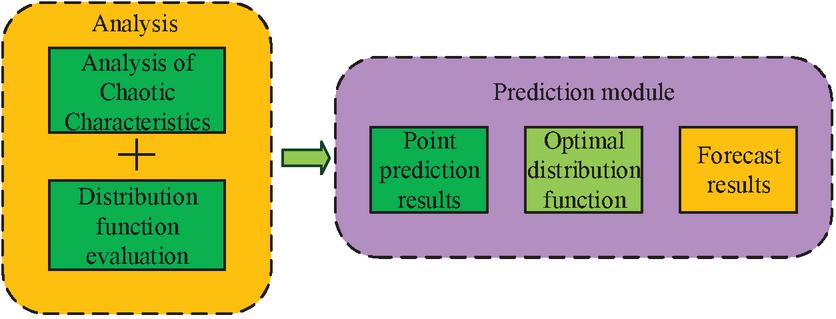
Figure 6 CT-PPM based on Chaos theory and HOA.
Figure 6 includes the analysis and prediction module. The prediction module includes two parts: point prediction and interval prediction. The study used VMD data preprocessing technology to decompose carbon valence data into multiple pattern components called VMs. In the integration process of data preprocessing algorithms, artificial intelligence optimization algorithms, and feature selection algorithms, boosting technology is mainly used to fuse the prediction results of multiple models to obtain a more accurate and reliable prediction result. The main idea of boosting technology is to change the probability distribution of the training dataset and call weak classification algorithms for different probability distributions for learning. In each round of learning, a new basic classifier is added to the set and given a weight. The weight is determined based on the performance of the classifier. If the performance of the classifier is good, a larger weight is assigned, and if not, a smaller weight is assigned. In this way, the importance of classifiers will be adjusted in subsequent learning, allowing high-performance classifiers to play a greater role in the final classification results. Among them, s is the number of pattern components, which can reduce the complexity of carbon price sequences and improve the accuracy. Considering the inherent chaotic nature of the CTM, the optimization input and output characteristics of the carbon emissions trading market were established using the PSR method; Using the HBOASCA algorithm to train the neural network, a HBOASCA-ANFIS network was constructed, and the predicted values of each modal component were added to obtain the final predicted value; Finally, combine the predicted results of each point with the optimal distribution function of each point to obtain the predicted values of each point.
4 CT-PPM Simulation Experiment and Result Analysis
To test the predictive models of 2S-FS and MOO, the research focuses on the ideas of sample selection and experimental design. The samples and data mainly focus on the selection of research samples and the characteristics of CTP.
4.1 CT-PPM Experimental Analysis of MOO
In response to the nonlinear and non-stationary characteristics of carbon price data, the research selects data content from the “2022 Carbon Emission Trading Report” and “2022 Carbon Market Analysis Report” published by the Carbon Trading Industry Association, and selects data published by authoritative institutions to better ensure the reliability of data sources and reduce the risk of data errors and distortions, such as government agencies, carbon trading markets, industry associations, etc. The ICEEMDAN data preprocessing method is used to denoise it and achieve accurate prediction of carbon price time series. Using ICEEMDAN to analyze the carbon emission trading prices in Shenzhen, data from 8 IMF and 1 residual were obtained. If each subsequence is divided into independent subsequences, it will greatly increase the computational time. The study adopts a SE-based way to conduct statistical analysis on each IMF sequence and residual sequence, and fuses sub sequences with similar SE values as new sub sequence research objects, effectively shortening the model running time and reducing prediction costs. Figure 7 shows the SE results after decomposing each subsequence using ICEEMDA.
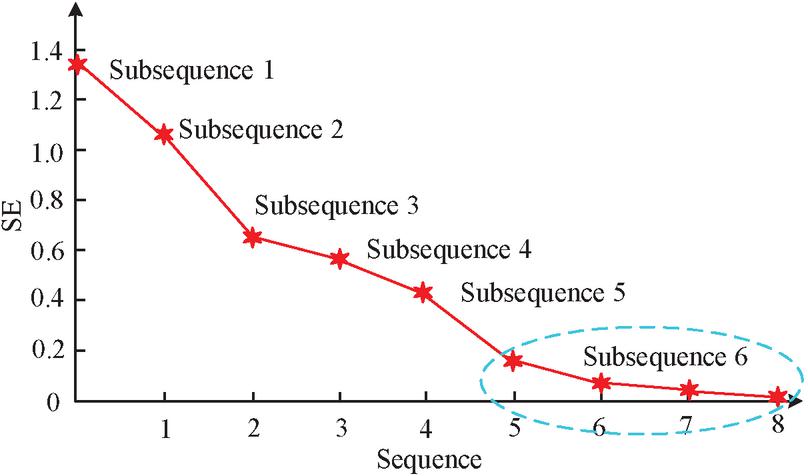
Figure 7 SE result of each Subsequence decomposed by ICEEMDAN algorithm.
In Figure 7, the SE algorithm is an effective method for measuring complexity. Subsequences 6–9 have similar SE values. Reconstruct 6–9 into a new subsequence, which is to preprocess the raw data of CTP and obtain six subsequences. To acquire the optimal input variables for the model, reduce the number of input features, avoid overfitting, and optimize the prediction efficiency, a 2S-FS method based on PACF and ReliefF algorithms was proposed. By using this method, the optimal features are selected as inputs to the prediction model. Firstly, the PACF algorithm is used to screen possible input variables. Figure 8 shows the PACF results for each subsequence obtained from data preprocessing.
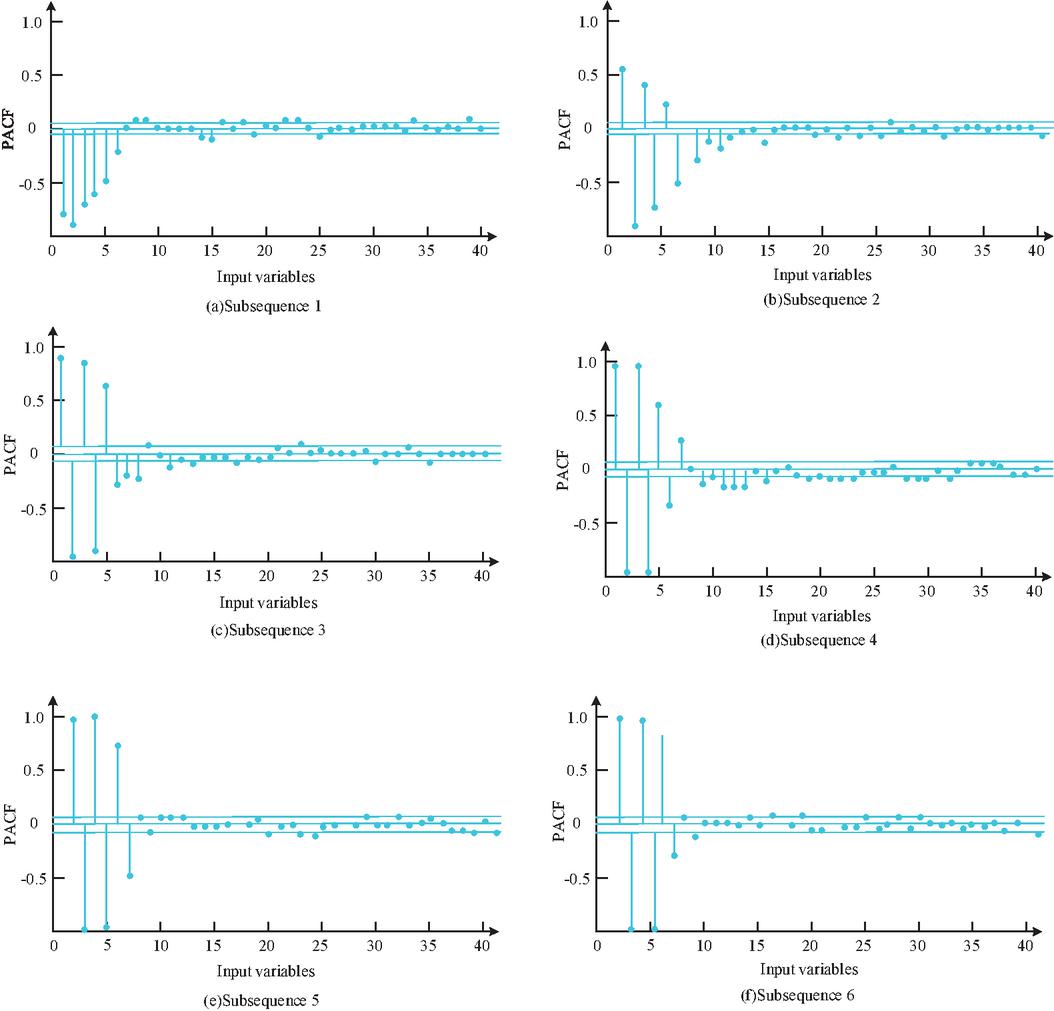
Figure 8 PACF of each Subsequence obtained from data preprocessing.
In Figure 8, the PACF data and probable input-variables for each subsequence are displayed in Table 1. The study selected 14 prediction models as controls and designed six analysis methods to comprehensively and systematically validate the proposed models. Table 1 shows the experimental results.
Table 1 Forecast results of different models in Carbon emission trading price data set
| Model | MAE | RMSE | MAPE | IA | TIC |
| GRNN | 3.0347 | 3.8836 | 10.3864 | 0.7923 | 0.0752 |
| ELM | 2.7825 | 3.7786 | 10.3645 | 0.7952 | 0.0536 |
| BPNN | 3.0558 | 3.8123 | 10.7521 | 0.7532 | 0.0721 |
| WRELM | 2.8964 | 3.6314 | 10.3145 | 0.8323 | 0.0536 |
| EMD-WRELM | 1.9425 | 2.6524 | 6.6521 | 0.9012 | 0.0532 |
| VMD-WRELM | 0.3204 | 2.2204 | 5.6521 | 0.9644 | 0.0346 |
| EEMD-WRELM | 1.9521 | 2.5504 | 6.6456 | 0.9246 | 0.0395 |
| ICEEMDAN-WRELM | 1.2420 | 1.8632 | 3.8753 | 0.9631 | 0.0336 |
| MOPSO-WRELM | 3.0254 | 3.7852 | 10.5273 | 0.7823 | 0.05782 |
| MOGOA-WRELM | 2.9321 | 3.8231 | 9.9632 | 0.8016 | 0.0742 |
| MOALP-WRELM | 3.1224 | 3.8214 | 11.0543 | 0.7532 | 0.0723 |
| Persistence modle | 3.0620 | 3.8521 | 10.2513 | 0.8102 | 0.0703 |
| ARIMA | 2.8134 | 3.6201 | 9.5013 | 0.8124 | 0.6214 |
| Research proposed model | 0.7836 | 1.0865 | 2.5210 | 0.9931 | 0.0162 |
| ICEEMDAN-SE-MOGOA-WRELM | 0.9031 | 1.2327 | 3.0344 | 0.9722 | 0.01973 |
In Table 1, by comparing the prediction datails of WRELM with those of other single models, namely GRNN, BPNN and ELM. WRELM has better prediction performance than the other three single models; The RMSE of GRNN, BPNN, ELM, and WRELM models are 3.88369, 3.8123, 3.7786, and 3.6314, respectively; Compared to GRNN, BPNN, and ELM, the prediction data of WRELM, EMD-WRELM, EEMD-WRELM, VMD-WRELM, and ICEEMDAN WRELM models were compared. It shows that based on the ICEEMDAN method, the prediction accuracy of the ICEEMDAN-WRELM is higher than that of other models.
4.2 Experimental Results and Analysis of CT-PPM Based on HOA
To test the optimization performance of the HBOASCA algorithm, BOA and SCA optimization algorithm thresholds were selected for comparison, and four common testing functions were used for performance testing. The specific content includes: Sphere, Rotatedhyper ellipsoid, Ackley, and Griewank functions. When testing the performance of optimization algorithms, set the number of iterations for each algorithm to 500 and the population to 30. Each test experiment was conducted 50 times, using different optimization algorithms to determine the maximum, minimum, mean, and standard deviation of the test results. Table 2 shows the specific results.
Table 2 Test results of different optimization algorithms
| Tests | Optimization | Maximum | Minimum | Mean | |
| Function | Algorithm | Value | Value | Value | Variance |
| Sphere | BOA | 1.2026E | 8.2055E | 1.0023E | 7.3694E |
| SCA | 0.6325 | 5.3108E | 0.0635 | 0.1205 | |
| HBOASCA | 8.0435E | 5.3253E | 6.3258E | 6.2105E | |
| Rotatedhyper- | BOA | 1.5206E | 9.3602E | 1.3320E | 1.1709E |
| ellipsoid | SCA | 23261.21 | 189.32 | 7630.21 | 5332.48 |
| HBOASCA | 5.6214E | 2.8546E | 4.0239E | 5.4402E | |
| Ackley | BOA | 5.8327E | 4.3574E | 6.0425E | 4.3520E |
| SCA | 3.7210 | 0.0231 | 0.8901 | 0.9924 | |
| HBOASCA | 6.3351E | 4.8742E | 5.4473E | 3.6620E | |
| Griewank | BOA | 6.3942E | 6.6741E | 2.5447E | 1.2025E |
| SCA | 0.5531 | 2.69E | 0.1288 | 0.1672 | |
| HBOASCA | 4.5268E | 5.3367E | 1.9231E | 9.2365E |
In Table 2, the HBOASCA algorithm has the best optimization performance, with significantly higher optimization efficiency than BOA and SCA. In the Rotatedhyper ellipsoid function, the values corresponding to each indicator in the HBOASCA algorithm are 5.6214E-12 (maximum), 2.8546E-12 (minimum), 4.0239E-12 (mean), and 5.4402E-13 (variance), respectively. Among different optimization algorithms for the same function, the maximum, minimum, mean, and variance of the HBOASCA algorithm are the smallest. This indicates that compared with other comparative optimization algorithms, the hybrid optimization algorithm HBOASCA has better optimization performance than the other BOA and SCA, and can effectively optimize different problems. In summary, the hybrid optimization algorithm of data preprocessing algorithm, artificial intelligence optimization algorithm, and feature selection algorithm is a comprehensive, collaborative, adaptive, and real-time method, which has the advantages of high accuracy, high efficiency, strong generalization ability, and strong interpretability. Compared with other optimization methods, it can provide more choices and flexibility, a more robust and reliable overall optimization effect, better adaptability and flexibility, and higher optimization efficiency. Convergence is also an important indicator reflecting the performance of an optimization algorithm. The study conducted 50 HBOASCA operations on each test function, and obtained the variation pattern of fitness over time for each test function after 50 operations, as shown in Figure 9.
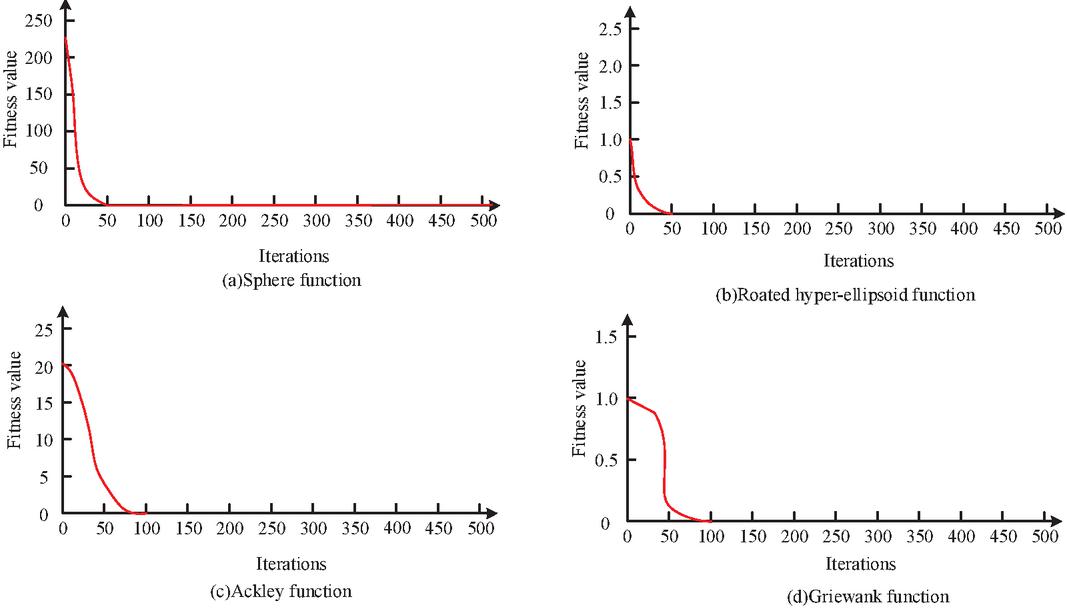
Figure 9 Test results of algorithm function convergence.
In Figure 9, the HBOASCA algorithm is convergent and has excellent optimization capabilities. It can not only serve as an effective tool to solve distinctive optimization problems, but also be applied in CTPP research, providing support for the successful construction of CT-PPM based on chaos theory and HOA. Figure 10 shows the maximum Lyapunov exponent (MLE) results for each modal component in the Shenzhen dataset.

Figure 10 The MLE of each modal component.
In Figure 10, the MLE of each modal component in the Shenzhen dataset is greater than. The MLE of the 8 modal components are 0.0596, 0.0842, 0.1624, 0.3624, 0.4251, 0.07621, 0.1124, and 0.2063, respectively. It can be seen that the modal components obtained from the carbon trading price data after VMD decomposition still exhibit chaotic characteristics. The carbon trading price prediction model established by the research institute contributes to the existing knowledge system of carbon trading and emission reduction, as it can provide more accurate and timely carbon trading price predictions, providing valuable references for market participants, policy makers, and academic researchers. The carbon trading price prediction model established by the research institute is a novel issue that can help people explore various related issues, such as how to improve the accuracy of carbon trading price prediction, how to deal with market uncertainty and volatility, and how to evaluate the emission reduction effects of different carbon policies. Further research and exploration are needed to better promote the continuous improvement and development of carbon trading and emission reduction knowledge system. The application field proposed in the study in reality is that for participants in the carbon trading market, the carbon trading price prediction model can help market participants understand future carbon emission costs and market demand, thereby better planning and managing their carbon assets. This is very important for enterprises as they need to develop emission reduction plans and production decisions based on future carbon emission prices. For the general public, it can help them understand the changing trends and influencing factors of carbon emission prices, thereby better understanding and paying attention to carbon emission issues. This is very important for raising public awareness of environmental protection and promoting sustainable social development.
5 Conclusion
The increasing demand for fossil fuels has led to excessive emissions of greenhouse gases like CO. With the intensification of global climate change, how to decrease greenhouse gas emissions is currently a hot topic in the international community. The influencing factors of carbon prices are complex, and there are still some problems in the existing CT-PPM, which do not fully recognize the enormous potential of MLMs to lift the prediction performance of CTP. This study will use two MLMs that can address the shortcomings of traditional artificial intelligence models as the basic prediction models. Specifically, it includes a machine learning prediction model that extends to the theory of extreme learning machines and FIST, and integrates data preprocessing, artificial intelligence optimization, FSA, etc. The experimental data shows that the MLE of the 8 modal components concentrated are 0.0596, 0.0842, 0.1624, 0.3624, 0.4251, 0.07621, 0.1124, and 0.2063, respectively. Therefore, the CTPP data used in this manuscript, after being decomposed by VMD, still exhibit chaotic characteristics in each modal component. In theoretical terms, based on theories such as machine learning, data preprocessing algorithms, feature selection, and artificial intelligence optimization, multiple improved CT-PPM are proposed, which can theoretically compensate for the shortcomings in existing CTPP. However, there are still some shortcomings in this study. In the current carbon trading price prediction model, some parameters still need to be manually predetermined. In future research, the setting of relevant parameters in the model needs to be further improved. The model can learn and adjust parameters to better predict carbon trading prices, or parameter optimization can be driven by a large amount of historical data, Make the model more accurate in predicting future carbon trading prices. The improved prediction model has a wide range of practical applications and implications in the carbon trading market, which can promote the development of carbon emission reduction work, improve market efficiency, guide enterprise investment decisions, promote international cooperation, enhance policy formulation basis, improve financial institutions’ risk management capabilities, and raise public awareness. These applications help to promote the resolution of global carbon emissions issues and achieve sustainable development goals.
References
[1] Liu L, Yin Z, Wang P, Gan P, Liao X. Water-carbon trade-off for inter-provincial electricity transmissions in China. Journal of Environmental Management, 2020, 2689(8):19–27.
[2] Sheng Z, Han Z, Yuwei Q U, Boya Z. Study on Price Fluctuation and Influencing Factors of Regional Carbon Emission Trading in China under the Background of High-quality Economic Development. 2021, 21(2):201–212.
[3] Sun L, Xiang M, Shen Q. A comparative study on the volatility of EU and China’s carbon emission permits trading markets. Physica A: Statistical Mechanics and its Applications, 2020, 560(6)25–33.
[4] Hu B, Huang B, Liu Z, Guo H, Chen Z, Shi L. Optimization Model of Carbon Footprint of Fresh Products in Cold Chain from the Energy Conservation and Emission Reduction Perspective. Mathematical Problems in Engineering, 2021, 2021(17):21–31.
[5] Mai L, Ran Q, Wu H. A LMDI decomposition analysis of carbon dioxide emissions from the electric power sector in Northwest China. Natural Resource Modelling, 2020, 33(4):25–47.
[6] Li X, Li Z, Su C W, Umar M, Shao X. Exploring the asymmetric impact of economic policy uncertainty on China’s carbon emissions trading market price: Do different types of uncertainty matter?. Technological Forecasting and Social Change, 2022(5):16–27.
[7] Sun R, Wang K, Wang X, Zhang J. China’s Carbon Emission Trading Scheme and Firm Performance. Emerging Markets Finance and Trade, 2021, 58(6):837–851.
[8] Liu Z, Huang S. Carbon option price forecasting based on modified fractional Brownian motion optimized by GARCH model in carbon emission trading. The North American Journal of Economics and Finance, 2020, 55(1):101–115.
[9] Chen Z, Su Y, Wang X Y, Wu Y. The price discrimination and environmental effectiveness in carbon emission trading schemes: A theoretical approach. Journal of Cleaner Production, 2021, 283(10):16–22.
[10] Wang L, Dai W, Zhu L, Wang X, Yin C, Cong H, Shi T, Qi X, Bi R. Multi-objective expansion planning of park-level integrated energy system considering the volatility trend of CETP. IET generation, transmission & distribution, 2022, 16(6):1225–1243.
[11] Qi C, Choi Y. A study on the CO marginal abatement cost of coal-fueled power plants: is the current price of China pilot carbon emission trading market rational?. Carbon Management, 2020, 11(4):303–314.
[12] Luo Y, Wang W, Zhao D. The impacts of carbon emission trading mechanism on the power transition pathway-taking Guangdong-Hong Kong-Macao Greater Bay Area as an example. Journal of Cleaner Production, 2022, 330(1):12–25.
[13] Li M Q, Fung B C M, Charland P. DyAdvDefender: An instance-based online machine learning model for perturbation-trial-based black-box adversarial defense. Information Sciences: An International Journal, 2022, 601(7):357–373.
[14] Brari Z, Belghith S. A Novel Machine Learning Model for the Detection of Epilepsy and Epileptic Seizures Using Electroencephalographic Signals Based on Chaos and Fractal Theories. Mathematical Problems in Engineering, 2021, 2021(35):31–40.
[15] Wang Y, Li S, Li S, Zhu F. Prediction Method of Human Group Emotion Perception Tendency Based on a Machine Learning Model. International Journal of Artificial Intelligence Tools: Architectures, Languages, Algorithms, 2022, 31(2):14–33.
[16] Azzone M, Barucci E, Moncayo G G, Marazzina D. A machine learning model for lapse prediction in life insurance contracts. Expert Systems with Applications, 2022, 191(4):11–23.
[17] Salunkhe V G, Desavale R G. An Intelligent Prediction for Detecting Bearing Vibration Characteristics using Machine Learning Model. Journal of Nondestructive Evaluation Diagnostics and Prognostics of Engineering Systems, 2021, 4(3):7–20.
[18] Li X, Kong K, Xu S, Qin P, He D. Feature selection-based android malware adversarial sample generation and detection method. IET information security, 2021, 15(6):401–416.
[19] Sakar B E, Serbes G, Aydin N. Emboli detection using a wrapper-based feature selection algorithm with multiple classifiers. Biomedical Signal Processing and Control, 2022, 71(1):34–45.
[20] Luo Y, Wang W, Zhao D. The impacts of carbon emission trading mechanism on the power transition pathway -taking Guangdong-Hong Kong-Macao Greater Bay Area as an example. Journal of Cleaner Production, 2022, 330(1):19–32.
[21] Barma M, Modibbo U M. Multiobjective mathematical optimization model for municipal solid waste management with economic analysis of reuse/recycling recovered waste materials. Journal of Computational and Cognitive Engineering, 2022, 1(3):122–137.
Biographies

Yisheng Liu graduated with a bachelor’s degree from the School of Economics at Peking University in 1982, a master’s degree from the School of Economics at Peking University in 1987, and a doctoral degree from the School of Economics at Fujian Normal University in 2005. He is currently a professor at the School of Business at Zhejiang Yuexiu University. The main research fields include macroeconomics and the digital economy.

Fang Xu graduated with a bachelor’s degree from Southwest University of Political Science and Law in 2002 and a master’s degree from Ocean University of China in 2009. She is currently an associate professor at Zhejiang Yuexiu University. The main research fields include international trade and the digital economy.
Strategic Planning for Energy and the Environment, Vol. 43_2, 401–424.
doi: 10.13052/spee1048-5236.43210
© 2024 River Publishers