Intelligent Processing of Power Operation Data Based on Improved Apriori Algorithm
Xin Zhao* and Changda Huang
State Grid Xinjiang Electric Power Co., Ltd Marketing Service Center, Qin Yang 454550, China
E-mail: zhaoxinzx@tom.com
*Corresponding Author
Received 28 September 2023; Accepted 16 November 2023; Publication 09 January 2024
Abstract
This paper addresses several problems in the power system. Key challenges include low-power information integration, inappropriate system data management, inaccurate system data updating, and inefficient fault diagnosis. We focus on analyzing and diagnosing transmission line faults using the operation data of the power system. The study incorporates the quantitative identification of statements. This is done using the Apriori big data analysis and calculation method. Additionally, we utilize big data analysis and vast power operation data. We aim to achieve automatic analysis and pinpoint the causes of transmission line faults. Furthermore, we seek to optimize the traditional Apriori calculation method. This optimization results in a reduction of about 52% in the candidate item set calculation. The optimized M-Apriori calculation method can analyze the correlation between event index data and faults in real time, and realize automatic diagnosis and analysis of faults through operation data.
Keywords: Apriori algorithm, power data, fault diagnosis, data processing, vectorization identification.
1 Introduction
With the development of society and the advancement of technology, the power system is slowly moving from traditional system management to intelligent analysis of the system, and slowly moving from manualization to intelligence. A smart grid is thus produced by the trend, through the combination of power system and computer technology to realize some decision-making related information based on data in-depth exploration, to make the power system more ‘intelligent’ for the decision-makers to work, diagnose faults, and repairs through the power operation data. With the further deepening of the research, data in-depth exploration technology is widely used in the field of electric power, and the association rule Apriori calculation method is a widely used calculation method in the data in-depth exploration technology, which is designed to find the relationship between the transaction data items, and compared with other data in-depth exploration calculation methods can be better mined to find out the connection between the causal factors of the fault.
The research of power system fault diagnosis methods started earlier, and now the power system fault diagnosis and analysis methods, have formed a more perfect method system and analysis theory system [1]. At present, the common method is mainly based on the current and voltage to analyze, through the instrument to the line current and voltage waveform and phase to measure, and then according to the relevant network topology reasoning analysis, to find out the relevant characteristics of the fault performance and the possible causes [2], some scholars in the study put forward a current equation based on the current characteristics of the current, which through the monitoring of line network current characteristics and the trend of change to realize the power grid line fault diagnosis and analysis methods. The current characteristics and change trends in the line network to realize the analysis and identification of power line faults, this method usually needs to accumulate a wealth of experience or historical data to assist, in finding out the relevant problems promptly [3]. Some other scholars have designed a distributed analysis method based on dividing the grid node currents by deploying sensors at each node to collect the voltage signals of the nodes to analyze the fault types and characteristics of the whole network and to locate the faults quickly [4, 5].
Almost all current compilers provide automatic vectorization, such as ICC, gcc, and open64-based compilers. All of these compilers have developed automatic vectorization, but each has a different focus. The traditional approach to vectorization is based on dependency analysis and loop transformations [6], and generally develops vectorization capabilities for the innermost part of the loop. Many commercial compilers use the currently dominant computational approach proposed by Randy Allen and Ken Kennedy [7], which first analyzes the composition of the entire dependency graph, then constructs the strongly connected components between the various objects of the entire structure using the tarjian computation, which simultaneously topologically orders the strongly connected components, and then changes the order of each factor to convert the processable phrases to a quantified form by changing the order of each factor. By changing the order of each factor, the processable statements and unprocessable statements are distributed in different loops, and finally, the code for SIMD vectorization is generated. Some scholars have proposed a graph-like H-graph computation method for loop distribution [8, 9] and a dependency-breaking optimization computation method, which is important for improving the speed and efficiency of computation, but mainly for the existence of many nested loops. Literature [10–15] study for arbitrary control flow loop distribution calculation method, for general control flow pattern, this calculation method in the loop distribution as far as possible to introduce a small number of new arrays, and does not need to copy the statement and candidate conditions, this calculation method in Fortran’s interactive communication parallel program environment to develop, but also can be used for automated parallel computation and vectorization processing of the system to go.
From the currently existing research, data deep mining and power system-related researchers have begun to optimize and improve these traditional data deep exploration calculation methods, combined with power system-related application scenarios, to improve the whole calculation method. The processing and analysis efficiency [16–18], some scholars have designed an improved S-VM calculation method suitable for data with high legacy characteristics of electric power, in which the redundant data are processed and trimmed by adding a similar calculation module to ensure that the calculation method can find out the collection of the most analytical data from the massive data, and analyze it in order to find out the law, the The throughput and real-time performance of the calculation method have been significantly improved [19]; Literature [18–22] also conducted an in-depth study on the stability prediction of power generation system from the perspective of big data, which extracted power generation-related data information and waveform data from the power generation monitoring data center to construct a sum data warehouse of stability analysis topics, and then used the Apriori algorithm to mine and analyze the data in the data warehouse, and analyze its relationship with the stability of the data warehouse. The data in the data warehouse are then mined and analyzed to analyze the factors that are highly correlated with stability, and optimized according to these factors to improve the stability of the power generation system and reduce the risk of failure [23].
In the current context of global climate change, many scholars have studied the relationship between various fields and climate change [27–29], and the power sector is also facing challenges and opportunities in various aspects. Rising temperatures and an increase in extreme weather events may lead to a rising demand for electricity, especially during the hot season, making the power system more stressed during the summer peak. At the same time, the volatility and predictability of renewable energy sources pose power supply challenges that require more flexible power system operations. Extreme weather events can lead to damage to power equipment and disruptions to transmission lines, further impacting supply reliability. Taken together, the power sector needs to adapt to climate change while safeguarding the reliability of energy supply, promoting sustainable development, and facilitating access to clean energy to meet the growing demand for electricity and address the challenges posed by climate change, and the distribution of climate change-induced benefits has been examined by several scholars. Climate change-induced benefit distribution significantly affects the relationship between stakeholders and resource allocation [30, 31]. The rise of the clean energy industry provides business opportunities for renewable energy companies and technologies, which in turn promotes the development of the green economy and creates conditions for new job creation and economic growth. At the same time, the implementation of climate adaptation and mitigation measures provides investment and business opportunities in areas such as buildings, transportation, and infrastructure. However, these changes may pose challenges to traditional high-carbon and resource-intensive industries, requiring a balancing of different interests in the transformation of the economy.
Based on the above analysis, from the viewpoint of current research, the data in-depth exploration technology is the mainstream technology for future intelligence in the actual operation of the power system, and based on big data to analyze the data of the operation of the power system, the identification of all kinds of faults and risks is a major trend in the future development of the intelligence of the power system. In this paper, we improve the Apriori calculation method based on the cyclic distribution calculation method of vectorized identification and then import the power operation data to propose a fault analysis method for power communication equipment based on the improved Apriori calculation method. We apply the Apriori calculation method to diagnose and analyze transmission line faults, and the potential correlation relationship between various fault information and data reports is mined from the existing grid information database by the Apriori calculation method, to discover the relevant fault characteristics and the best matching causes and suggestions. This improved method in this paper is expected to improve the accuracy and efficiency of fault diagnosis and make the power system more reliable. At the same time, it is expected to provide power operators with more comprehensive fault characterization by mining the correlation relationships in the grid information database, enabling them to better formulate coping strategies and improve system operation, which is of great theoretical and practical significance to the power field.
2 Methods
In this paper, the Apriori algorithm is improved by using a cyclic distribution calculation method for vectorized identification to cope with the problems of low information integration, data management, and collection in power systems. With the optimized Apriori algorithm, we successfully reduce the workload of calculating candidate item sets and improve the efficiency of the system in handling large-scale data. In addition, we introduced a cyclic distribution computation method for vectorized identification to more accurately identify fault information in power system operation data. The application of this method is expected to uncover potential correlations for a better understanding of fault characteristics and causes.
2.1 Calculation of Cyclic Distributions Based on Vectorization Identification
Vectorization is the basis of data processing, through the matrix parallel computing, reduces the cycle, and can significantly improve operational efficiency; its process is shown in Figure 1. In this paper, we extend the array dependency graph into a directed dependency graph that contains both array dependency and statement dependency, so that when identifying the vectorized loop, we only need to traverse the directed dependency graph, and only need to analyze one of the read-referenced array nodes in the statement to get the necessary dependency information for identifying the vectorization, which not only simplifies the code implementation process but also is not prone to errors. Based on the characteristics of SIMD vectorization, we analyze whether statements can be vectorized from a new perspective, analyze the operational data dependencies, and analyze the data correlation of the innermost loop for cyclic distribution.

Figure 1 Flowchart of data vectorization.
Table 1 below gives a computation of whether a statement can be vectorized by analyzing the dependencies between statements within a loop. This computation is based on the dependency graph between each sentence, finding the strongly connected component by the Tarjian computation method, and then determining whether the statements in the strongly connected component are processable or not.
Table 1 A framework for identifying whether a tag statement can be vectorized or not
| Procedure Statement_Vectorizable (R, k, D) |
| //R is the loop area to analyze. |
| //k is the dependence distance of the statement obtained by array subscript analysis. |
| //D is the statement dependency graph in R. |
| Remove the edge whose dependence distance is greater than the vector length in the |
| dependency graph D; |
| Find the maximal set of strongly connected components of R [,] from the |
| dependency graph D (using the Tarjian algorithm). |
| Reduce each to a node, construct R* from R, and construct D* from D; [,…,] is |
| the node corresponding to D* in R*; [,…] is the node corresponding to D* in R*. |
| For i 1 to m do begin |
| It has only one statement then |
| If this statement is itself true dependent on then |
| Mark this statement un-vectorizable; |
| else marks that this statement can be vectorized. |
| Select and delete an unvectorizable loop 1 from S’. |
| else begin |
| Clear the deletable edges (anti-dependent edges and output-dependent edges) in, |
| Find the maximal set of strongly connected components [,…,] in the |
| dependency graph D concerning, (using the Tarjian algorithm). |
| For i 1 to n do begin |
| If: The number of statements is greater than 1 then |
| All statements in the tag US are not vectorizable; |
| else if US; A statement in then marks US as its true dependency; This |
| statement is |
| not vectorizable. |
| else label the US; The statement can be vectorized. |
| end; |
| end. |
| end |
| end Statement_Vectorizable |
Due to the limitation of the length of the SIMD vector, the loop can be viewed as consisting of several sub-loops with the number of loop iterations equal to the vector factor (vector processing factor number of bits stored in the vector/number of bits of the data type), and each of the sub-loops is analyzed according to the traditional vectorization method. If the dependency distance is greater than the vector processing factor, the two statements belong to different sub-loops, and the order of dependency between the loops is maintained and can be disregarded. In this way, traditional vectorization methods can also be used for vectorization analysis of SIMD architectures. For example, in the current intel SSE instruction set, the width of the vector storage is 128 bits and the vector processing factor of the integer is 4. If the dependency distance is not less than the vector processing factor, for example, the statement: a[i 4] a[i] 2, the dependency distance is 4, and after executing the four instructions at a time, the change in the execution order of the statements will not lead to a change in the result of the program. The detection of dependency distance is performed first in this calculation method, which is different from the traditional vectorization, that is, it combines the characteristics of SIMD structure and removes some unnecessary dependency cases.
2.2 Improved Apriori Algorithm
In this paper, based on an improved Apriori algorithm, power operation data is analyzed, and operation fault data is extracted and analyzed, now An improved Apriori algorithm is proposed based on vectorized data identification.
The core idea of the Apriori calculation method is self-connection and pruning. However, there are shortcomings in the process of the computational method, which requires scanning the operation database several times from the candidate item set to filtering the frequent item set, which consumes much time and occupies the computational resources. Now, the computational method is improved based on vectorized fault data record recognition, to analyze the power communication operation data faster. Firstly, the operation data is processed hierarchically, and the wavelet transform is applied to the power operation data as follows:
| (1) |
is a wavelet and the mathematical model is as follows:
| (2) |
Hence the simplification of the model:
| (3) |
a, are the correlation factors of the waveforms.
The equipment fault database is then preprocessed and mapped into a matrix containing only “0” and “1” elements. The rows of the matrix represent one fault data, and the columns represent the fault classification and influencing factors, to generate the communication equipment fault matrix. For example, there are 5 equipment fault records, corresponding to 5 types of equipment faults, respectively, signal loss, frame loss, track identification mismatch, pointer loss, and signal degradation, each record exists corresponding to the fault that is 1, or 0, which can form a 5 5 Boolean matrix, as shown in Equation (4):
| (4) |
A, B, C, D, and E are the corresponding numbers of the five equipment defects respectively.
Apriori calculation method is improved, specifically, the power communication equipment fault matrix B, each column of the fault item parallel set to produce candidate frequent C-1 item set; statistics matrix B, each column of the number of times the “1” element appears, branching operation, that is, if j column “1” element occurs Sj n a, delete the column of the matrix, that is, delete the fault item, resulting in frequent L-1 item set; and then frequent L-1 item set connection, operation, that is, matrix B fault item set connection, operation, that is, matrix B fault item set, that is frequent L-1 item set. If the number of occurrences of “1” element in column j Sj n a, delete the column of the matrix, i.e., delete the fault item, resulting in frequent L-1 itemsets; and then connect the frequent L-1 itemsets, i.e., matrix B, the fault item columns for the logical “with” operation, resulting in candidate frequent C-2 itemsets. For example, for the above matrix, the minimum threshold is set to 20%, i.e., when Sj 1, column E of the matrix is deleted, i.e., the signal degradation faults, and then the new matrix is subjected to the logical “with” operation, which results in the following formula (5).
The testing of different support values starts by selecting a range of possible support values and then applying the improved Apriori algorithm for round-robin testing. Under each supported value, the steps of candidate itemset generation, support calculation, and association rule mining are executed, and the metrics such as the number of frequent itemsets, the number of association rules, and the confidence of the rules of the mining results are evaluated. At the same time, the performance parameters of the algorithm, such as running time and memory consumption, are recorded to comprehensively consider the computational efficiency of the algorithm. Ultimately, the optimal support value is selected by combining the result evaluation and performance analysis. In this paper, the minimum support threshold that can improve the quality of association rule mining while maintaining the efficiency of the algorithm is finally selected. Such a choice can ensure the performance of the algorithm while ensuring that the discovered association rules are of practical significance for the in-depth understanding and accurate diagnosis of power system faults.
| (5) |
AB, AC, AD, BC, BD, and CD are the defect columns obtained by logical “and” operation on the corresponding columns of the new matrix.
Then compare the “1” of each sub-element of the candidate frequent C-2 itemsets with the set minimum threshold, and if it is not satisfied, it is deleted and the frequent L-2 itemsets are updated. The pruning and concatenation operations continue until the L-k item is updated. The implementation of the improved calculation method is shown in Figure 2.
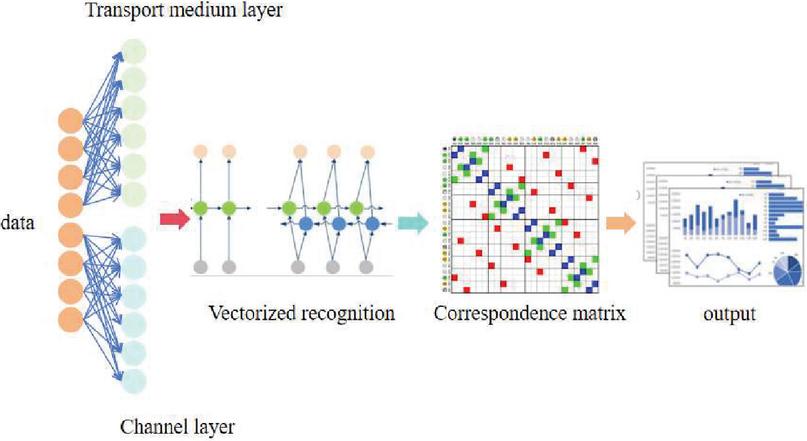
Figure 2 Flowchart of improved Apriori algorithm.
2.3 Fault Analysis Model of Power Communication Equipment Based on Improved Apriori Calculation Method and Vectorized Identification
To improve the fault management level of communication equipment, it is necessary to analyze and deal with communication equipment faults promptly. When the communication equipment of the power grid is abnormal, the staff must find its abnormality and record the fault information promptly, and the power production system manages the fault information of various communication equipment. If we only analyze the meaning of the data itself, the actual operation and maintenance process of communication equipment operation generates a large amount of data, and some data redundancy and unrepresentative, do not get too much useful value. Therefore, this paper adopts the improved Apriori calculation method and combines the communication equipment model and the improved Apriori calculation method model to propose the communication equipment fault correlation analysis method based on the improved Apriori calculation method. The fault analysis model is shown in Figure 3 below. Firstly, the power communication equipment operation data are collected, and after data preprocessing, the cyclic distribution calculation method of vectorization identification is applied to transform the data into numerical vectors. Subsequently, the improved Apriori algorithm is used to generate the candidate item set, calculate the support degree, and mine the association rules, focusing on the rules related to equipment defects. Finally, the association rules are analyzed and visually presented to provide O&M personnel with intuitive fault characteristics and potential causes, and then optimize the model to improve accuracy and practicality.

Figure 3 Defect analysis model.
To analyze the failure pattern, it is necessary to obtain an effective and representative set of characteristic data components. According to the above multi-dimensional influence factors, fault characteristics classification, and communication equipment model analysis, it can be seen that the influence factors that cause failures and fault classification of these two data volumes are necessary to analyze the failure of the equipment, fault law. Thus, the set of key factors of failure can be constructed, as shown in Equations (6)–9.
| (6) | |
| (7) | |
| (8) | |
| (9) |
Where: denotes the input image of the ith channel; * denotes the process operation; denotes the Gaussian kernel function; N is the number of scales, N 3; denotes the percentage of the kth scale. is the color recovery parameter; and a are the correction parameters; and denote the outputs processed by the algorithm, respectively. is the multidimensional factors that cause the faults; represents the place of origin of the data. Based on the fault data obtained from a certain place, the set of fault critical factors DR is filtered out, and then the Apriori calculation method is improved to obtain the set of frequent items, to obtain the required association rules. To analyze the generation pattern and propose the correlation analysis method, it is necessary to obtain the following strong rules, as shown in Equation (10).
| (10) |
where: R rule represents the correlation between influencing factors and faults, which is used to analyze which influencing factors lead to which faults generate fault rules. The proposed fault correlation analysis model of power communication equipment based on the improved Apriori calculation method is shown in Figure 4.
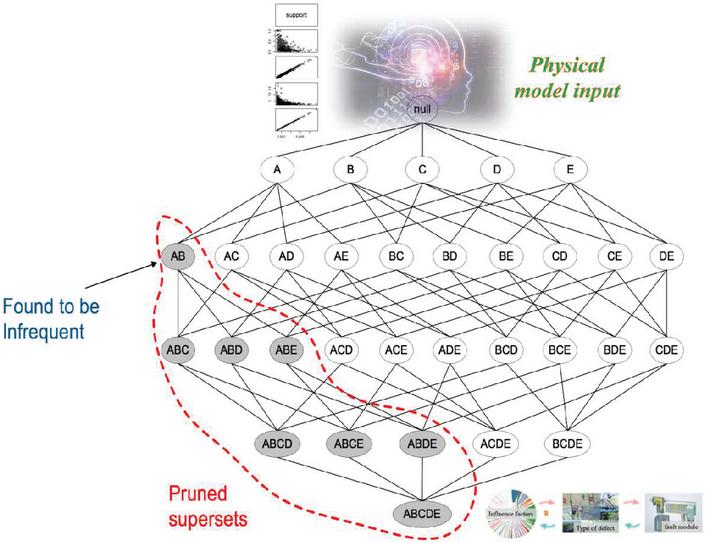
Figure 4 Correlation analysis model of power communication equipment defects based on improved Apriori algorithm.
3 Discussion
In order to verify the performance of the calculation method, the simulation analysis of the calculation method was carried out, and the simulation environment used was the Eclipse environment, 20 types of faults in the operation process were randomly selected, from which 5 different fault types of indicators were selected to carry out the experimental analysis, and based on the 5 types of fault indicators, the random simulation was carried out, and 10,000 simulated fault indicator data were formed and imported into the MySQL3 database, and then in the MyEclipse environment based on the open source Weka platform provides the classical Apriori calculation method proposed by Srikant and the apriori calculation method in the literature [24] and the M-Apriori calculation method designed in this paper to complete the experimental analysis of the simulation of the data, and finally statistics in the same degree of access to the support of the The time consumption of various computational methods under different number of processing transactions (see Figure 5) and the time consumption of computational method analysis under different minimum degree of support under the same number of transactions (see Figure 5), and evaluate the performance of different computational methods through the comparative analysis in order to judge the advantage of M-Apriori computational method designed in this paper, the specific experiments are as follows:
First of all, 11,000 fault indicator data were selected from the electric power operation database for two analysis, in which a total of 5 types of fault indicator types were included in these 11,000 fault indicator data, in order to verify that the calculation method has news in the simulation, and to exclude the influence of other aspects, pre-processing was carried out before the experiment of the calculation method, which was normalized, and then the feature data were extracted, and different versions were used to utilize the of the Apriori calculation method to verify its feasibility in transmission line fault diagnosis analysis, where the minimum degree of support obtained sup_min is set to be 1.5% when controlling the number of transactions to be processed, and simulation is carried out to combine the M-Apriori calculation method of this paper (Calculation Method I) with the classical Apriori calculation method proposed by Srikant (Calculation Method III), and the execution efficiency of the dimensionality-reduced data analysis FA (Firefly Heuristic’s Calculation Method) computation method (Calculation Method II) in the literature [24] are experimentally compared and analyzed, and the two comparative analysis curves are generated, as shown in Figure 5 below.
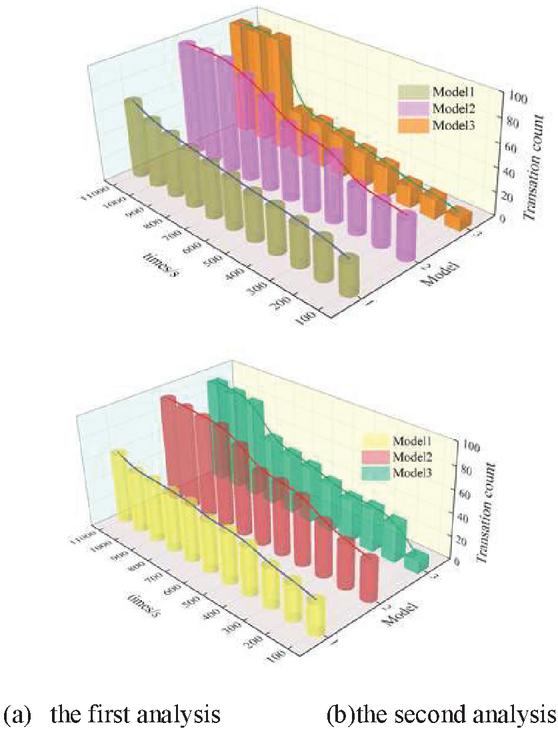
Figure 5 Comparative analysis of the execution time of the three algorithms with the same support and different number of transactions.
Through the two simulation results in the above figure, it can be seen that, with the increase in the number of transactions, the processing time of the three calculation methods will increase accordingly in the case of a certain degree of minimum support, but the improved method designed in this paper is slower than the latter two methods in the increase in time, especially in the number of transactions the larger the advantage is more obvious. The first simulation results show that: the number of transactions of 11,000 can be controlled within 30, compared with calculation method 2, calculation method 3 is improved by 50%. In the transaction number of 11000, it can be controlled within 30, which is 30% higher than that of calculation method two and 50% higher than that of calculation method three. The second simulation results show that the first method improves by 45% compared with the second method and 49% compared with the third method.
Secondly, this paper in the experimental time also on the number of transactions in the case of certain comparative analysis, the number of transactions will be processed fixed for 8000 to adjust the minimum degree of support obtained by each computational method sup_min, the three computational methods of the implementation of the efficiency of the comparative analysis of the experimental results are shown in Figure 6 below.
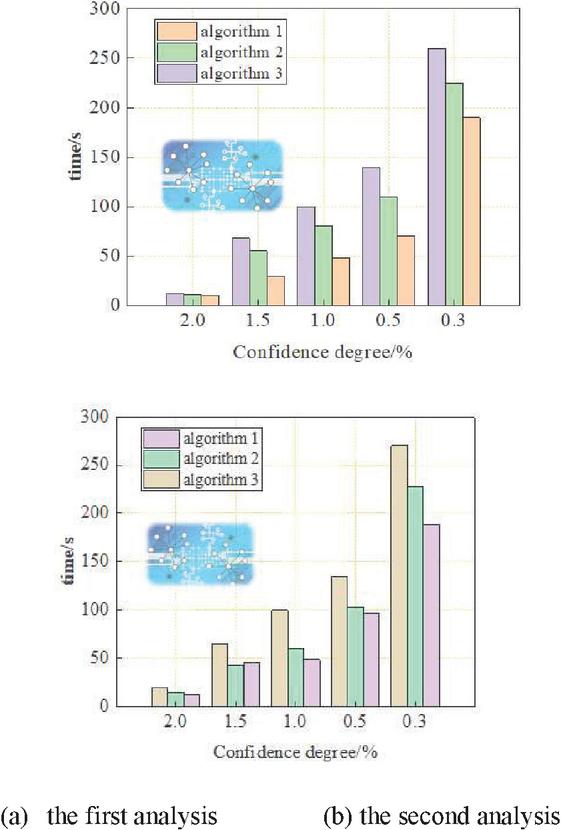
Figure 6 Comparison of implementation time.
It can be seen from the above experimental results that the execution time of the three calculation methods will be longer when sup_min is smaller than a certain number of transactions to be processed. When the Confidence degree decreases from 0.5% to 0.3%, the execution time of calculation method three increases greatly, calculation method two grows slower than calculation method three, and the calculation method designed in this paper (I) M-Apriori calculation method increases the execution time of the least and has the best performance.
This calculation method is based on the existing data of the system for its fault analysis but also based on the trend data analysis method for equipment fault data prediction, as shown in Figure 7 below, in which the pink color indicates the fault prediction results obtained through the prediction analysis function of the fault diagnosis fee analysis system designed in this paper, and the blue color is the historical fault data of the Texas Power Grid, which coincides with the prediction analysis from the point of view. The prediction accuracy is high.

Figure 7 Equipment failure data.
Based on the above research content, the improved model is applied to the power operation process to detect and analyze some of the power operation areas to generate the fault prediction cloud map of the area as follows.
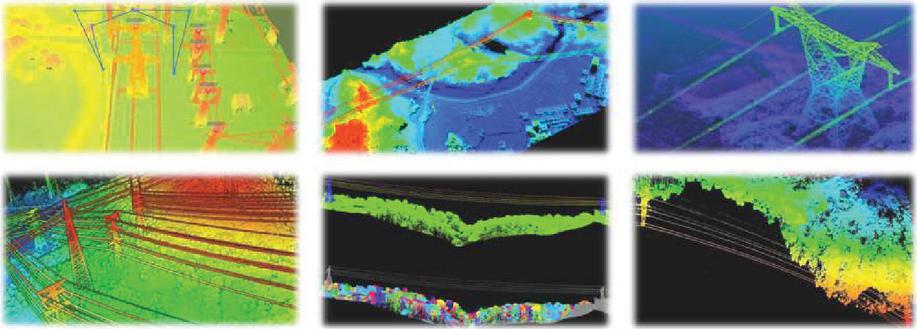
Figure 8 Model area fault prediction.
In terms of effectiveness and performance, the upgraded Apriori algorithm shows significant improvement over the conventional Apriori technique. The optimizations implemented in the upgraded algorithm resulted in a significant reduction in candidate itemset computation of about 52%. This optimization directly translates into improved efficiency in large-scale data processing in power systems. The traditional Apriori algorithm is known for its association rule mining capabilities but can be challenging when dealing with datasets with high dimensionality or large transaction records. The upgraded Apriori algorithm addresses these challenges by simplifying the candidate itemset computation process, effectively reducing the computational burden. In addition, the introduction of vectorized identification and cyclic distribution computation methods further enhances the effectiveness of the algorithm. The vectorization approach enhances the ability to identify patterns and associations in power system operational data, improving the accuracy and speed of analysis. In terms of performance, the upgraded Apriori algorithm is 15% more efficient in handling the same transaction volume compared to traditional methods. This performance improvement is a direct result of the optimizations made to the algorithm. The optimized algorithm not only accelerates the identification of correlations but also helps to analyze event metrics data and fault correlations in real time. Overall, the upgraded Apriori algorithm outperforms traditional techniques in terms of effectiveness and efficiency, demonstrating the potential to provide more accurate and timely fault analysis insights within the power system.
The improved model in this paper improves the efficiency and reduces the computational complexity of fault analysis of power system operational data. Through the data vectorization model, the operational data of the power system is transformed into numerical vectors to provide more informative inputs to the improved Apriori algorithm. These two collaborate, enabling the system to more accurately mine fault characteristics and correlations, and improving the ability to diagnose and analyze power system faults. It contributes an effective method to the development of intelligent data analysis in the field of power systems, which is expected to improve the operation efficiency and reliability of power systems in practical applications.
4 Conclusion
This paper mainly completes the design of the transmission line fault diagnosis method based on big data, firstly, based on the existing operation information database of the electric power system, it researches the relevant data and constructs the data table and indexes used for the in-depth exploration and analysis of the data, then it completes the design of the framework of in-depth exploration and analysis of the data based on the Apriori calculation method, and it improves the calculation method, combining with vectorization and identification calculation method so that it is suitable for the in-depth exploration and analysis of the data of the power lines. Then the framework design of data in-depth exploration analysis based on the Apriroi calculation method is completed, and the calculation method is improved by combining the vectorized quantization with the identification calculation method, which makes it suitable for the data in-depth exploration analysis of transmission lines. Finally, the Apriori calculation method is improved based on the model and analyzed by experiments from the processing efficiency of the same number of transactions by different calculation methods, and the results show that: the performance of the optimized calculation method is increased by 15%. The optimized calculation method can analyze the correlation between the event index data and faults in real-time through the operation data, and realize the automatic diagnosis and analysis of faults. The methodology in this paper still has some limitations, which may affect the comprehensiveness and accuracy of the findings if the level of power information integration remains low. Due to inadequate system data management and collection, there may be missing, incorrect, or outdated data, which may lead to the introduction of uncertainty in the analysis. In future research, this paper will improve the degree of power information integration to ensure the comprehensiveness and consistency of system data. By improving the data collection and management process, the degree of power information integration will be improved to ensure the comprehensiveness and consistency of system data.
References
[1] Zhang Yue. Research on transmission line fault analysis based on big data calculation method. Hubei. University of Technology, 2017.
[2] Zheng Maoran, Yu Jiang, Chen Hongshan, Gao Honghui, Zhang Jingwei, Lv Liang, Liu Zhiyong. Design of transmission line fault early warning model based on big data. Southern Power Grid Technology, 2017,11(04):30–37.
[3] Mao Jiangshan. Research on Transmission Line Management Systems and Fault Diagnosis Based on Apriori Computing Method. Electronic Testing, 2016(24):101–102.
[4] Song Yuqin, Li Ying, Duan Junrui. Fault diagnosis of power system transmission line based on RS and CPN. Computer and Modernization, 2016(11):118–121.
[5] Liu Zeng. Fault diagnosis of transmission lines based on image processing technology. Electronic Testing, 2016(19):143–144.
[6] David F. Bacon, Susan L. Graham, and Oliver J. Sharp. Computer Science Division, University of California, Berkeley, California 94720. Compiler Transformations for High-Performance Computing. ACM Computing Surveys, Vol. 26, No. 4, December 1994.
[7] Randy Allen, Ken Kennedy: “Automatic Translation of Fortran Programs to Vector Form”. ACM Trans. on Programming Languages and Systems, 1987, 9(4). 491–542.
[8] Zeng Y. Optimization problems for cyclic distributions and dependency breaking. Journal of Computer Science, June 1993, 16(6).
[9] Ken Kennedy, Kathryn. McKinley. Loop Distribution with Arbitrary Control Flow.
[10] Liao Zhiwei, Yue Ling, Wen Fushuan, ZHU Bingquan, XU Lizhong. Fault diagnosis and protection action performance evaluation of high-voltage transmission line based on rule network. Electric Power Construction, 2016, 37(02):34–41.
[11] T. Lengauer and R.E. Tarjian A fast algorithm for finding dominators in a flowgraph. ACM Transactions on Programming Languages and Systems, 1(1):121–141, July 1979.
[12] D. E. Maydan, J. L. Hennessy, M. S. Lam. Efficient and exact data dependence analysis[A]. In Proceedings of the SIGPLAN 1991 Programming Language Design and Implementation. US, 1991, 1–14.
[13] Samuel Larsen Submitted to the Department of Electrical Engineering and Computer Science on April 14, 2006, in partial fulfillment of the requirements for the degree of Doctor of Philosophy. Requirements for the degree of Doctor of Philosophy. Compilation Techniques for Short-Vector Instructions.
[14] Samuel Larsen, Rodric Rabbah, and Saman Amarasinghe. Selective Vectorization for Short-Vector Instructions. MIT-CSAIL-TR-2009–064, December 18, 2009 Compiler Optimizations from Proofs. POPL’10, January 17–23, 2010.
[15] Ross Tate, Michael Stepp, Sorin Lerner University of California, San Diego. Generating Compiler Optimizations from Proofs. POPL’10, January 17–23, 2010.
[16] Sorin Lerner, Todd Millstein, Craig Chambers, Department of Computer Science and Engineering University of Washington. Automatically Proving the Correctness of compiler optimizations. PLDIO3, June 9–11, 2003.
[17] J. R. Allen, L. Kennedy, C. Porterfield, and J. Warren. Conversion of control dependence to data dependence. in Conference Record of the Tenth Annual ACM Symposium on the Principles of Programming Languages, January 1983.
[18] Yu Lei, Wang Shuang, Han Yulong, Wang Shouqin, Ma Fu. Intelligent diagnosis method of power grid fault based on big data technology. China Science and Technology Information, 2016(02):32–3322.
[19] Li Lianying, Guo Ganghua. Research on automatic fault diagnosis system of power transmission line. Digital Technology and Application, 2016(01):85–86.
[20] Wang Fuchun, Chen Weihua. Automatic fault diagnosis and fault localization real-time release system for transmission lines. Heilongjiang Science and Technology Information, 2015(36):57.
[21] R. Cytron, J. Ferrante, B.K. Rosen, M. Wegman, and F.K. Zadeck. Efficiently computing static single assignment form and control dependence graph. ACM Transactions on Programming Languages and Systems, 13(4):452–490, October 1991.
[22] Dorit Nuzman, Ira Rosen, Ayal Zaks. Auto-Vectorization of Interleaved Data for SIMD. PLDI’06 June 10–16,2006, Ottawa, Ontario, Canada.
[23] Alexandre E. Eichenberger, Peng Wu, Kevin O’Brien. Vectorization for SIMD Architectures with Alignment Constraints. PLDI’04, June 9–11, 2004, Washington, DC, USA.
[24] I. Pryanishnikov, A. Krall, and N. Horspool. Pointer Alignment Analysis for Processors with SIMD Instructions. in Proc, of the 5th Workshop on Media and Streaming Processors at Micro303, pages 50–57, December 2003.
[25] S. T. Leung and J. Zahorjan, “Optimizing data locality by array restructuring,” University of Washington, Tech. Rep. TR 95-09-01, 1995.
[26] Kathryn S. Mckinley, Steve Carr, Chau-wen Tseng. Improving Data Locality with Loop Transformations. ACM Transactions on Programming Languages and Systems, 18(4), July 1996.
[27] Ming Yang, Yuan Yao, Shuai Wei, Yuanyuan Zhang, Lei Huang. A Technology-Based Benefit Analysis on Reuse of Vector Register for SIMD Vectorization Optimization. In proceeding of ISIS. Shanghai. 2010.101–104.
[28] Kyriakopoulos, G. L., and Sebos, I. (2023). Enhancing Climate Neutrality and Resilience through Coordinated Climate Action: Review of the Synergies between Mitigation and Adaptation Actions. Climate, 11(5), 105.
[29] Kyriakopoulos, G. L., Sebos, I., Triantafyllou, E., Stamopoulos, D., and Dimas, P. (2023). Benefits and Synergies in Addressing Climate Change via the Implementation of the Common Agricultural Policy in Greece. Applied Sciences, 13(4), 2216.
[30] Akkermans, S., Martín-Ortega, J. L., Sebos, I., and López-Blanco, M. J. (2023). Exploring long-term mitigation pathways for a net zero Tajikistan. Mitigation and Adaptation Strategies for Global Change, 28(3), 1–26.
[31] Ioanna, N., Pipina, K., Despina, C. et al. Stakeholder mapping and analysis for climate change adaptation in Greece. Euro-Mediterr J Environ Integr 7, 339–346 (2022).
[32] Sebos, I., Nydrioti, I., Katsiardi, P., et al. Stakeholder perceptions on climate change impacts and adaptation actions in Greece. Euro-Mediterr J Environ Integr (2023).
Biographies

Xin Zhao, Received a Bachelor of Engineering degree from Liaoning University of Engineering and Technology in 2016, and currently works at State Grid Xinjiang Electric Power Co., Ltd Marketing Service Center be in office Special person in charge. His research interests include Channel Management, Big data analytics, Industrial Economy and Project Management.

Changda Huang, Received a Bachelor’s degree in Engineering from North China Electric Power University in 2016, and currently works at State Grid Xinjiang Electric Power Co., Ltd Marketing Service Center be in operation supervisor. His research interests include High quality service, Channel Management, Big data analytics, Industrial Economy.
Strategic Planning for Energy and the Environment, Vol. 43_2, 477–498.
doi: 10.13052/spee1048-5236.43213
© 2024 River Publishers