Modelling and Assessing the Advantages of Integrating Wind, Solar, and Coal Systems within an Annual Bilateral Trading Setting
Meng Yiqun1,*, Bian Guoliang1, Gu Yi2, Liu Chuang1, Hu Bo3, Zhou Guiping2, Luo Huanhuan4, Zhao Yuanzhu5, Chang Yiming5 and Wang Zhonghui3
1Northeast Electric power University, 169 Changchun Road, Jilin, China
2State Grid Liaoning Electric Power Co., Ltd, Shenyang, China
3State Grid Liaoning Electric Power Co., Ltd. Dalian power Supply company, China
4Liaoning Power Trading Center Co., Ltd, Shenyang, China
5State Grid Liaoning Electric Power Co., LTD. Shenyang power supply company, China
E-mail: karlsson.meng@outlook.com
*Corresponding Author
Received 30 November 2023; Accepted 13 January 2024
Abstract
The integration and co-location of new energy sources and thermal power generation within the same grid connection point, under the management of a single market operator, provide noteworthy potential for exploration in the northern part of our nation. This method is based on the premise of allocating new energy resources primarily for generating contracted electricity, while using thermal power to offer ancillary services. This strategy aims to integrate and use the distinct benefits of both thermal power and new energy sources. The yearly bilateral trade market has significant potential for growth and development. In order to model and evaluate the income generated by the interconnected system’s involvement in the yearly bilateral trading market, this study first establishes the definition of the interconnected system and examines its research significance in engaging in annual bilateral trading. This study utilizes the theoretical framework of master-slave games to analyze the involvement of a coupled system in yearly bilateral trade. The specific case examined in this research is a wind-solar-thermal coupling system located in a particular location of Liaoning Province. This study examines the economic advantages of engaging in the electricity market by considering the marginal cost and LCOE (Levelized Cost of Electricity) perspectives. The findings suggest a notable enhancement in the advantages of the integrated system inside the yearly bilateral trade market, in contrast to conventional power sources present in the market, as well as instances when these sources function autonomously without integration.
Keywords: Electricity markets, coupling systems, LCOE, game theory.
1 Introduction
The installation capacity of renewable energy has emerged as a prominent phenomenon, experiencing rapid growth. Furthermore, the market-based trading domain is progressively increasing due to China’s active pursuit of its “Carbon neutrality” initiative and the ongoing advancements in electricity market reform [1, 2]. One of the primary advantages of renewable energy is its minimal marginal cost in electricity trading. However, the widespread trading of electricity has challenges mostly stemming from the unpredictability and uncertainty associated with power production.
These opinions aim to actively advance the construction of ‘multi-energy complementary’ systems as a means to enhance the utilization of clean energy sources [4]. The synchronization of various energy sources not only promotes optimal use of existing power supplies but also facilitates the maximization of overall benefits within the electrical market [5, 6]. An efficacious strategy for interconnection involves the segregation of renewable energy and thermal power as distinct entities inside a shared grid node. In order to optimize its market potential in yearly bilateral transactions, the coupling system adheres to the idea of prioritizing contracted electricity from renewable energy sources, while using thermal power for auxiliary services. The aforementioned methodology offers several advantages, such as little incremental operational expenses and the production of high-caliber results at the grid location.
Peng Feixiang, Sui Xin, Hu Shubo, and colleagues conducted a study in which they devised a collaborative bidding approach including wind farms and combined heat and power (CHP) units equipped with heat storage. They found that by assuming the role of price takers, the participants achieved superior overall returns compared to individual bidding efforts [7, 8]. The researchers Tan Zhongfu, Song Yihang, Zhang Huijuan, et al. have conducted studies on the combined supply of wind power and coal-fired generators for consumption, specifically focusing on wind power and thermal power [9, 10]. The majority of prior studies have used a game theoretic framework to examine quotation strategies and conduct benefit analysis in the context of annual bilateral transactions. Wang Chaozhong conducted a study on the use of cooperative games in the establishment of pricing mechanisms for transmission and distribution, as well as electric energy pricing processes, specifically focusing on bilateral transactions within the context of China [11] In their study, they also proposed a final balanced quotation strategy for both parties involved [12, 13]. Nevertheless, the aforementioned articles solely focus on analyzing yearly bilateral transactions involving thermal power as the predominant participant.
The main differences between coupled systems and bundled wind and solar power, as well as virtual power plants, are as follows:
In coupled systems, the three types of power sources – wind, solar, and thermal – share the same electrical grid nodes, providing better control capabilities and a more stable output of electrical energy.
Coupled systems function as a unified market entity in the electricity market, with their internal thermal power obligations providing peak-shaving auxiliary services to renewable energies, thereby reducing the deviation assessment costs of renewable energies.
The existing market pricing model, which is based on marginal costs, fails to adequately account for crucial factors such as the fixed costs borne by players in the market. Therefore, this research introduces an innovative market pricing model that use the Levelized Cost of Electricity (LCOE) as a fundamental metric for evaluating and contrasting with the traditional marginal cost model. The LCOE model is a comprehensive framework that integrates several aspects, including capital investment, operational and maintenance costs, and energy generation. By doing a comparison study of these two models, a comprehensive evaluation of the economic benefits linked to the involvement of integrated systems in the electricity market may be achieved.
2 Methodology
After the completion of the year trading volume in the market model, it becomes possible to compute the yearly income for power generating enterprises. In this context, we make the assumption that annual returns accrue over a period of time denoted as “t” inside the financial market.
| (1) |
Where is Power Company j’s Profit in Period t, profit is Power Company j’s Annual Profit, and m is the Total Number of Periods in a Year.
2.1 Game Model Between Coupled Systems and Competing Enterprises
Within the framework of the master-slave game paradigm, the dominant power generation enterprises and the interdependent coupling system occupy the highest echelons of the game hierarchy. Both of these businesses provide price quotations to their big clients with the aim of maximizing their own individual earnings. The financial gain of the power-generating company is represented by the following expression at the conclusion of each trading session, marked as t:
| (2) |
where and represent the total income and total expense of the power generating business j operating in period t, respectively. The entire revenue, denoted by the letter , may also be stated as:
| (3) |
The coupling system also has a different overall cost than the competing power generation firms, as can be seen in Table 1, which also contains a breakdown of the expenses between the two types of businesses.
Table 1 Cost classification of coupling systems and competing power generation companies
| Competing Power Producers | |
| Coupling Systems | (Coal-fired Generator) |
| Coal generation costs in the context of the coupling system | The topic of interest is to the cost associated with coal-fired generators and their coal usage. |
| Coal-fired power plants’ high coupling system costs | The environmental impact of coal-fired generators and associated costs. |
| The connection mechanism facilitates the sharing of fixed costs across thermal power sources. | The concept of fixed cost sharing in relation to coal-fired plants. |
| The coupling mechanism facilitates the sharing of fixed costs among cost-fired generators. |
Table 2 The LCOE costs of coupling systems and competing power generation enterprises
| Competing Power Producers | |
| Coupling Systems | (Coal-fired Generator) |
| New Energy and Thermal Power LCOE | Thermal Power LCOE |
| Thermal Power Coal Consumption Surcharge | Thermal Power Coal Consumption Surcharge |
| Thermal Power Environmental Surcharge | Thermal Power Environmental Surcharge |
| Thermal Power Carbon Emission Cost Surcharge | Thermal Power Carbon Emission Cost Surcharge |
Within the framework of marginal cost analysis, a detailed breakdown is provided for every distinct cost category:
2.1.1 Cost of coal for thermal power generation units
Quadratic functions are often used to depict the financial implications of coal usage in coal-fired power plants. The financial expenditure associated with the use of coal during a certain duration, symbolized as t, may be expressed mathematically as:
| (4) |
The determination of the precise value of is contingent upon the availability of renewable energy sources and is represented mathematically through the utilization of a piecewise function:
| (5) |
In this context, the variable indicates the quantity of power generated by renewable energy sources within the same time period.
2.1.2 Costs incurred due to environmental emissions from thermal power generation units
During the operational processes of coal-fired power plants, the predominant emissions consist of sulfur dioxide and nitrogen oxides, which are considered as the principal pollutants. The evaluation of coal-fired power stations with respect to specific emissions will be carried out by relevant governmental agencies [14]. The present study makes use of a cost database specifically focused on desulfurization and denitrification procedures. By considering the cost of these operations per unit of electricity, the research estimates the associated environmental expenditures [15]. The equation that represents the environmental cost for a certain time period, indicated as t, may be written as follows:
| (6) |
Let S and N be the respective costs.
2.1.3 Upfront fixed investment costs for thermal power generation units
As a result, they may be regarded as constant values. This encompasses various expenses such as depreciation, operational expenditures, and maintenance costs, which consist of wages, benefits, supplies, repairs, and other related expenses. The equation representing the allocation of fixed costs associated with thermal power generation over a certain time period, denoted as t, may be expressed as follows:
| (7) |
In this context, and represent the fixed cost.
2.1.4 Upfront fixed investment costs for renewable power generation units
Renewable energy stations demonstrate low costs throughout the power generating process, mostly attributed to their dependence on sustainable resources. Nonetheless, the establishment of these stations necessitates a significant initial investment, leading to fixed costs emerging as the primary expense linked to renewable energy stations. The fixed costs include expenditures associated with the procurement of equipment, construction, basic reserves. In aggregate, fixed costs include the whole amount of these expenses. The current research examines renewable energy sources, namely wind farms and solar installations.
| (8) |
The variables fw and fp denote the annual fixed cost allocations for wind farms and solar facilities inside the integrated system, correspondingly.
| (9) |
The power generating enterprises engaged in competition exhibit a deficiency in innovative energy sources, and their primary goal may be expressed in mathematical terms as follows:
| (10) |
Production businesses have a common objective of maximizing their respective profits, leading to a non-cooperative game dynamic between them.
Here under the LCOE cost framework:
(1) New Energy and Thermal Power LCOE
| (11) |
The variables are defined as follows: stands for the initial investment cost in thousands of RMB; represents the annual operating and maintenance expenses incurred by the power generator; signifies the yearly depreciation of the power generator; denotes the net residual value of the power generator; symbolizes the annual electricity output measured in megawatt-hours (MWh) generated by the power generator; and represents the discount rate utilized for the power generator.
(2) Thermal Power Coal Consumption Surcharge
| (12) |
In the equation, , , c represent the coal consumption cost coefficients for power generation company j.
(3) Thermal Power Environmental Surcharge
| (13) | ||
| (14) | ||
| (15) | ||
| (17) | ||
| (18) | ||
The carbon emissions from thermal power units are calculated using the input-output method during the stages of coal combustion and desulfurization. This calculation encompasses the emissions of carbon dioxide, sulfur dioxide, nitrogen oxides during the combustion stage, and the carbon dioxide emissions produced from the desulfurization process using desulfurization carbonate during the desulfurization stage.
2.2 Large User Cost Optimization Model
Major clients primarily face two major expenses when participating in transactions: the cost of procuring power and the over-grid charge. In a hierarchical game model, the power producer initiates an offer to the major client, who plays a passive role by accepting the offer and then decides on the energy procurement option. This choice directly influences the power producer’s final profit, positioning it at a lower tier within the game. The cost optimization model for significant users during time “t” is formulated as follows:
| (20) |
In this context, the variable represents the cost per unit of energy for transmission and distribution. The variables , , and represent the initial bidding set, the set of parameters determining the increase of electricity prices, and the set of allocations for power consumption by major users, respectively.
2.3 Constraint Condition
2.3.1 Bidding range constraints of thermal power enterprises
Under annual bilateral agreements, coupling systems and competing power generation enterprises must adhere to predetermined initial bidding parameters. These constraints or limitations are delineated as follows:
| (21) |
Where: , are the upper and lower limits of the initial offer.
2.3.2 Power generation capacity limitations
The power generation industry has enforced an upper bound on its production capability within a specified timeframe, marked as ‘t.’ The subsequent segment delineates the specific constraints or limitations:
| (22) |
In the scenario where represents the maximum capacity of power generation company j during period t.
2.3.3 Large user power demand constraints
To effectively meet the electrical needs of significant clientele within a certain timeframe, it is essential that the aggregate energy transferred between power generating companies and these consumers matches the cumulative electricity demands of the latter.
| (23) |
Where: is the demand.
2.4 Data Processing
This paper selects a 500 kV grid connection point in a certain area of Liaoning Province, integrating a 1200 MW thermal power plant, a 300 MW offshore wind power plant, and a 400 MW photovoltaic power station into a unified market operation entity at that grid connection point. The paper sets three power generation companies, including the coupled system, to participate jointly in annual bilateral transactions. Apart from the coupled system, the other two competitive power generation companies are thermal power plants, with parameters identical to those within the coupled system’s functionality. The user side is unified as a single large electricity purchasing user, and both parties engage in transactions across 24 time periods within a typical day [20–22]. Considering the seasonal characteristics of the large user’s electricity load [24], this paper provides the typical electricity load for the large user on workdays, holidays, and weekends for each quarter.
Before conducting simulation calculations, an overall output fitting is performed for renewable energy sources within the coupled system. Based on historical scenario data, preliminary analysis reveals that wind power output exhibits significantly greater fluctuation compared to photovoltaic power and is greatly influenced by seasonal variations. Therefore, the scenarios for renewable energy output can be categorized into three wind periods: high, moderate, and low, considering their respective magnitudes.
Table 3 Renewable energy annual output division
| Scenario Division | Corresponding Months |
| High wind period | 3, 4, 5, 10, 11 |
| Moderate wind period | 1, 2, 12 |
| Low wind period | 6, 7, 8, 9 |
According to the improved k-means algorithm provided in Chapter 2, the SC validity index values were calculated for the three wind periods. The results are as follows:
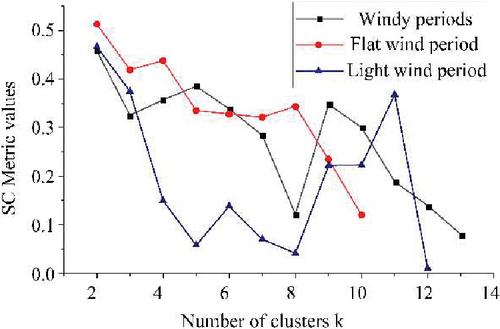
Figure 1 Changes of SC evaluation indicators under each number of clusters.
Based on the data shown in the aforementioned figure, it is evident that the evaluation index for SC attains its highest value during the three wind periods when the number of clusters, denoted as k, is assigned a value of 2. This suggests the optimal method of categorizing scenarios. Hence, it can be concluded that the value of is deemed to be the most ideal choice for the number of clusters. Following this, the k-means method was used to cluster typical scenario sets for renewable energy production during each wind phase throughout the year, as seen in the accompanying image.
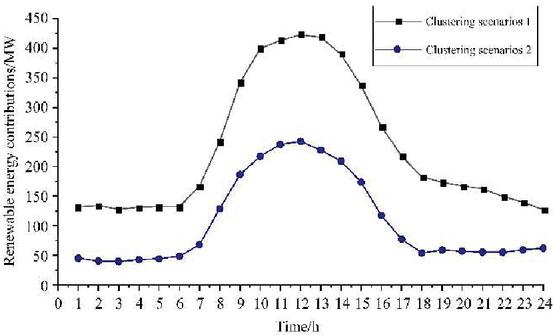
Figure 2 Typical curves of renewable energy generation during high wind periods.
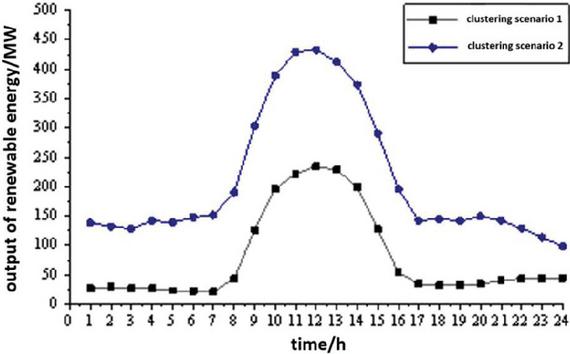
Figure 3 Typical curves of renewable energy generation during moderate wind conditions.
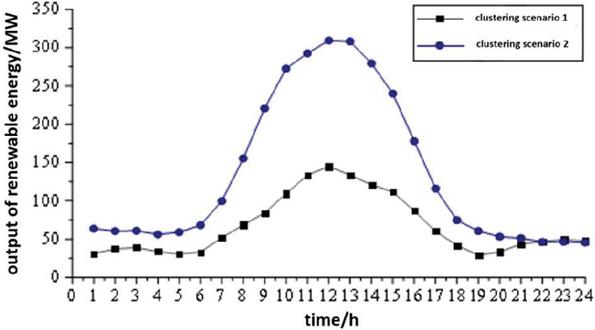
Figure 4 Typical curves of renewable energy generation during periods of low wind.
By using the predefined sets of average production scenarios and the accompanying usual daily power usage for major customers in each quarter, we generated a composite of renewable energy output scenarios that align with typical days over the whole year. The aforementioned situations were used as the beginning data circumstances for the purpose of solving the model.
2.5 Comparative Analysis of Coupling System Simulation
To highlight the benefits of the coupling system, this research sets up thermal power units with matching prices and performance standards as a point of reference. It then calculates the revenue generated within the annual bilateral trading market for comparative analysis. The aim of this comparison group is to assess and differentiate the advantages of the coupling system against the prevalent power source type in the current market. It’s essential to note the divergence between the annual bilateral transaction market demand and the power generation capacity of producing companies. This model in the paper scrutinizes the correlation between installed capacity of thermal power units and market demand. It finds that when the installed capacity exceeds market demand, the transaction price and volume are not influenced by the installed capacity. Instead, the transaction outcomes are mostly determined by the unit’s costs and performance characteristics. Hence, the establishment of thermal power units with equivalent costs and performance attributes to a reference serves as a means to assess the relative importance of the coupling system and thermal power as modes of market engagement.
3 Results
3.1 Contrast in Outcomes: Coupled Systems Versus Competing Enterprises in Market Transactions
Table 4 Market simulation results of coupling system
| Power Generation Companies | Average Transacted Electricity Price (Yuan/MWh) | Annual Electricity Turnover (Million MWh) | Total Profit (Yuan Million) |
| Coupling systems | 360.60 | 444.30 | 16797.00 |
| Competing Thermal Power Enterprise 1 | 365.60 | 296.20 | 10839.40 |
| Competing Thermal Power Enterprise 2 | 361.40 | 323.10 | 12253.30 |
Table 5 Market simulation results of thermal power reference group
| Power Generation Companies | Electricity Transaction Price (Yuan/MWh) | Annual Electricity Turnover (Million MWh) | Total Profit (Yuan Million) |
| Coupling systems | 362.00 | 367.00 | 7457.00 |
| Competing Thermal Power Enterprise 1 | 364.30 | 321.00 | 6885.00 |
| Competing Thermal Power Enterprise 2 | 362.10 | 376.00 | 5205.00 |
Table 6 Considering the coupled system of LCOE and the competitive cost of thermal power enterprises
| Power Generation Companies | Electricity Transaction Price (Yuan/MWh) | Annual Electricity Turnover (Million MWh) | Total Profit (Yuan Million) |
| Coupling systems | 310.30 | 707.0 | 15364.0 |
| Competing Thermal Power Enterprise 1 | 313.75 | 341.5 | 83764.0 |
| Competing Thermal Power Enterprise 2 | 314.46 | 387.5 | 97139.0 |
Table 7 Comparison between coupled and independent operation of each power source
| Forms of Market Participation | Electricity Transaction Price (Yuan/MWh) | Total Electricity Sold (Million MWh) | Independent Income in a Non-coupled State (Yuan Million) | Total Revenue (Yuan Million) |
| Coupling systems | 444.0 | – | – | 16797.0 |
| Coal-fired unit | 367.0 | 479.0 | 7457.0 | 4974 |
| Renewable energy unit | 112.0 | 2483.0 |
3.2 Analysis of Independent/Coupled Operation of Internal Power Sources within the Coupled System
The integration of renewable energy into the coupling system is responsible for decreasing its total marginal costs and allowing it to achieve higher market advantages at cheaper prices. Concurrently, it is seen that power production businesses engaged in competition tend to incur substantial financial losses when the coupling system is introduced into the market, suggesting a relationship between the adoption of the coupling system and market rivalry. Nevertheless, as seen in Table 5, when thermal power units with comparable specifications are used as a replacement for the coupling system in market simulations, these units continue to experience losses. This suggests that the impact of the coupling system on thermal power losses is only superficial, as the underlying cause can be attributed to thermal power companies frequently offering prices below benchmark rates in the annual bilateral trading market. The challenge of reducing costs associated with thermal power generation results in these companies making excessive concessions or even incurring losses. By capitalizing on its inherent benefit of reduced marginal costs, the coupling system effectively transforms losses into benefits, so substantially augmenting the proactive involvement of power production entities in the market.
The standalone thermal power units, renewable energy units, and internal units within the coupling system mirror each other entirely. The observed data suggests that the primary factor contributing to the higher electricity generation from independent participation of renewable energy and thermal power, as opposed to their participation in the coupling system, is the capability of thermal power units within the coupling system to allocate space for integrating renewable energy sources and offering adaptability for modulation. However, in terms of financial gains, independent thermal power production still faces deficits, hindering its ability to achieve overall profitability. By doing a comparative analysis, it becomes apparent that the integration of renewable energy and thermal power inside a unified market operating entity offers a viable option to address the prevailing deficit issues faced by independent thermal power production.
3.3 Economic Analysis Based on LCOE
When discussing the coupled system of wind, solar, and thermal power, the inherent synergies have raised concerns about its economic viability. This system integrates wind energy, solar power, and traditional thermal power generation to operate synergistically, reducing marginal costs and enhancing energy production efficiency. However, despite the theoretical potential, the practical situation is considerably intricate.
One of the key challenges lies in considering the LCOE (Levelized Cost of Energy) – the full life-cycle cost of electricity production. Particularly, the substantial initial investment costs for offshore wind and traditional thermal power pose limiting factors. While collaborative operation can moderately diminish marginal costs, it fails to alleviate the system’s profitability issues. Offshore wind projects face severe challenges in cost recovery due to their relatively high construction and operational costs, requiring an extended period for investment payback. Furthermore, the relatively lower internal rate of return for offshore wind projects adds further economic pressure to the system.
Within the wind, solar, and thermal power coupled system, both offshore wind and traditional thermal power possess their distinct advantages and drawbacks. Traditional thermal power usually enjoys more favorable conditions in investment recovery and internal rate of return due to lower infrastructure construction costs and relatively quicker investment returns. Conversely, operational and maintenance costs are higher for offshore wind projects, and due to technical and resource constraints, their internal rate of return tends to be more limited.
Moreover, offshore wind projects encounter challenges in technical reliability, environmental conditions, and marine resource management, which collectively impact the overall economic performance of the system, resulting in operational deficits.
Therefore, despite the theoretical appeal of the wind, solar, and thermal power coupled system, the economic challenges it faces in actual operation suggest that merely considering marginal costs is insufficient. A comprehensive life-cycle cost analysis of the system is imperative.
4 Conclusion
Additionally, a comparative assessment is performed to examine the advantages of these benefits in comparison to traditional market transactions and scenarios where the systems are not connected. The results of the investigation suggest that:
• Integrating renewable energy with thermal power within the electricity market effectively amalgamates their advantages. Renewable sources lower the overall marginal cost of the coupling system, while thermal power offers flexibility for integrating new energy sources internally within the system. The incorporation of the coupling system allows for the attainment of reduced marginal costs and improved power quality, hence boosting its competitiveness within the yearly bilateral trading market.
• In the annual market, the coupling system outperforms diverse power sources, yielding superior revenue. However, internal power sources operating independently within the coupling system encounter heightened grid regulation pressure compared to the system as a whole. Renewable energy incurs assessment costs due to deviations, a problem effectively addressed by the coupling system, which resolves issues related to low market share for renewable energy and losses for thermal power.
• Against the backdrop of the comprehensive reform of the national electricity market, integrating wind, solar, and thermal power into a coupling system at the same grid connection point allows for the full utilization of each power source’s complementary advantages. Through market-oriented approaches, this facilitates the integration of renewable energy, offering a feasible solution for the country’s strategic integration and development.
Acknowledgements
This research is supported by the National Key R&D Program of China (2019YFB1505400).
References
[1] W. S. Wang, W. S. Wang, W. F. Lin, G. Q. He, W. H. Shi, and S. L. Feng, “Implications of the texas 2021 blackout for new energy development in china,” Chinese Journal of Electrical Engineering, vol. 41, no. 12, p. 10, 2021.
[2] Z. Y. Zhuo, N. Zhang, X. R. Xie, Z. H. Li, and C. Q. Kang, “Key technologies and development challenges of high percentage renewable energy power systems,” Power Systems Automation, vol. 45, no. 9, p. 21, 2021.
[3] “Northeast regulatory bureau of the national energy administration. notice on the issuance of the rules for medium and long term trading of electricity in liaoning province,” http://dbj.nea.gov.cn/zwfw/zcfg/202102/t20210210\_4084066.html.
[4] “National energy bureau. announcement on the public consultation on the “national development and reform commission national energy administration’s guidance on the integration of wind, water, fire and storage and ‘integration of source, network, load and storage (draft for comments),” http://www.nea.gov.cn/2020-08/27/c\_139321964.htm.
[5] G. Cheng, F. Xu, B. Hu, L. Hao, L. Chen, G. P. Zhou, and Y. Min, “Study on the synergistic performance and combined design of integrated coupling of renewable energy and thermal power,” Grid Technology, 2021.
[6] Y. H. Song, M. L. Bao, Y. Ding, C. Z. Shao, and N. Shang, “A review of key points of china’s electricity spot market construction under the new electricity reform and related suggestions,” Chinese Journal of Electrical Engineering, vol. 40, no. 10, p. 15, 2020.
[7] F. X. Peng, X. Sui, S. B. Hu, and et al., “A joint wind and fire bidding strategy based on information-gap decision making,” Power Grid Technology, vol. 45, no. 09, 2021.
[8] T. Qu, X. L. Su, X. X. Yan, and Y. X. Tan, “A joint frequency regulation strategy for wind storage and fire based on frequency division principle and area control,” Electrical Measurement and Instrumentation, vol. 55, no. 20, p. 9, 2018.
[9] Z. F. Tan, Y. H. Song, H. J. Zhang, and J. C. Shang, “Large-scale wind power and thermal power joint outfeed system and its profit distribution model,” Power Systems Automation, vol. 37, no. 23, p. 8, 2013.
[10] S. Huang, W. X. Liu, Y. Chang, and Z. Q. Liu, “A game theory-based strategy for wind and fire bundling to participate in direct purchase by large customers,” Modern Electricity, vol. 37, no. 2, p. 9, 2020.
[11] C. Z. Wang, “Research on electricity pricing under bilateral trading model,” Ph.D. dissertation, Southwest Jiaotong University, 2016.
[12] D. B. Fang and X. A. Wang, “A two-party call auction model for electricity trading between generation companies and large consumers under the electricity market,” Power Grid Technology, no. 6, p. 5, 2005.
[13] S. L. Zhang, “Research on some issues of bilateral trading in the electricity market,” Ph.D. dissertation, South China University of Technology, 2011.
[14] “Ministry of environmental protection. notice on the issuance of the environmental protection tariff for coal-fired generating units and the regulation of the operation of environmental protection facilities,” https://www.mee.gov.cn/gkml/hbb/gwy/201404/t20140404\_270185.htm.
[15] Y. J. Liao, L. Wang, and W. B. Luo, “A study on the cost of flue gas desulphurization units in thermal power plants,” Power Construction, no. 04, pp. 82–86, 2007.
[16] C. Wu, B. T. Gao, Y. Tang, and Q. Wang, “A master-slave game-based model for bilateral contract trading between generators and large consumers,” Power Systems Automation, vol. 40, no. 22, p. 7, 2016.
[17] “Liaoning provincial development and reform commission. notice of the provincial development and reform commission on matters related to the adjustment of transmission and distribution prices and sales tariffs in the province,” http://fgw.ln.gov.cn/xw/wndt/202012/t20201201\_4039687.html.
[18] “Development and reform commission of the people’s republic of China. notice of national development and reform commission on improving the policy on feed-in tariff for onshore wind power and photovoltaic power generation,” https://www.ndrc.gov.cn/xxgk/zcfb/tz/201512/t20151224\_963536.html?code=\&state=123.
[19] “National development and reform commission of the people’s republic of China. answer to a reporter’s question on the new energy feed-in tariff policy in 2021,” https://www.ndrc.gov.cn/fggz/fgzy/shgqhy/202106/t202106151283289.html?code=\&state=1233.
[20] H. Wang, “Research on the distribution of benefits to stakeholders of ppp projects based on game theory,” Ph.D. dissertation, Tianjin University, 2012.
Biographies

Meng Yiqun, male, from Changchun City, Jilin Province, holds a master’s degree in Electrical Engineering from the University of Sydney. He is currently a doctoral candidate at Northeast Electric Power University, undertaking a joint training program at the University of California, San Diego from January 2023 to December 2023. His research focuses on electricity markets and low-carbon optimization operation of power systems.

Bian Guoliang, male, from Linyi City, Shandong Province, is currently a master’s degree candidate in Electrical Engineering at Northeast Electric Power University. His research focuses on electricity markets and low-carbon optimization operation of power systems.

Gu Yi, male, from Anqing City, Anhui Province, obtained a master’s degree in Power System and Automation from Tsinghua University in 2000. He is a senior engineer and currently serves as the Chief Engineer at State Grid Liaoning Electric Power Co., Ltd. His main research interests include planning, preliminary work, and investment in primary distribution networks.

Liu Chuang, male, born in 1985, holds a Ph.D. degree and is a professor. He is a doctoral/master’s supervisor and has been selected as an outstanding young scientific and technological talent in China’s power industry, as well as various other honors and awards. He is currently affiliated with Northeast Electric Power University.

Hu Bo, Ph.D., senior engineer, obtained his bachelor’s, master’s, and Ph.D. degrees from North China Electric Power University, the Shenyang Institute of Automation, Chinese Academy of Sciences in 1995, 2001, and 2013 respectively. He currently holds the position of Secretary and Deputy General Manager at State Grid Liaoning Electric Power Co., Ltd., Dalian Power Supply Company. His main research direction is power systems and their automation.

Zhou Guiping, Ph.D., senior engineer, obtained his bachelor’s, master’s, and Ph.D. degrees from Dalian University of Technology and the Shenyang Institute of Automation, Chinese Academy of Sciences in 2004, 2007, and 2012 respectively. He currently holds the position of Deputy Section Chief at State Grid Liaoning Electric Power Co., Ltd. His main research direction is power systems and their automation.

Luo Huanhuan, male, graduated from Shanghai Jiao Tong University with a bachelor’s degree in Power System and its Automation in 2001. He obtained a master’s degree in Electrical Engineering from Dalian University of Technology in 2009 and a Ph.D. degree in Electrical Engineering from Shenyang University of Technology in 2022. He is currently employed at Liaoning Electric Power Trading Center Co., Ltd. His main research direction is power system operation and power market trading.

Zhao Yuanzhu, female, obtained a master’s degree in Journalism and Communication in 2019. She currently works at State Grid Liaoning Electric Power Co., Ltd., Shenyang Yuhong District Power Supply Branch. Her main research direction is power market marketing.

Chang Yiming, female, holds a master’s degree in Power System and its Automation. She currently works at State Grid Liaoning Electric Power Co., Ltd., Shenyang Power Supply Company. Her main research direction is power market marketing.

Wang Zhonghui, male, obtained a master’s degree in Power System and its Automation from Dalian University of Technology in 2011. He currently works at State Grid Liaoning Electric Power Co., Ltd., Power Dispatch and Control Center. His main research direction is the construction of the electricity spot market and ancillary services market, as well as grid regulation and operation.
Strategic Planning for Energy and the Environment, Vol. 43_3, 641–664.
doi: 10.13052/spee1048-5236.4337
© 2024 River Publishers