Optimal Scheduling Strategy of Integrated Energy System for Electric Vehicles
Xiaojing Wu* and Jinghui Tan
Hebi Institute of Engineering and Technology, Henan Polytechnic University, Hebi, Henan 458030, China
E-mail: wuxiaojing91@163.com
*Corresponding Author
Received 23 May 2025; Accepted 21 July 2025
Abstract
The world’s energy transformation has entered a period of comprehensive acceleration. In the context of a large number of regional integrated energy (IE) system projects being implemented, aiming at the privacy protection issues and benefit distribution issues existing in the coordination and interaction of multi-park participation, this paper proposes a joint scheduling strategy of multi-IE park based on the mixed game principle, so as to improve the operation economy of coordinated multi-regional IE systems. The IE suppliers and park operators are constructed into a two-layer mixed game model. The upper layer consists of master-slave game relationship between energy suppliers and operators, and the lower layer consists of non-cooperative game relationship between park operators. Moreover, this paper uses kriging meta-model to transform the lower model. In addition, this paper combines experimental cases to verify the effect of the model. The verification results show that the joint scheduling strategy of multi-IE park proposed in this paper can effectively reduce the operating cost of the park. It brings benefits to the leader of multi-park scheduling, the setter of energy prices, and the comprehensive energy supplier, and stimulates the scheduling potential of electric vehicles (EV) and multiple energy storage equipment within each park.
Keywords: Electric vehicles, integrated energy, system optimization, scheduling.
1 Introduction
Electric vehicle is a new type of load with high flexibility and adjustability, the charging behavior of EV has significant temporal and spatial uncertainties. Charging a large number of EV during peak hours will cause the load to “peak on peak”, causing problems such as imbalance between power supply and demand and relay protection [1]. However, the charging load of EV has significant flexibility and adjustability. If the charging behavior of EV is guided through reasonable means so that they can be charged during peak new energy output or low power grid load, it can promote new energy. The role of consumption and stabilization of grid load.
Although the outstanding flexible and adjustable load characteristics and large-scale energy storage potential make EV attract attention in the construction and operation of new power systems, there are still a series of problems in the charging and discharging (CAD) management of EV at this stage. First of all, the randomness and uncertainty of individual charging behavior of electric vehicle users bring great difficulties to the CAD management of EV. Different from other forms of energy storage, the essence of EV is a means of transportation, and the first priority of EV is to meet users’ travel needs. Therefore, the uncertainty of users’ travel behavior leads to the uncertainty of electric vehicle CAD behavior. Secondly, the CAD response potential of EV is the boundary between the collaborative optimization and management of electric vehicle CAD, power grid and new energy. However, due to the uncertainty of users’ travel time, parking time, battery power and other factors [2], it is difficult to measure the CAD response potential of EV users, and the CAD response potential of EV is still unclear at this stage. Thirdly, the realization of collaborative management of CAD requires corresponding infrastructure support. Affected by the capacity of distribution network, some areas of the city cannot support the access of large-scale EV. There is an urgent need to allocate infrastructure resources under collaborative management of CAD of EV. Discuss. Finally, at present, the research on the collaborative optimization of electric vehicle CAD, power grid and new energy pays more attention to the discussion of electric vehicle CAD scheduling strategy, but ignores the discussion on the realization of CAD scheduling strategy [3].
Although the individual travel behavior and charging behavior of electric vehicle users are uncertain, the behavior law of electric vehicle users in different functional areas is relatively stable due to the law of life and production. It is necessary to construct a measurement model of electric vehicle charge and discharge response potential in different functional areas based on the charging spatio-temporal characteristics with the help of agent simulation analysis method. The time-sharing response potential of CAD of EV in different functional areas is clarified [4]. Considering the cost of charging facility construction and distribution network transformation, a collaborative optimization model of charging facilities and distribution network resource allocation considering charging response potential is constructed to provide a facility foundation for the realization of collaborative optimization of electric vehicle CAD operation. This paper combines the dual carbon goals and the new power system construction goals to build a collaborative optimization model for EV, power grids, and new energy operations with the goals of new energy consumption, grid load stability, and optimal CAD income of electric vehicle users. In general, the research in this paper can effectively promote the collaborative interaction and orderly development of EV, power grids and power supplies, and promote the transportation sector and power industry to make more contributions to carbon reduction.
The IE suppliers and park operators are constructed into a two-layer mixed game model. The upper layer consists of master-slave game relationship between energy suppliers and operators, and the lower layer consists of non-cooperative game relationship between park operators. Moreover, this paper uses kriging meta-model to transform the lower model, and combines particle swarm optimization to solve the mixed game model.
The purpose of this study is to address the privacy protection and benefit allocation issues in the coordination and interaction of multiple parks, and propose a joint scheduling strategy for multiple integrated energy parks based on the principle of mixed game theory, aiming to improve the economic efficiency of coordinating the operation of multi regional integrated energy systems. Compared with existing research, the advantage of this article lies in the construction of a two-layer mixed game model, combined with Kriging meta model and particle swarm algorithm for solving, which can effectively reduce regional operating costs while protecting the privacy of each region. At the same time, it can stimulate the scheduling potential of electric vehicles and multiple energy storage devices within each region, providing new ideas and methods for optimizing the scheduling of integrated energy systems.
With the comprehensive acceleration of the world’s energy transition, a large number of regional integrated energy system projects have been implemented. As a new type of load with high flexibility and adjustability, the promotion and application of electric vehicles bring opportunities and challenges to the construction and operation of new power systems. However, there are privacy protection and benefit distribution issues in the coordination and interaction involving multiple parks. In response to these issues, this article proposes a joint scheduling strategy for multiple integrated energy parks based on the principle of mixed game theory, aiming to improve the economic efficiency of coordinating the operation of multi regional integrated energy systems. The innovation of this article lies in the construction of a two-layer mixed game model, combined with Kriging meta model and particle swarm algorithm for solving, effectively reducing regional operating costs while protecting the privacy of each region. At the same time, it stimulates the scheduling potential of electric vehicles and multiple energy storage devices within each region, providing new ideas and methods for optimizing the scheduling of integrated energy systems.
2 Related Works
With the rapid growth of EV, not only can the demand for system frequency regulation capacity be reduced, but also the cost of electricity will be reduced. The research on the participation of EV in frequency modulation of power system can be divided into the following two aspects:
(1) Research status of CAD strategies of EV participating in grid-assisted frequency modulation
As a new energy carrier, electric vehicle has the characteristics of dispatchability, renewability and decentralization, and can be used as an important resource for power grid auxiliary frequency regulation. The main ways in which it participates in frequency modulation include static frequency adjustment, dynamic frequency adjustment, peak and valley adjustment, energy storage backup adjustment, etc. Several ways of participating in frequency modulation are combined with each other to form a variety of adjustment strategies to achieve better adjustment effects [5].
In terms of the research on the way and effectiveness of EV participating in frequency modulation, reference [6] calculated the frequency modulation capacity and battery loss, formulated the sub-charging plan for the mode of centralized charging and unified distribution, and conducted unified and centralized management of decentralized access of EV to the power grid. Reference [7] still used the centralized control mode of the above strategy. Considering the constraints of electric vehicle users’ travel demand and battery life, a centralized manager is established to calculate and analyze the adjustable capacity, and the simulation verifies that the frequency modulation of electric vehicle auxiliary power grid can improve the system performance. Reference [8] adopted the static frequency characteristic model of electric vehicle CAD to realize the effective conversion between distributed power supply and controllable load during electric vehicle frequency modulation, and realized the effective reduction of system frequency deviation through coordinated control. Reference [9] proposed an intelligent distributed V2G control scheme. This scheme assumes that the user sets the next usage time in advance when charging. Then, the system can adjust the frequency of the power grid by calculating the idle time of the electric vehicle, which effectively adjusts the system frequency and improves user satisfaction.
In terms of the CAD strategy for electric vehicle-assisted frequency regulation, in order to address the problem of a large number of EVs participating in the secondary frequency regulation of the power grid, reference [10] set up an aggregator between EV and their control center, adds planned charging, and calculated the total frequency regulation capacity based on communication data and allocated it to each electric vehicle on the basis of meeting user needs. Reference [11] proposed an uncertain scheduling when the vehicle charge and discharge information is unknown. Through real-time power correction, the state of charge of electric vehicle (SOC) gradually meets the expectation. The simulation results show that EV can meet the expectations of car owners when off-grid. In order to avoid battery degradation caused by frequent CAD after EV participate in frequency modulation, reference [12] proposed to allocate frequency modulation power signals according to capacity proportion, which ensured the battery health of EV on the basis of realizing grid frequency regulation. Reference [13] used game theory to encourage electric vehicle owners to choose to participate in power grid frequency regulation, which promoted the formation of optimal social welfare through cooperation and information exchange, and also ensured the inhibition effect of V2G on system fluctuations. The above strategies all study the CAD of EV while EV participate in system frequency modulation to ensure the needs of electric vehicle users.
(2) Research status of optimal scheduling of IE systems
In the existing research on optimal scheduling of IE systems, the research methods can generally be divided into deterministic and uncertain optimization. The parameters in deterministic optimization are all certain, such as the determined wind and solar power output and load demand obtained based on historical data. Reference [14] established a decentralized scheduling model of multi-regional IE system, decomposed the IE system by tie line cutting and regional overlap method, and solved it based on approximate Newton method. Reference [15] introduced waste heat power generation and carbon capture devices on the source side of the IE system to decouple the constraint of “determining electricity by heat”, reduce carbon emissions, and effectively reduce system scheduling costs.
However, in the actual operation of the IE system, data such as wind and solar output and load are often in a fluctuating state, and deterministic optimization is difficult to achieve the expected control effect. Therefore, in order to avoid the influence of source-load prediction error on the system stability, it is of great significance to study the IE system taking into account the source-load uncertainty[16].
Stochastic programming uses probabilistic model to describe random parameters, and transforms uncertain model into deterministic model for solution. Reference [17] used Monte Carlo model method to generate typical scenarios, Reference [18] took into account the external network, users and IE system, and constructed a stochastic optimization model of the system in independent and cooperative ways. On this basis, a tripartite benefit redistribution model is constructed, which effectively and evenly distributes the interests of all parties.
However, the natural characteristics of renewable energy are difficult to control, and its accurate probability distribution cannot be obtained, so errors may occur in stochastic programming. At the same time, stochastic programming needs to generate a large number of scenes, which greatly reduces the computational efficiency. Although the use of technologies such as scene reduction can reduce the computational amount to a certain extent, the computational accuracy will be lost [19]. This challenges the practical application of stochastic optimization. Robust optimization is a pre-analysis method. Moreover, it is more important in practical application scenarios to characterize uncertain parameters by constructing uncertain sets, and then solve the optimal control under uncertain sets. Reference [20] established a robust control optimization model and introduced a variety of demand responses to fully absorb renewable energy.
In addition, many scholars have also introduced comprehensive demand response, carbon trading mechanism and EV to participate in system scheduling. Reference [21] built a comprehensive demand response and stepped carbon trading cost model based on the scheduling model to effectively reduce system operating costs and restrict carbon emissions. Reference [22] proposed a dynamic electricity price strategy to guide EV to participate in system scheduling, which gave full play to the potential of peak shaving and valley filling of EV and reduced the carbon emissions of the system.
Electric vehicles have become an important resource for grid frequency regulation due to their flexibility and renewability, effectively assisting grid frequency regulation through different charging and discharging strategies. The optimization and scheduling of integrated energy systems involve both deterministic and uncertain optimization methods. Random programming and robust optimization improve system stability by handling uncertain parameters, while introducing strategies such as comprehensive demand response, carbon trading mechanisms, and electric vehicles further enhance system economy and low-carbon performance. These studies provide theoretical support and practical basis for the optimization and scheduling strategies of integrated energy systems for electric vehicles.
Frequency stability is very important for the power system, directly affecting the safe and stable operation of the power system and the quality of power supply. As a new energy carrier, electric vehicles have become an important resource for grid assisted frequency regulation due to their dispatchability, renewability, and decentralization characteristics. Current research mainly focuses on the charging and discharging strategies of electric vehicles participating in grid assisted frequency regulation, improving system performance and meeting user needs through various methods such as static frequency regulation, dynamic frequency regulation, peak valley regulation, and energy storage backup regulation. However, these studies mostly focus on the effectiveness of frequency modulation strategies, neglecting the complexity and practical operability of electric vehicle charge and discharge management and coordinated optimization with the power grid and new energy.
In terms of optimizing the scheduling of integrated energy systems, existing research is mainly divided into deterministic and uncertain optimization. Deterministic optimization is based on historical data, but it is difficult to cope with fluctuations in wind and solar power output and load during actual operation. Random programming and robust optimization methods in uncertainty optimization, although improving system stability, may introduce errors due to inaccurate probability distributions and have lower computational efficiency; Robust optimization solves optimal control by constructing an uncertain set, but further optimization is still needed in practical applications. In addition, although many scholars have introduced strategies such as comprehensive demand response, carbon trading mechanisms, and electric vehicles to improve system economy and low-carbon performance, research on privacy protection and benefit distribution issues in multi park coordination and interaction is still insufficient.
The progressiveness of this study lies in that, in view of the privacy protection and benefit distribution problems in the coordination and interaction of multiple parks, a joint scheduling strategy for multiple integrated energy parks based on the mixed game theory is proposed. By constructing a two-layer mixed game model and combining Kriging meta model and particle swarm algorithm for solving, not only can operating costs be reduced while protecting privacy in various regions, but the scheduling potential of electric vehicles and multiple energy storage devices can also be effectively stimulated, providing new ideas and methods for optimizing the scheduling of integrated energy systems.
3 Comprehensive Energy Optimization Scheduling
A distributed coordination optimization strategy of multi-regional IE system is proposed, which takes the IE supplier as the upper leader, and sets the energy price to guide the lower regional operators to optimize the regional operation. The two constitute a master-slave game relationship. In order to protect their privacy, the lower-level regions do not interact with each other in information or energy, and pursue the minimum regional operating cost in a non-cooperative game manner. Afterwards, without reducing the accuracy of the model, the lower-level regional models are converted into Kriging meta models. The meta-model optimization algorithm is an algorithm that drives the iterative update of the sample set based on historical data to obtain the global optimal solution, which can simplify the model solving process. At present, it is most widely used in the aerospace field, and has preliminary applications in power systems.
Section 3.1 establishes the basic model of the integrated energy system and clarifies the energy flow and conversion mechanisms within the system; Based on this, Section 3.2 constructs a dual layer game model for coordinated operation in multiple regions. The upper layer is the master-slave game between comprehensive energy suppliers and regional operators, while the lower layer is the non cooperative game between regional operators. The model aims to optimize energy prices and system operating costs; Section 3.3 proposes a method of using Kriging meta model combined with particle swarm optimization algorithm to solve the two-layer game model, ensuring efficient solution of the model while protecting the privacy of each region. The three parts support each other, from model establishment to problem definition, and then to solution methods, forming a complete optimization scheduling strategy framework.
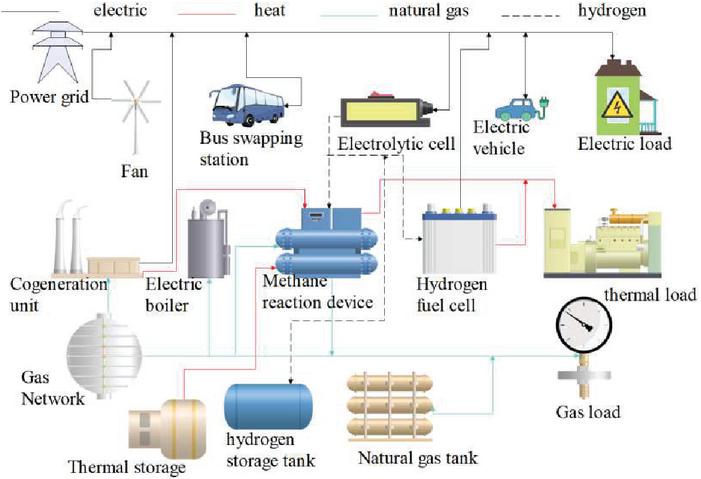
Figure 1 Regional energy flow framework.
3.1 IE Basic Model
Energy purchase from superior energy networks and regional wind turbine power generation are the sources of regional energy. Electric boilers, combined heat and power units and two-stage P2G equipment: electrolyzers, hydrogen fuel cells and methanation reactors realize comprehensive energy coupling and energy form conversion in the region. Meanwhile, regional bus battery swap stations replace traditional energy storage power stations, and energy storage thermal stations, hydrogen storage tanks and natural gas tanks form multiple energy storage equipment in the region.The user’s heat demand is provided locally by the equipment in the region. It is worth mentioning that the energy produced in the region is completely consumed in the region. The established regional comprehensive energy flow framework is shown in Figure 1.
Figure 2 also shows the internal energy flow of the comprehensive energy region. Regional operators purchase energy from comprehensive energy suppliers and distributed wind turbines generate electricity are the sources of regional energy. Electric boilers and combined heat and power units are used in the region to realize comprehensive energy coupling and energy form conversion in the region. Secondly, multi-element energy storage devices consist of storage power stations, heat storage stations and natural gas tanks. Users in the region actively respond to operators’ scheduling strategies, adjust energy consumption behaviors, and use intelligent terminals to control EV to interact with the power grid, enabling them to participate in comprehensive energy demand response.
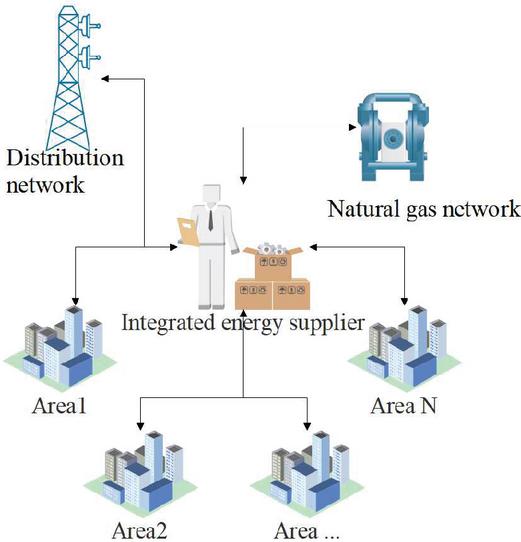
Figure 2 Multi-regional coordination operation mechanism.
3.2 Multi-regional Coordinated Operation Two-level Game Model
The upper-level IE supplier obtains energy from the distribution network and natural gas network, sells it to the lower-level regions, and coordinates the operation of each region in order to maximize the income. The energy price it sets is the key to enabling regional operators to conduct energy transactions with them.The upper limit of the energy purchase price set by the supplier can be greater than the price published by the energy network. However, in order for regional operators to choose to conduct energy transactions with the supplier, the lower limit of the electricity sales price set by the supplier must also be greater than the price published by the energy network, while the natural gas price must meet the market transaction rules. The electricity price and natural gas price set by the comprehensive energy supplier should meet the following constraints:
| (1) | |
| (2) | |
| (3) |
In the formula, and represent the electricity purchase and sales prices at time t announced by the distribution network, Yuan/kWh, represents the natural gas price at time t announced by the natural gas network, Yuan/m, and represent the electricity purchase and sales prices at time t set by the energy supplier, Yuan/kWh, is the natural gas purchase price at time t set by the energy supplier, Yuan/m, and represent the upper and lower price limit coefficients, and represents the total number of scheduling periods in the scheduling cycle.
The objective function of the energy supplier includes the energy purchase cost from the distribution network and natural gas network and the energy sales income to the lower region, as follows:
| (4) |
In the formula, represents the set of regions, and represent the energy purchase and sale of region i to energy suppliers at time t, kW, and and represent the energy purchase and sale of suppliers to the superior energy network at time t, kW. The relationship between the energy purchase and sale of regional operators and IE suppliers and the energy purchase and sale of suppliers and superior energy networks is as follows:
| (5) | |
| (6) |
represents the purchase and sale of energy by regional operators and IE suppliers, and represents the purchase and sale of energy by suppliers and superior energy networks.
When the lower-level operator optimizes regional operation, it needs to meet the feasible operation domain of each device, use multi-energy complementarity and cascade utilization of energy to ensure that the electricity, heat and natural gas loads required by users in the region are met. The comprehensive energy power balance constraints in the region are as follows:
| (7) | |
| (8) | |
| (9) |
and respectively represent the maximum charging power and the maximum discharging power of the energy storage power station;
represents the electric power output by the fan at time t, kW;
and respectively represents the heat storage power and the heat release power of the energy storage thermal station at time t, kW;
and respectively represents the gas storage power and the gas bleeding work rate of the natural gas tank at time t, kW;
represents the elastic electrical load in the user’s daily energy load at time t, kW;
represents the inelastic electrical load in the daily energy load of the user at time t, kW;
represents the elastic natural gas load in the user’s daily energy load at time t, kW;
represents the inelastic natural gas load in the user’s daily energy load at time t, kW;
represents the charging power of the i-th electric vehicle at time t;
represents the discharge power of the i-th electric vehicle at time t;
represents the input electric power of the electric boiler at time t, kW;
represents the natural gas power input by the cogeneration unit at time t, kW;
represents the elastic electrical load in the user’s daily energy load at time t, kW;
represents the inelastic electrical load in the daily energy load of the user at time t, kW;
The purpose of operators to optimize regional operations is to minimize regional operating costs, including energy purchase costs and energy equipment operating costs, as follows:
| (10) |
3.3 Solution of Multi-regional IE System Game Model
In this paper, Kriging meta-model combined with particle swarm optimization is used to solve the game model, and the solution flow is shown in Figure 3.
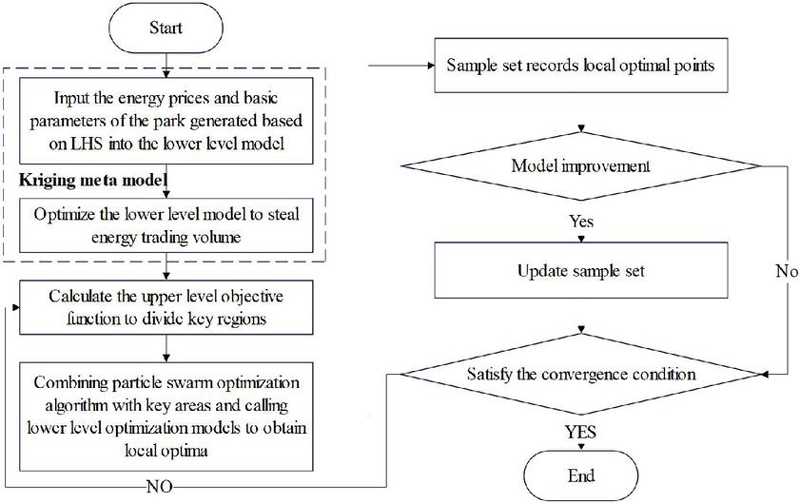
Figure 3 Game model solution process.
The meta-model is an approximate model that replaces the complex optimization model, that is, the model of the model. Although the meta-model simplifies the model, it can still ensure the calculation accuracy, reduce the number of calculation iterations, and improve the solution speed. Its core lies in the special sampling method to collect sample points to construct a mathematical model similar to the original model. For the two-tier game model proposed in this paper, it is to simplify and explicit the implicit mapping relationship between the energy price set by the upper supplier and the energy transaction volume of the lower operator. Firstly, Latin hypercube sampling (LHS) is used to generate energy price input into the lower regional operator model, and then the lower model is converted into Kriging meta-model by taking the regional energy trading volume as the output, as follows:
| (11) |
The two-level master-slave game model is transformed into:
| (12) |
Because of the poor fitting accuracy of the initial generated Kriging model, according to the supplier revenue calculated from the sample data, the sample set is divided into several regions, and the region with the lowest probability of optimal solution appearing (the region with small supplier revenue) is eliminated to improve the optimization efficiency. In the remaining areas, the particle swarm algorithm is used to optimize the Kriging model to find the local optimal point of the optimal energy price and energy trading volume, and the local optimal point is updated to the sample set. The optimization is iterated until the convergence conditions are met to obtain the global optimal solution. The lower-level optimization is solved by calling Gurobi in MATLAB through Yalmip.
4 Experimental Analyses
4.1 Experimental Methods
The experimental data in this article mainly comes from actual power grid operation data in a certain region, historical load data of electric vehicle charging stations, and operating parameters of typical integrated energy systems. Data preprocessing includes: outlier detection and cleaning of raw data, using the 3 criterion to remove outliers; Complete missing data through linear interpolation method; Normalize the fluctuation data of wind and solar power output; Divide the charging demand of electric vehicles into typical patterns such as base load and peak load according to time series; Finally, the K-means clustering algorithm is used to extract typical daily load curves as simulation inputs. All data have been desensitized and converted to a uniform time resolution (15 minutes/point) to ensure model applicability.
The example sets up three industrial areas, the scheduling operation cycle is one day, the scheduling period is divided into 24 periods, and the on-grid energy price and the energy selling price are determined in advance by the distribution network and the natural gas network. Among them, the upper limit of the electricity price set by the IE supplier is set to , the lower limit is set to , and the upper limit of the natural gas price set is set to , and the lower limit is set to . In order to facilitate analysis and calculation, according to the parking time of EVs, EVs are divided into three categories. The first category of EVs is equipped with 160 vehicles, and the parking time is 00:00–6:00 and 22:00–24:00. The second category of EVs is equipped with 120 vehicles, and the parking time is 00:00–8:00 and 20:00–24:00. The third category of EVs is equipped with 60 vehicles, and the parking time is 8:00–20:00. There are 25 regional buses (with 25 spare batteries) and the operating hours are 6:00–22:00. At the same time, this paper assumes that battery replacement only occurs during non-operating hours, the battery capacity is 250 kWh, the rated charge and discharge power is 60 kW, and the charge and discharge efficiency is 95%.Region-related parameters are shown in Tables 1–9. In order to verify the effectiveness of the proposed energy pricing strategy, this section formulates two scheduling strategies for comparative analysis:
(1) Energy suppliers do not optimize energy prices, and the three regional operators each optimize regional operations according to the energy purchase and sale prices published by distribution networks and natural gas networks;
(2) Energy suppliers optimize prices based on the energy price formulation strategy proposed in this paper, and the three regions operate in a coordinated manner.
Table 1 Output forecast value and load data of wind power in region 1
| Time | Wind | Electric | Natural Gas | Heat | Time | Wind | Electric | Natural Gas | Heat |
| (Hour) | Power (kw) | Load (kw) | Load (kw) | Load (kw) | (Hour) | Power (kw) | Load (kw) | Load (kw) | Load (kw) |
| 1 | 9256.5 | 8224.92 | 2512.62 | 5527.17 | 13 | 3049.2 | 12501.72 | 3797.64 | 3684.78 |
| 2 | 8989.2 | 8224.92 | 2013.66 | 4642.11 | 14 | 2811.6 | 11843.37 | 3298.68 | 3224.43 |
| 3 | 8533.8 | 7073.55 | 1653.3 | 4084.74 | 15 | 2772 | 12172.05 | 3407.58 | 4605.48 |
| 4 | 7791.3 | 7402.23 | 1789.92 | 3987.72 | 16 | 2930.4 | 12337.38 | 3627.36 | 5066.82 |
| 5 | 6930 | 7895.25 | 2376 | 3884.76 | 17 | 2989.8 | 12994.74 | 3902.58 | 5296.5 |
| 6 | 6187.5 | 9704.97 | 3247.2 | 3781.8 | 18 | 2673 | 12666.06 | 4205.52 | 5527.17 |
| 7 | 5148 | 11020.68 | 3140.28 | 5066.82 | 19 | 2554.2 | 12830.4 | 4702.5 | 5756.85 |
| 8 | 4207.5 | 12501.72 | 3859.02 | 4933.17 | 20 | 3385.8 | 12666.06 | 5033.16 | 6218.19 |
| 9 | 3207.6 | 12666.06 | 4134.24 | 5162.85 | 21 | 4791.6 | 12172.05 | 4894.56 | 6218.19 |
| 10 | 2791.8 | 13817.43 | 4187.7 | 5296.5 | 22 | 6316.2 | 10527.66 | 4670.82 | 5066.82 |
| 11 | 3207.6 | 14310.45 | 4013.46 | 4605.48 | 23 | 7850.7 | 8717.94 | 3896.64 | 5102.46 |
| 12 | 3564 | 14640.12 | 3991.68 | 4605.48 | 24 | 8811 | 8060.58 | 3011.58 | 5139.09 |
Table 2 Output forecast value and load data of wind power in region 2
| Time | Wind | Electric | Natural Gas | Heat | Time | Wind | Electric | Natural Gas | Heat |
| (Hour) | Power (kw) | Load (kw) | Load (kw) | Load (kw) | (Hour) | Power (kw) | Load (kw) | Load (kw) | Load (kw) |
| 1 | 4153.05 | 18889.2 | 5528.16 | 13970.88 | 13 | 4427.28 | 36471.6 | 8354.61 | 9646.56 |
| 2 | 3973.86 | 18057.6 | 4430.25 | 14303.52 | 14 | 4587.66 | 32194.8 | 7256.7 | 7983.36 |
| 3 | 4043.16 | 16513.2 | 3637.26 | 16133.04 | 15 | 4607.46 | 29343.6 | 7496.28 | 5322.24 |
| 4 | 4243.14 | 17820 | 3938.22 | 13804.56 | 16 | 4764.87 | 28987.2 | 7980.39 | 2827.44 |
| 5 | 4282.74 | 19602 | 5227.2 | 13139.28 | 17 | 4649.04 | 27086.4 | 8585.28 | 5987.52 |
| 6 | 4091.67 | 22809.6 | 7143.84 | 11309.76 | 18 | 4510.44 | 24472.8 | 9252.54 | 6985.44 |
| 7 | 3979.8 | 25660.8 | 6908.22 | 9812.88 | 19 | 4237.2 | 26254.8 | 10345.5 | 10145.52 |
| 8 | 3488.76 | 26492.4 | 8490.24 | 10145.52 | 20 | 4030.29 | 28749.6 | 11073.15 | 11476.08 |
| 9 | 3141.27 | 28393.2 | 9095.13 | 10038.6 | 21 | 3994.65 | 30650.4 | 10768.23 | 12141.36 |
| 10 | 3250.17 | 30175.2 | 9212.94 | 9979.2 | 22 | 4117.41 | 30056.4 | 10276.2 | 12307.68 |
| 11 | 3732.3 | 31244.4 | 8829.81 | 9480.24 | 23 | 4105.53 | 24710.4 | 8572.41 | 13305.6 |
| 12 | 4151.07 | 34095.6 | 8781.3 | 7983.36 | 24 | 4177.8 | 23522.4 | 6625.08 | 13638.24 |
Table 3 Output forecast value and load data of wind power in region 3
| Time | Wind | Electric | Natural Gas | Heat | Time | Wind | Electric | Natural Gas | Heat |
| (Hour) | Power (kw) | Load (kw) | Load (kw) | Load (kw) | (Hour) | Power (kw) | Load (kw) | Load (kw) | Load (kw) |
| 1 | 51805.71 | 24948 | 8291.25 | 24079.77 | 13 | 24261.93 | 29334.69 | 12532.41 | 15064.83 |
| 2 | 53296.65 | 24948 | 6644.88 | 24659.91 | 14 | 25998.39 | 29334.69 | 10886.04 | 14776.74 |
| 3 | 51714.63 | 25222.23 | 5455.89 | 24084.72 | 15 | 26902.26 | 29334.69 | 11245.41 | 14584.68 |
| 4 | 45263.79 | 25496.46 | 5906.34 | 24563.88 | 16 | 26484.48 | 28237.77 | 11970.09 | 15160.86 |
| 5 | 41913.63 | 26044.92 | 7840.8 | 24180.75 | 17 | 28735.74 | 29334.69 | 12878.91 | 15832.08 |
| 6 | 39971.25 | 27140.85 | 10715.76 | 23892.66 | 18 | 31064.22 | 29883.15 | 13877.82 | 19382.22 |
| 7 | 33130.35 | 28512 | 10363.32 | 23316.48 | 19 | 34301.52 | 31801.77 | 15518.25 | 22549.23 |
| 8 | 30210.84 | 29334.69 | 12734.37 | 21013.74 | 20 | 37781.37 | 33172.92 | 16609.23 | 27346.77 |
| 9 | 29038.68 | 31253.31 | 13643.19 | 20342.52 | 21 | 36336.96 | 33172.92 | 16151.85 | 29937.6 |
| 10 | 28979.28 | 32076 | 13819.41 | 18903.06 | 22 | 38498.13 | 30430.62 | 15413.31 | 29649.51 |
| 11 | 26631.99 | 29883.15 | 13244.22 | 18134.82 | 23 | 43877.79 | 29060.46 | 12859.11 | 29074.32 |
| 12 | 23481.81 | 29334.69 | 13172.94 | 15928.11 | 24 | 49857.39 | 27689.31 | 9938.61 | 27922.95 |
Table 4 Parameters of energy storage equipment in region 1
| Energy Storage Device | |||||||||
| Energy storage power station | 1980 | 0.198 | 0.891 | 792 | 990 | 0.9405 | 0.9405 | 0.00297 | 0.0099 |
| Natural gas tank | 2970 | 0.198 | 0.891 | 1485 | 2079 | 0.8415 | 0.8415 | 0.00495 | 0.01584 |
| Energy storage heat station | 2475 | 0.198 | 0.891 | 1237.5 | 1485 | 0.9405 | 0.9405 | 0.00297 | 0.05841 |
| Note: is the total energy storage capacity, kWh; is the minimum state of charge; is the maximum state of charge; is the maximum charging power, kW; is the maximum discharge power, kW; is the charging efficiency; is the discharging efficiency; is the self-loss coefficient of the energy storage power station; is the operation and maintenance cost coefficient of the energy storage equipment, Yuan/kWh. | |||||||||
Table 5 Parameters of energy storage equipment in region 2
| Energy Storage Device | |||
| Energy storage power station | 3960 | 1584 | 1980 |
| Natural gas tank | 5940 | 2970 | 4455 |
| Energy storage heat station | 4950 | 2475 | 2970 |
Table 6 Parameters of energy storage equipment in region 3
| Energy Storage Device | |||
| Energy storage power station | 5940 | 2376 | 2970 |
| Natural gas tank | 8910 | 4455 | 6237 |
| Energy storage heat station | 7425 | 3712.5 | 4455 |
Table 7 EV parameters in different region
| Region 1 | Region 2 | Region 3 | |||
| (Vehicles) | (Vehicles) | (Vehicles) | |||
| Electric vehicle | 0.35 | 4.4 | 160 120 60 | 320 240 180 | 480 360 240 |
| Note: and are the expected value and standard deviation of daily mileage d, respectively. | |||||
Table 8 Parameters of electric boiler
| Numerical Value | |||
| Parameter | Region 1 | Region 2 | Region 3 |
| 7920 | 11880 | 23760 | |
| 1188 | 1782 | 3564 | |
| 2376 | 3564 | 4752 | |
| 0.7425 | |||
| 0.01782 | |||
| Note: is the maximum input power of the electric boiler, kW; and are the upper and lower limits of the electric boiler’s ramp power, kW; is the heat production efficiency of the electric boiler; is the operation and maintenance cost coefficient of the electric boiler, Yuan/kWh. | |||
Table 9 Parameters of electric boiler
| Numerical Value | |||
| Parameter | Region 1 | Region 2 | Region 3 |
| 11880 | 23760 | 23760 | |
| 2376 | 4752 | 4752 | |
| 2376 | 4752 | 4752 | |
| 0.3465 | |||
| 1.7622 | |||
| 0.0131571 | |||
| 0.00000297 | |||
| 0.1485 | |||
| Note: is the maximum value of the natural gas input power of the cogeneration unit, kW; and are the upper and lower limits of the ramp power of the cogeneration unit, kW; and are the heat generation efficiency and power generation efficiency of the cogeneration unit, respectively; is the operation and maintenance cost coefficient of the cogeneration unit, Yuan/kWh; is the operation and maintenance cost coefficient of the cogeneration unit, Yuan /(kWh)2; is the heat-to-electricity ratio coefficient of the cogeneration unit. | |||
4.2 Results
The energy purchase and sale prices under distribution network, natural gas network and scheduling strategy 2 are shown in Figure 4. According to the energy price, each regional operator interacts with the IE supplier for energy, and the energy trading results are shown in Figures 5 and 6.
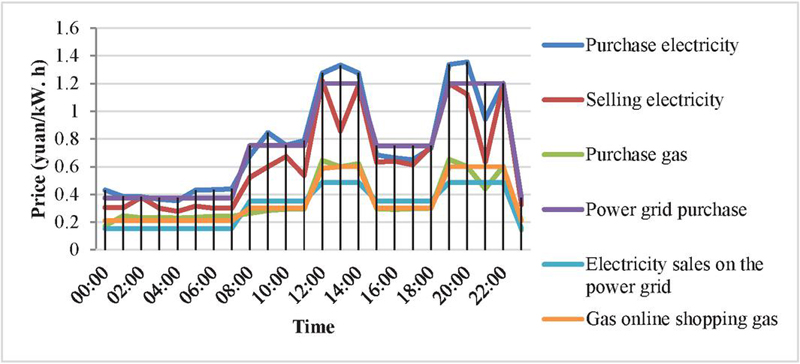
Figure 4 Energy price optimization results.
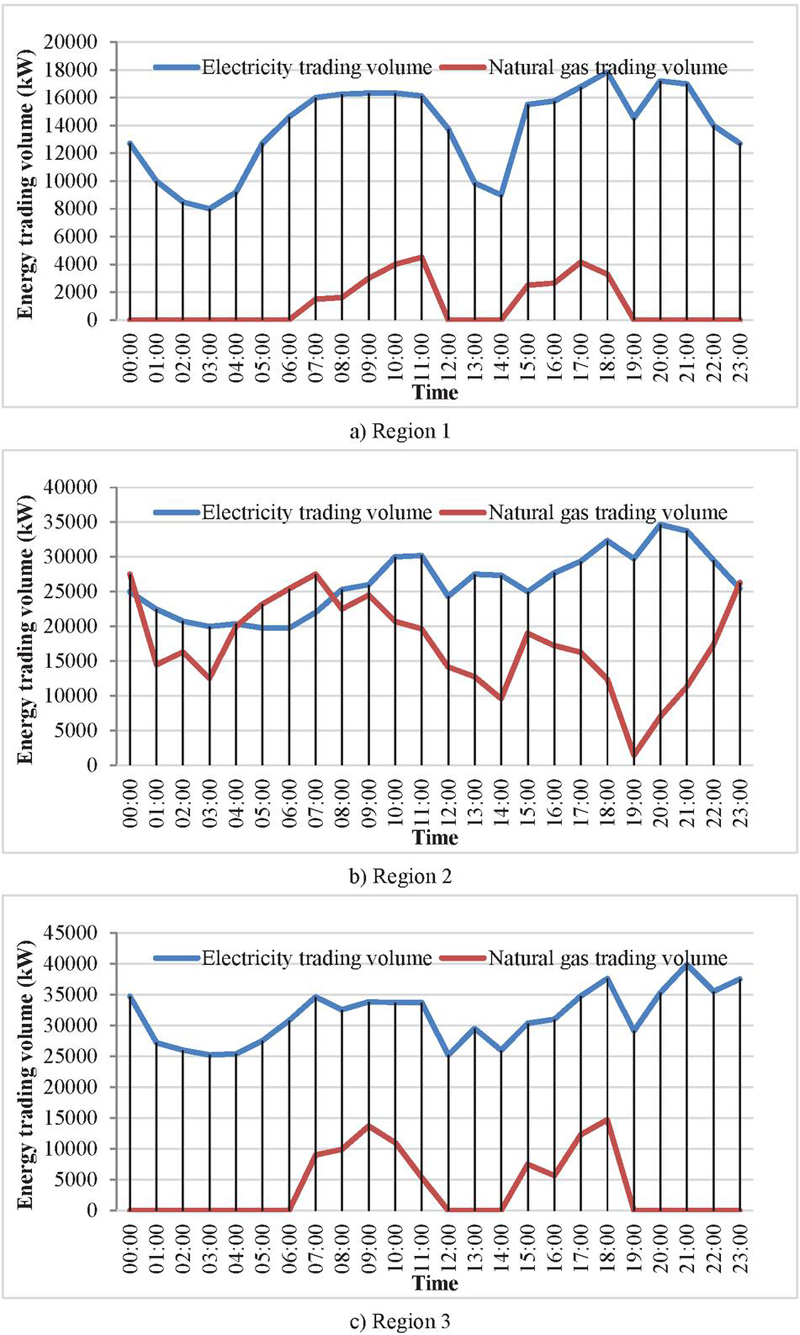
Figure 5 Energy trading volume of strategy 1.
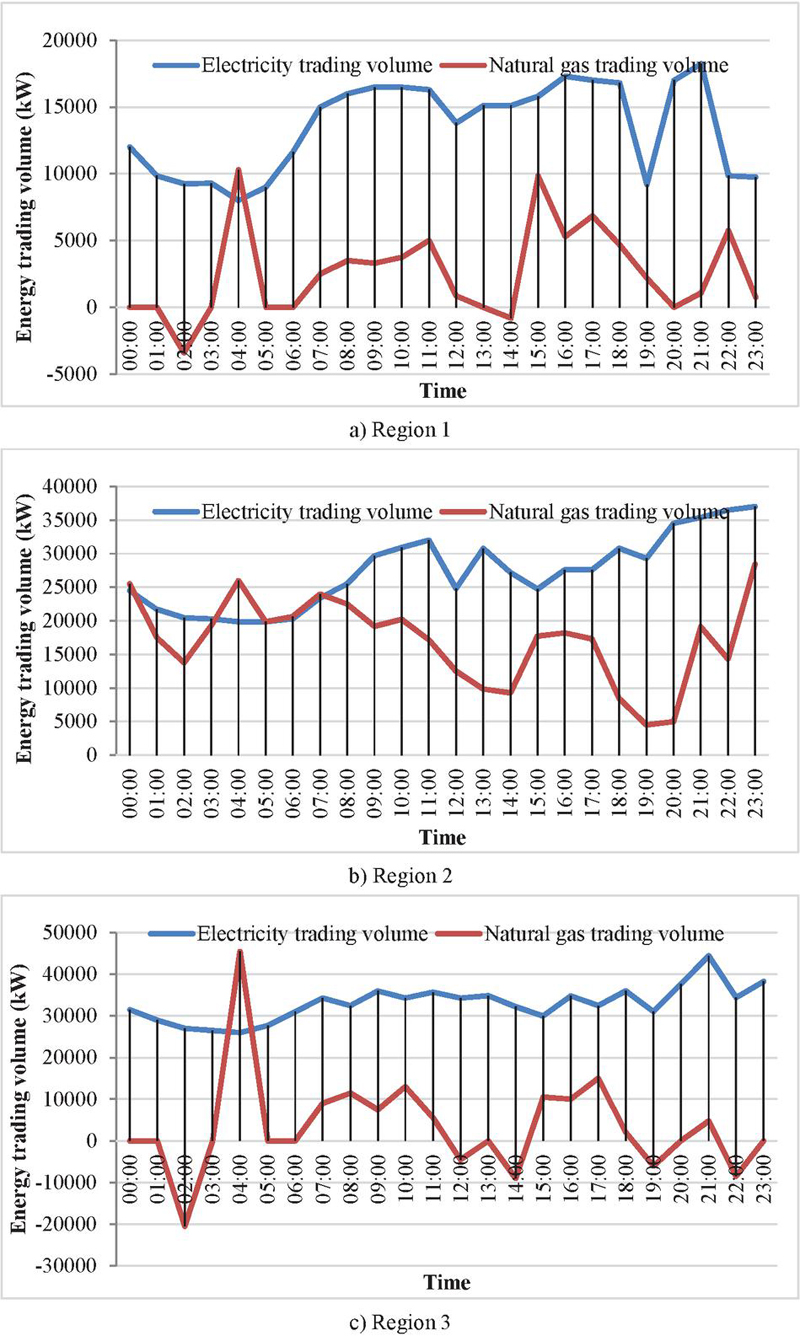
Figure 6 Energy trading volume of strategy 2.
The operating costs of each region under the two scheduling strategies are shown in Table 10.
Table 10 Regional operating costs
| Strategy 1 | Strategy 2 | |||
| Total Operating | Total Energy | Total Operating | Total Energy | |
| Cost/Yuan | Purchase Cost/Yuan | Cost/Yuan | Purchase Cost/Yuan | |
| Region 1 | 233,733.75 | 152,288.33 | 228,860.58 | 148,055.69 |
| Region 2 | 652,330.50 | 501,197.99 | 646,876.59 | 492,275.03 |
| Region 3 | 760,567.40 | 325,727.03 | 748,225.96 | 308,882.28 |
In order to verify the efficiency of Kriging meta-model combined with particle swarm optimization, this section compares the solution results obtained by this algorithm with those obtained by the traditional particle swarm algorithm. The comparison of statistical results of the two algorithms is shown in Table 11, and the convergence process of the optimal solution is shown in Figure 7.
Table 11 Comparison of statistical results of algorithms
| Revenue of | Number of | |
| Algorithm | IE Suppliers/Yuan | Iterations/ |
| Particle swarm optimization | 24143.526 | 1776 |
| Kriging meta-model combined with particle | 23894.244 | 116 |
| swarm optimization |
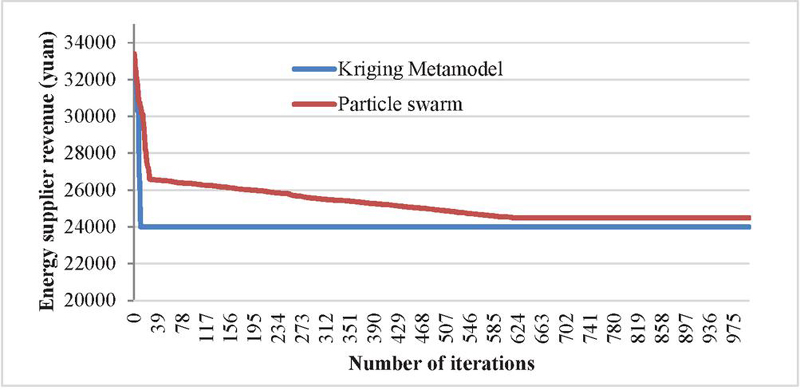
Figure 7 Algorithm convergence process.
4.3 Analysis and Discussion
Aiming at the privacy protection and benefit distribution problems existing in the coordination interaction of multi-regional participation, based on the principle of mixed game, a multi-IE regional joint scheduling strategy is proposed. The IE suppliers and regional operators are constructed into a two-layer mixed game model, in which the upper layer is composed of energy suppliers and operators, and the lower layer is composed of regional operators. The solution results show that compared with the situation where each region operates separately, the multi-IE regional joint scheduling strategy proposed can effectively reduce the regional operating costs while ensuring the privacy of each region, bring benefits to multi-regional scheduling leaders, energy price setters, and IE suppliers, and stimulate the scheduling potential of EV and diversified energy storage equipment within each region.
In Figure 4, the energy purchase and sale prices after optimization of scheduling strategy 2 maintain similar peak and valley periods to the prices published by the distribution network and natural gas network. The peak price periods are 12:00–15:00 and 19:00–22:00, and the low price periods are 12:00–15:00 and 19:00–22:00, but the price fluctuations after optimization of strategy 2 are greater. In Figure 5, the three regions under scheduling strategy 1 does not sell electric energy to energy suppliers in each period of the scheduling cycle, and during the peak period of electricity price, the three regional suppliers purchase very little electric energy to reduce the operating cost of the region. Region 2 purchases a large amount of electric energy during the low period of electricity price, which shows a state of electric energy shortage, while region 1 and region 3 purchase a small amount of electric energy during the low period of electricity price. In Figure 6, the three regions under scheduling strategy 2 have a small amount of electric energy purchased during the peak period of electricity price, and even in some periods, the regions show a state of sufficient electric energy, and operators sell electric energy to energy suppliers. During the low period of electricity price, region 2 shows a state of electric energy shortage, and regional operators purchase a large amount of electric energy from energy suppliers, while regions 1 and 3 except in 04: 00 (the lowest point of electricity price), there is a large amount of electricity purchased, the electricity purchased during the rest of the period is not large, and the electricity is sold to suppliers during certain periods. Comparing Figures 5 and 6, it can be see that the electric energy trading volume in the three regions under scheduling strategy 2 changes significantly, indicating that the electric energy trading situation is greatly affected by electricity prices, while the natural gas purchase volume in the three regions does not fluctuate much due to prices. During the scheduling cycle, operators in each region all purchase large amounts of natural gas from energy suppliers. This is because the only sources of heat energy in the region are electric boilers and cogeneration units, and part of the heat load must be supplied by cogeneration units.
Under strategy 2, comprehensive energy suppliers earn a profit of 23,985.13 yuan by optimizing energy prices and coordinating operations in various regions. Combined with Figure 4, it can be see that although the optimized energy price of strategy 2 is higher than the published price of distribution network and natural gas network at some moments, the regional operators are encouraged by the optimized energy price to adjust the regional operation status.
Table 11 and Figure 7 show that using Kriging meta-model combined with particle swarm optimization algorithm to solve the equilibrium solution of master-slave game converges faster, and can achieve good solution accuracy and calculation efficiency. The main reason is that the algorithm adopted in this paper fits the transaction electricity price and transaction electricity to generate Kriging model by reasonably sampling the lower-level optimization model with complex calculation.
The specific reason for the advantage of the model in this article is that by constructing a two-layer mixed game model, a master-slave game relationship is formed between the upper level comprehensive energy suppliers and the lower level regional operators, effectively coordinating energy trading and benefit distribution between different regions; The lower level regional operators pursue the minimization of regional operating costs through non cooperative game theory, protecting the privacy of each region. At the same time, the Kriging meta model is used to transform complex lower level models, combined with particle swarm optimization algorithm for efficient solving, significantly improving the solving speed and accuracy. This effectively reduces regional operating costs while protecting privacy, and stimulates the scheduling potential of electric vehicles and multiple energy storage devices in each region.
The comprehensive energy system optimization scheduling model for electric vehicles proposed in this article demonstrates excellent generalization ability. This model is based on the principle of mixed game theory and constructs a two-layer mixed game framework, with the upper layer being the master-slave game between comprehensive energy suppliers and various park operators, and the lower layer being the non cooperative game between park operators. This design not only effectively addresses privacy protection and benefit allocation issues in multi regional coordinated interactions, but also achieves efficient solution of complex systems by introducing Kriging meta models and particle swarm optimization algorithms.
The generalization ability of the model is reflected in its adaptability and flexibility. Firstly, the model is not limited to specific regions or energy structures and can be adjusted and optimized according to the actual situation in different regions. Secondly, the core logic of the model, which guides the minimization of regional operating costs through optimizing energy prices, has universal applicability and can be widely applied in various comprehensive energy system scenarios. In addition, with the continuous innovation of energy technology and the complexity of the energy market, this model can maintain its optimization effect and practicality by updating data and algorithm parameters, demonstrating strong vitality and application prospects.
The cases used in this article have a certain universality. Although the case specifically targets three industrial areas and sets detailed energy demand, load data, and equipment parameters, the selection of these data and parameters is based on abstracting and summarizing the typical characteristics of the energy system in actual industrial areas. Therefore, this case not only reflects the basic situation and key issues of multi regional integrated energy systems in actual operation, but also has a certain representativeness and can map energy scheduling scenarios of other similar industrial areas.
The comprehensive energy system optimization scheduling model for electric vehicles proposed in this article has wide applicability. The model is based on the principle of mixed game theory and constructs a two-layer game framework to handle the coordination and interaction problems between multiple regions. This method is not only applicable to industrial areas, but can also be extended to other forms of regional comprehensive energy dispatch optimization, such as commercial areas, residential areas, etc. As long as there are similar energy supply, demand, and equipment configurations in these regions, the model in this article can be applied by adjusting parameters and constraints appropriately.
Specifically, the dual layer game framework in the model can adapt to the energy structure and scheduling objectives of different regions. The upper level master-slave game relationship can reflect the interest game between energy suppliers and regional operators, while the lower level non cooperative game relationship can reflect the independence and privacy protection needs among regional operators. In addition, by introducing Kriging metamodel and particle swarm optimization algorithm, the model can efficiently solve optimization problems of complex systems, which also enhances the applicability and flexibility of the model.
In summary, although the cases used in this article are individual cases, they have a certain degree of universality; Meanwhile, the model proposed in this article is applicable to other forms of regional comprehensive energy dispatch optimization and has broad applicability and application prospects.
With the large-scale implementation of IE regional projects in the future, this method is expected to provide ideas for coordinating the economic operation of multi-regional IE systems in the region. However, it should be pointed out that the industrial areas studied have relatively few internal energy equipment and the energy coupling form is simple. Subsequently, with the continuous innovation of energy technology, energy management methods have become more flexible and diverse, and the energy trading market under the modern energy system must be more complex. Therefore, in future research, it is necessary to further study multi-regional joint scheduling covering more diverse energy coupling situations.
Although the model in this article has achieved significant advantages in optimizing and scheduling multi park integrated energy systems, there are still certain limitations. Firstly, the studied industrial areas have relatively few internal energy equipment and simple energy coupling forms, which fail to fully reflect the complexity of modern integrated energy systems. Secondly, with the continuous innovation of energy technology and the diversification of energy management methods, the adaptability and flexibility of existing models need to be further verified when facing more complex energy coupling situations and changing energy markets. Therefore, future research should focus on multi regional joint scheduling strategies that cover more diverse forms of energy coupling, as well as improving the adaptability and robustness of models in complex and changing energy market environments, in order to promote the in-depth development of integrated energy system optimization scheduling technology.
5 Conclusion
A mathematical model is established for each micro-source equipment coupled in the IE system of the park, including distributed wind turbines, two-stage power-to-gas devices, cogeneration units, electric boilers, multi-element energy storage equipment and electric bus battery swap stations. On the demand side, users’ participation in integrated demand response and EV’ reverse power transmission to the grid are discussed in depth. Then, the optimal operation of the IE system in the park is studied. The research results show that: (1) the IE pricing strategy can balance the originally conflicting interests between the upper operators and the lower users; (2) the proposed multi-agent distributed coordination optimization strategy realizes the coordinated economic dispatch of multi-park IE system. Moreover, comparing the results of multi-park coordinated scheduling strategy with the results of individual operation of each park, it is proved that the proposed joint scheduling strategy can effectively reduce the operation cost of each park on the premise of ensuring the privacy of each park.
It should be noted that the complexity of the scenario selected in this paper needs to be further improved, so as to further improve the versatility of the system proposed in this paper. Therefore, in future research, further research can be carried out on multi-regional joint scheduling covering more diverse energy coupling situations.
References
[1] Taghizad-Tavana, K., Alizadeh, A. A., Ghanbari-Ghalehjoughi, M., and Nojavan, S. (2023). A comprehensive review of electric vehicles in energy systems: Integration with renewable energy sources, charging levels, different types, and standards. Energies, 16(2), 630–642.
[2] Allouhi, A., and Rehman, S. A. M. A. (2023). Grid-connected hybrid renewable energy systems for supermarkets with electric vehicle charging platforms: Optimization and sensitivity analyses. Energy Reports, 9(1), 3305–3318.
[3] Parimalasundar, E., Jayanthi, R., Suresh, K., and Sindhuja, R. (2023). Investigation of efficient multilevel inverter for photovoltaic energy system and electric vehicle applications. Electrical Engineering & Electromechanics,2 (4), 47–51.
[4] Manousakis, N. M., Karagiannopoulos, P. S., Tsekouras, G. J., and Kanellos, F. D. (2023). Integration of renewable energy and electric vehicles in power systems: a review. Processes, 11(5), 1544–1555.
[5] Di Micco, S., Romano, F., Jannelli, E., Perna, A., and Minutillo, M. (2023). Techno-economic analysis of a multi-energy system for the co-production of green hydrogen, renewable electricity and heat. International Journal of Hydrogen Energy, 48(81), 31457–31467.
[6] Zabihia, A., and Parhamfarb, M. (2024). Empowering the grid: toward the integration of electric vehicles and renewable energy in power systems. International Journal of Energy Security and Sustainable Energy, 2(1), 1–14.
[7] Alshammari, N. F., Samy, M. M., and Barakat, S. (2023). Comprehensive analysis of multi-objective optimization algorithms for sustainable hybrid electric vehicle charging systems. Mathematics, 11(7), 1741–1754.
[8] Dwijendra, N. K. A., Arsana, I. G. N. K., Al-Hawary, S. I. S., Prakaash, A. S., Parra, R. M. R., Jalil, A. T., and Hammid, A. T. (2023). Operation of the multiple energy system with optimal coordination of the consumers in energy market. Environmental and Climate Technologies, 27(1), 1–13.
[9] Wei, P., Abid, M., Adun, H., Kemena Awoh, D., Cai, D., Zaini, J. H., and Bamisile, O. (2023). Progress in energy storage technologies and methods for renewable energy systems application. Applied Sciences, 13(9), 5626–5638.
[10] Panos, E., Kannan, R., Hirschberg, S., and Kober, T. (2023). An assessment of energy system transformation pathways to achieve net-zero carbon dioxide emissions in Switzerland. Communications Earth & Environment, 4(1), 157–170.
[11] Wang, Y., Yuan, L., Jiao, W., Qiang, Y., Zhao, J., Yang, Q., and Li, K. (2023). A fast and secured vehicle-to-vehicle energy trading based on blockchain consensus in the internet of electric vehicles. IEEE Transactions on Vehicular Technology, 72(6), 7827–7843.
[12] Ahsan, M. S., Tanvir, F. A., Rahman, M. K., Ahmed, M., and Islam, M. S. (2023). Integration of electric vehicles (EVs) with electrical grid and impact on smart charging. International Journal of Multidisciplinary Sciences and Arts, 2(2), 225–234.
[13] Genovese, M., Schlüter, A., Scionti, E., Piraino, F., Corigliano, O., and Fragiacomo, P. (2023). Power-to-hydrogen and hydrogen-to-X energy systems for the industry of the future in Europe. International Journal of Hydrogen Energy, 48(44), 16545–16568.
[14] Mohammadi, M., Thornburg, J., and Mohammadi, J. (2023). Towards an energy future with ubiquitous electric vehicles: Barriers and opportunities. Energies, 16(17), 6379–6390.
[15] Basnet, S., Deschinkel, K., Le Moyne, L., and Péra, M. C. (2023). A review on recent standalone and grid integrated hybrid renewable energy systems: System optimization and energy management strategies. Renewable Energy Focus, 46(2), 103–125.
[16] Evro, S., Oni, B. A., and Tomomewo, O. S. (2024). Carbon neutrality and hydrogen energy systems. International Journal of Hydrogen Energy, 78(1), 1449–1467.
[17] De Wolf, D., and Smeers, Y. (2023). Comparison of battery electric vehicles and fuel cell vehicles. World Electric Vehicle Journal, 14(9), 262–275.
[18] Mohan, H. M., and Dash, S. K. (2023). Renewable energy-based DC microgrid with hybrid energy management system supporting electric vehicle charging system. Systems, 11(6), 273–286.
[19] Zhao, X., Mu, H., Li, N., Shi, X., Chen, C., and Wang, H. (2023). Optimization and analysis of an integrated energy system based on wind power utilization and on-site hydrogen refueling station. International journal of hydrogen energy, 48(57), 21531–21543.
[20] Meng, Q., Tong, X., Hussain, S., Luo, F., Zhou, F., Liu, L., …and Li, B. (2024). Revolutionizing photovoltaic consumption and electric vehicle charging: A novel approach for residential distribution systems. IET Generation, Transmission & Distribution, 18(17), 2822–2833.
[21] Kumar, M., Panda, K. P., Naayagi, R. T., Thakur, R., and Panda, G. (2023). Comprehensive review of electric vehicle technology and its impacts: Detailed investigation of charging infrastructure, power management, and control techniques. Applied Sciences, 13(15), 8919–8930.
[22] Sinha, P., Paul, K., Deb, S., and Sachan, S. (2023). Comprehensive review based on the impact of integrating electric vehicle and renewable energy sources to the grid. Energies, 16(6), 2924–2935.
Biographies

Xiaojing Wu was born in Henan, China, in 1988. She pursued her undergraduate studies at Henan Polytechnic University from 2009 to 2013, earning her bachelor’s degree in 2013. Subsequently, from 2014 to 2017, she continued her education at the same university, where she obtained her Master’s degree in 2017. Currently, she is employed at Hebi College of Engineering and Technology, affiliated with Henan Polytechnic University. She has published five papers, one of which has been indexed by Peking University Core. Her research interests electric vehicle and integrated energy system.

Jinghui Tan was born in Henan, China in 1992. He studied at East China Jiaotong University from 2011 to 2015 and obtained a Bachelor’s degree in Engineering in June 2015. I studied as a graduate student at East China Jiaotong University from 2016 to 2019 and obtained a Master’s degree in Engineering in June 2019. Currently, he is employed at Hebi College of Engineering and Technology, affiliated with Henan Polytechnic University. Published 6 papers publicly and led 3 projects. My research direction is power system automation.
Strategic Planning for Energy and the Environment, Vol. 44_4, 901–932.
doi: 10.13052/spee1048-5236.44412
© 2025 River Publishers