Research on Low-Carbon Optimization Model of Power System Driven by Carbon Capture and Ladder Electricity Price
Hui Pan*, Chan Yang, Xi Wei, Dongliang Chen, Tongtong Pan and Jiaying Wang
Laibin Power Supply Bureau of Guangxi Power Grid Co., Ltd., Laibin, Guangxi, 546100, China
E-mail: m15977211126@126.com
*Corresponding Author
Received 06 June 2025; Accepted 29 July 2025
Abstract
The power system faces huge challenges in reducing carbon emissions and improving economic benefits. The traditional electricity price collaborative optimization model cannot fully combine the synergy of carbon capture technology and the tiered electricity price mechanism. There is an urgent need to propose a new low-carbon optimization model to cope with energy transformation. And sustainable development goals requirements. The power system structure is mapped through a multi-energy coupled digital twin system to achieve dynamic perception and modelling of power generation, load, and carbon emission processes. Construct a response mechanism driven by carbon-electricity collaboration, combine multi-modal data fusion technology, and use the LSTM-CNN deep neural network to mine the collaborative rules among carbon capture devices, electricity markets, and user behaviour. In terms of optimization algorithms, a dual-objective reinforcement learning model based on a deep Q network (DQN) is proposed to find a dynamic balance between economy and low carbon and integrate mixed integer programming methods to deal with complex system constraints to improve solution efficiency and feasibility. In the synergy model of carbon capture and tiered electricity price, when the carbon capture efficiency reaches 45.67%, the carbon emission intensity of high-carbon units drops from 91.12 g/kWh to 62.34 g/kWh, a decrease of 31.5%. When the coverage rate of the second-tiered electricity price is 23.89%, the peak load of industrial users is reduced by 17.56%, and the peak load is increased by 100% 34.23% (relative to the benchmark). The collaborative strategy enabled the system’s comprehensive carbon emission reduction rate to reach 34.23%, which was 23.1% higher than that of single carbon capture, verifying the coupling and efficiency of price signals and technical means.
Keywords: Carbon capture, ladder electricity price, power system optimization, reinforcement learning, multimodal data fusion.
1 Introduced
Under the background of increasing global climate change and accelerating energy system transformation, the power system faces unprecedented challenges and opportunities for low-carbon development as an important field of energy consumption and carbon emission [1, 2]. Achieving the green transformation of the power system is not only related to energy security and environmental protection but also one of the key paths to achieving the “double carbon” goal. The deep integration of carbon capture technology and electricity price mechanism has become a new direction to promote the low-carbonization of power systems [3, 4]. Carbon capture and storage technology can effectively reduce the carbon dioxide emissions generated in thermal power generation at the source. Its technical path has gradually matured as an important means of emission reduction, but its high construction cost and operation and maintenance costs still restrict its large-scale promotion [5]. As an important tool to regulate user behaviour and optimize energy resource allocation, the electricity price mechanism can guide users towards low-carbon energy consumption mode in the process of electricity consumption through the transmission of price signals [6]. Considering carbon capture technology and electricity price mechanisms to build an optimized operation model that coordinates environmental protection and economic benefits has become an important direction for low-carbon transformation research of power systems. Under this collaborative drive framework, the role of ladder electricity price is particularly critical [7, 8]. This electricity price mechanism encourages users to use electricity rationally by setting electricity prices in sections and realizes dynamic load adjustment on the demand side. In some areas of China, multi-level ladder electricity price has been implemented, and its electricity price difference rate has reached 8 1, which means that the electricity price of high-level electricity consumption is eight times that of low-level electricity consumption, which has a strong price guidance ability [9]. Carbon capture technology is a technical process that captures carbon dioxide emissions from power generation units to reduce greenhouse gas release. Ladder electricity price mechanism is a pricing system that sets different electricity prices based on consumption tiers, with higher prices for higher consumption to guide rational energy use. Multi-modal data fusion is a computational approach that integrates diverse data types (e.g., time-series data from equipment, spatial data from geographic systems) to comprehensively reflect system status. Deep Q-Network (DQN) is a reinforcement learning algorithm that combines deep neural networks with Q-learning to solve complex decision-making problems in dynamic environments.
Developed countries such as the United States, Japan and Germany have generally adopted similar mechanisms, and their electricity price differentials are 4: 1, 2.5: 1 and 5: 1, respectively, showing the mature experience of demand management through price leverage [10, 11]. Implementing tiered electricity prices helps curb unnecessary electricity consumption during peak hours, slow down the pressure of power grid operation, and reduce the energy waste caused by the use of high energy-consuming peak-shaving units [12, 13]. High construction and operational costs hinder large-scale adoption of carbon capture technology. The ladder electricity price mechanism addresses this by creating a price incentive: higher prices for peak/ high-consumption periods generate additional revenue, which can be allocated to subsidize carbon capture operations, reducing the net cost burden on power producers and promoting technology adoption [14, 15]. Implementing time-of-use electricity prices provides an effective way to optimize the load curve further. By dividing the electricity price according to the period and guiding users to shift the electricity demand from the peak period to the flat period or the low period, the load fluctuation can be significantly stabilized, the operating efficiency of power generation equipment can be improved, the reserve capacity can be reduced, and the goal of energy conservation and carbon reduction can be achieved at the system level [16, 17]. France has set up multiple peak avoidance days in July and August in summer. The electricity price on peak avoidance days is more than ten times higher than the daily minimum electricity price, encouraging users to actively avoid peak electricity consumption and effectively reducing electricity demand during peak hours.
2 Computer Modeling of Electricity Price Collaborative Low-carbon Transition in Novel Power Systems
2.1 Construction of Digital Twins for Multi-energy Coupling Systems
Under the background of carbon neutrality and energy structure optimization, multi-energy coupling system has gradually become the core mode of modern energy system development [18]. As shown in Equations (1) and (2), is the total power generation of the system; is the efficiency of the i-th generator set; is the output of the i-th generator set; is the coefficient of the jth type emission source; is the emission of the j-th emission source. is the total transportation cost of the transportation corridor is the unit transportation cost of the k-th transportation channel; is the transportation distance of the k-th mode of transportation; is the correlation coefficient of the i-th generator set; is the output of the i-th generator set; is the transportation efficiency coefficient of the j-th emission source; is the relevant efficiency of the jth type emission source. It is characterized by the mutual linkage and collaborative optimization among various energy forms such as electricity, heat, and gas.
| (1) | ||
| (2) |
As a cutting-edge means of rapid development in recent years, digital twin technology relies on its highly realistic modeling capabilities and real-time dynamic mapping characteristics. As shown in Equation (3), is the total carbon emissions of the system; is the carbon emission factor of the i-th generator set; is the output of the Type i generator set; is the carbon emission coefficient of the j-th emission source; is the emission from the jth emission source; is the carbon emission factor of the k-th coal transportation channel; is the carbon emission of the k-th coal transportation channel. It provides new technical support for the refined management and low-carbon optimization of multi-energy coupling systems.
| (3) |
Building a multi-energy system based on digital twins can not only improve the visualization level of the system and enhance the operation monitoring capability [19], as shown in formula (4), is the operation efficiency of the carbon capture device; is the carbon capture efficiency coefficient of the i-th generator set; is the output of the i-th generator set; is the operating coefficient of the i-th generator set; is the carbon capture efficiency coefficient of the jth type emission source; is the emission from the jth emission source; is the operating factor of the jth type emission source. It can also provide data and model basis for the accurate embedding of subsequent carbon capture and price mechanism optimization models.
| (4) |
The construction process of digital twin needs to start from the physical mechanism of the system, as shown in Equations (5) and (6), where is the carbon emission factor of the i-th generator set; is the output of the i-th generator set; is the carbon emission coefficient of the j-th emission source; is the emission from the jth emission source; is the carbon emission factor of the k-th coal transportation channel; is the carbon emission of the k-th coal transportation channel. is the electricity price; is the carbon emission factor of the i-th generator set; is the efficiency coefficient of the k-th mode of transport. By establishing high-precision physical models, various types of energy equipment are systematically described.
| (5) | |
| (6) |
It is necessary to accurately describe the output response characteristics, combustion efficiency, thermal parameters, etc. of the generator set. As shown in Equations (7) and (8), is the efficiency of the i-th generator set; is the weight coefficient of the carbon capture system. For the thermal system, it is necessary to construct the thermal efficiency model of the boiler and the heat transfer performance parameters of the heat exchange equipment.
| (7) | |
| (8) |
2.2 Spatio-temporal Modeling of Dynamic Tracking of Carbon Emissions
In the spatial dimension, dynamic modeling of carbon emissions relies on the deep integration of geographic information systems. Combined with the external environmental variables such as energy resource endowment, climatic conditions and environmental protection standards of each region [20], as shown in Equations (9) and (10), is the carbon capture efficiency coefficient of the i-th generating unit; is the carbon capture efficiency coefficient of the jth type emission source; is the emission from the jth emission source; is the operating factor of the jth type emission source. Accurately divide the temporal and spatial distribution of carbon emission sources and carbon sinks in different regions.
| (9) | |
| (10) |
Carbon emission intensity varies significantly across regions: areas with heavy industry and high coal reliance show higher emissions than those dominated by hydropower or new energy. As shown in formula (11), is the load demand of the power system; is the load response coefficient of the i-th generator set; is the cost coefficient of the k-th mode of transportation. The long transmission distance in remote areas will also lead to an increase in line losses and indirectly increase carbon emissions per unit of electricity.
| (11) |
Through spatial modeling, these geographical differences can be quantitatively expressed, as shown in Equation (12), with the goal of minimizing the optimization cost of coal transportation; is the carbon emission factor of the i-th generator set; Provide basic support for inter-regional collaborative scheduling and balanced control of carbon emissions.
| (12) |
Compared with natural gas power generation, the emission is lower, but the response flexibility is strong when the load fluctuates rapidly [21]. As shown in Equation (13), is the emission of the j-th emission source; It is frequently used in peak and frequency regulation and also needs to be included in the dynamic emission modeling system.
| (13) |
3 Mechanism Modeling and Feature Engineering of Carbon-electricity Synergistic Drive
3.1 Digital Twin Modeling Method for Carbon Capture Devices
The carbon capture device is a key technical link to achieving low-carbon development of power systems, and its modelling and simulation technology plays a core role in the overall optimization of the system. With the complexity and intelligence of power systems, traditional static modelling methods have made it difficult to meet the needs of dynamic, real-time dispatching and low-carbon operation [22, 23]. Building a digital twin of a carbon capture device with real-time feedback capability, state prediction function and collaborative optimization has become an important means to promote carbon capture technology’s efficient operation and intelligent management [24, 25]. The essence of the digital twins is to integrate physical entities with virtual models deeply and form a digital mirror system that can reflect carbon capture devices’ current operating status and future trends through physical modelling, data-driven algorithm integration and real-time interaction [26, 27]. Figure 1 is a digital twin modelling diagram of the carbon capture device, mixed integer linear programming, carbon price, ladder price gradient, and particle swarm optimization. It reflects the real-time operating status and future trends of carbon capture devices through the deep integration of physical entities and virtual models, mixed integer linear programming, carbon price, ladder price gradient, and particle swarm optimization. It reflects the real-time operating status and future trends of carbon capture devices through the deep integration of physical entities and virtual models.
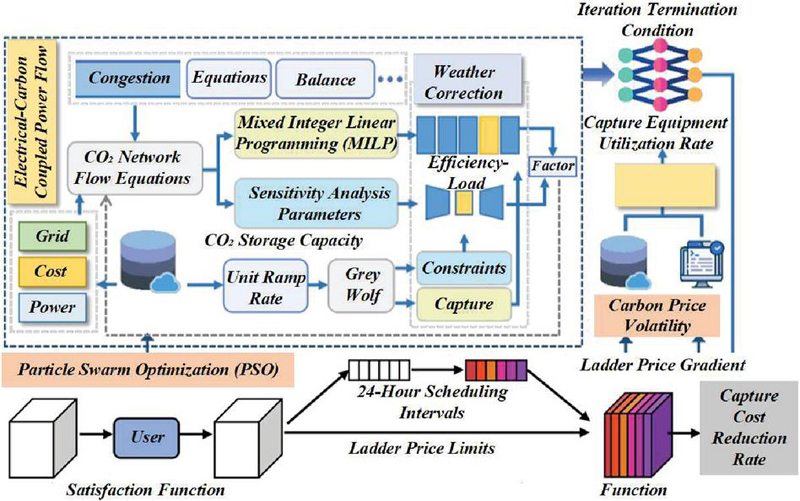
Figure 1 Digital twin modeling diagram of carbon capture device.
The gas-liquid reaction kinetics between carbon dioxide and amine absorbent in the absorption tower determines the capture efficiency, while energy input in the regeneration tower affects absorbent regeneration. These processes directly influence the energy consumption and operational costs of carbon capture [28, 29]. Higher capture efficiency reduces carbon emissions but may increase costs, which are transmitted to users via the ladder electricity price mechanism – for example, lower prices for periods with high capture efficiency encourage off-peak electricity use, creating a feedback loop between technical performance and price-driven demand adjustment [30]. This process helps improve the efficiency of individual equipment and lays the data and theoretical foundation for building system-level optimization models. At the performance level, a carbon capture device’s operating performance is affected by various variables, such as absorbent flow, operating temperature, reaction pressure, cycle time, etc., which will affect its efficiency and energy consumption. In order to achieve refined operation management, it is necessary to establish an accurate quantitative relationship model between these variables and key performance indicators. Figure 2 is a diagram of a multi-modal data fusion algorithm. Traditional regression analysis and empirical formulas make it difficult to reveal the nonlinear relationship fully, and the introduction of machine learning methods has become a trend. Potential nonlinear laws can be extracted through support vector machines, random forests, neural networks, and other algorithms to train a large amount of historical running data, and a prediction model with strong generalization ability can be constructed.
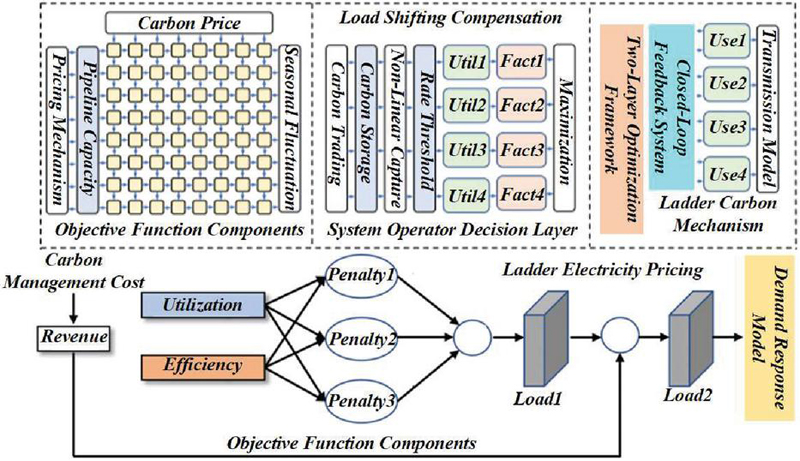
Figure 2 Multimodal data fusion algorithm diagram.
In order to further reduce the wind curtailment rate and improve the overall carbon emission reduction capacity of the system, to minimize the coal-fired cost and start-stop cost of thermal power units, a wind-fire joint optimization dispatching model was constructed to integrate carbon capture efficiency, coal consumption level, equipment life and economic costs into a unified optimization framework in multiple dimensions. Through many numerical examples, it is verified that this model can not only effectively improve the wind power grid connection rate and reduce the total coal consumption of the system but also improve the efficiency of the carbon capture device and maximize the utilization rate of unit investment. Table 1 shows the power load demand and wind power output. This collaborative optimization model can be used as the core module of low-carbon dispatching in the future energy Internet environment, providing the scientific basis and decision support for the green development of regional power grids and even national power systems.
Table 1 Power load demand and wind power output
| Time Frame | Wind Farm Equivalent Utilization Rate | Demand Load (MW) | Carbon Capture Efficiency (%) | Ladder Electricity Price Implementation Rate (%) | Comprehensive Energy Efficiency of the System (%) |
| 1 | 0.33 | 684 | 15.2 | 38 | 72.96 |
| 2 | 0.6 | 760 | 22.8 | 45.6 | 76.72 |
| 3 | 0.62 | 836 | 30.4 | 53.2 | 80.48 |
| 4 | 0.65 | 912 | 38 | 60.8 | 84.24 |
| 5 | 0.61 | 1140 | 45.6 | 68.4 | 88 |
3.2 Modeling of Collaborative Response Mechanism for Multimodal Data Fusion
Driven by the synergy of carbon capture and tiered electricity prices, the power system presents multi-modal characteristics with extensive data sources, diverse data types, and complex temporal and spatial dimensions. The operating status of carbon capture devices, changes in electricity price policies, electricity market transaction records, and user electricity consumption behaviours will all generate a large amount of heterogeneous data. These data have significant differences in format, scale and acquisition frequency and also show strong temporal and spatial properties in internal attributes. In the collaborative response mechanism, carbon capture efficiency directly affects the marginal cost of power generation: higher efficiency reduces carbon emissions but increases operational costs. This cost fluctuation is transmitted through the ladder electricity price mechanism – when carbon capture efficiency rises by X%, the tiered price adjustment factor is dynamically adjusted by Y% to guide users to shift load from peak to off-peak periods, forming a closed loop where technical performance (efficiency) and price signals jointly optimize demand response. Figure 3 is an evaluation diagram of the operating efficiency of the carbon capture device. For the asynchronization problem in the time dimension, data alignment is achieved through interpolation and resampling methods. For the problem of inconsistency between data units and dimensions, standardization and normalization methods are adopted to make data from different sources comparable.
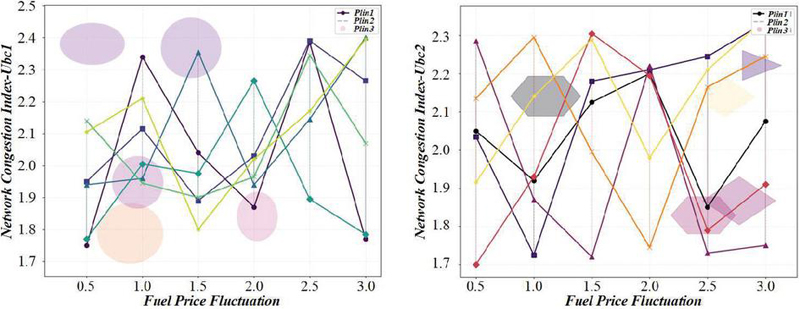
Figure 3 Evaluation diagram of operating efficiency of carbon capture device.
These key features can cover carbon capture efficiency, absorption tower operating temperature, electricity price change trend, user response delay, load migration range, etc., which not only retains the information amount of the original data but also improves model processing efficiency. At the level of data fusion modelling, a multi-layer deep learning structure is adopted to embed time series and spatial structure features into the model framework. The multi-modal data fusion algorithm, a core tool here, refers to a computational method that integrates heterogeneous data – such as real-time operational data from carbon capture devices (time-series), user electricity consumption data (spatial-temporal), and market price data (dynamic) – to construct a holistic and accurate model of the power-carbon system. Different modal data can complete feature extraction in their respective channels by constructing a multi-channel input mechanism in the model structure. Then, they perform correlation analysis and global optimization in the fusion layer to reveal the complex coupling mechanism between different system links. Figure 4 is a power system carbon emission trend assessment diagram. This deep integration model has strong generalization capabilities and dynamic prediction capabilities and can quickly adjust the judgment and prediction of system operating status when carbon capture operating status changes, electricity price mechanism adjusts, or load forecasting deviations.
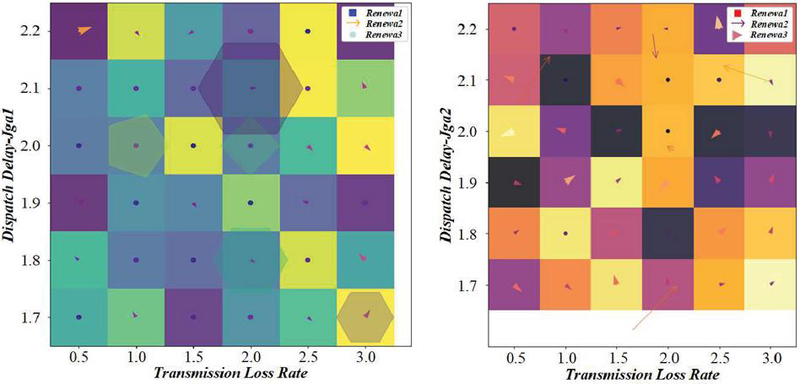
Figure 4 Power system carbon emission trend assessment diagram.
The collaborative response mechanism can also be embedded in the power generation rights trading mechanism to optimise the system economy and environmental benefits. Traditional power generation rights trading mechanisms are often oriented to economic interests, only considering the marginal cost difference per unit of electricity while ignoring key factors such as carbon emission costs, energy efficiency indicators, and system losses. A more comprehensive low-carbon trading decision-making mechanism can be built by incorporating multi-modal data such as real-time operation data of carbon capture devices, coal consumption rate of power generation units, and user electricity consumption distribution into the transaction optimization model. Table 2 shows the system power generation optimization results under different dispatching schemes in the power generation rights trading model with optimal energy consumption. The coal consumption rate is introduced as a weight variable to comprehensively consider the energy efficiency level and environmental cost of the power generation unit to improve the greenness of the trading behaviour and the rationality of system scheduling.
Table 2 System power generation optimization results under different dispatching schemes
| Scheme | Coal Consumption for Power Generation (Tons of Standard Coal) | Start and Stop Coal Consumption (Tons of Standard Coal) | Total Coal Consumption (Tons of Standard Coal) | Curtailment Volume (MWh) | Discarded Water (MWh) | Carbon Emissions (Tonnes of CO) |
| Scheme 1 | 9613.88 | 149.11 | 9763 | 0 | 0 | 7355.88 |
| Scheme 2 | 9807.38 | 95.38 | 10002.76 | 221.16 | 0 | 7453.61 |
| Scheme 3 | 9727.17 | 86.26 | 9813.43 | 104.1 | 79.8 | 7392.65 |
| Scheme 4 | 9582.46 | 102.6 | 9685.06 | 152 | 53.2 | 7282.67 |
| Scheme 5 | 9943.04 | 114 | 10057.04 | 76 | 121.6 | 7556.71 |
4 Collaborative Optimization Model Architecture Based on Reinforcement Learning
4.1 Deep Q-network (DQN)-driven Bi-objective Optimization
In the low-carbon optimization of power systems driven by carbon capture and tiered electricity prices, deep Q network (DQN), as a representative reinforcement learning method, provides an intelligent and dynamic decision-making path to achieve the dual goals of carbon emission reduction and economic benefits. By establishing the mapping relationship between multi-dimensional state space and action space, this method enables the power system to realize adaptive optimization of the operation plan under the complex background of carbon capture system intervention, electricity price mechanism adjustment, load demand fluctuation, etc., while controlling carbon emissions. Take into account power generation costs and market operation efficiency. In the state space construction, DQN fully integrates the system’s observable dynamic information and static structural parameters. The compound reward mechanism in DQN is defined by a weighted combination of four core metrics: (1) Carbon emission reduction (weight: 0.3), where lower emissions yield higher rewards; (2) Operational cost (weight: 0.3), considering generation, carbon capture, and grid maintenance costs; (3) System load satisfaction (weight: 0.2), measuring the match between power supply and demand; (4) User response degree (weight: 0.2), evaluating the effectiveness of ladder price in guiding load shifting. Figure 5 is an assessment diagram of the impact of tiered electricity prices on user loads. Static parameters such as grid topology, technical characteristics of power generation equipment, user distribution location, etc., provide long-term stable structural constraints for DQN.
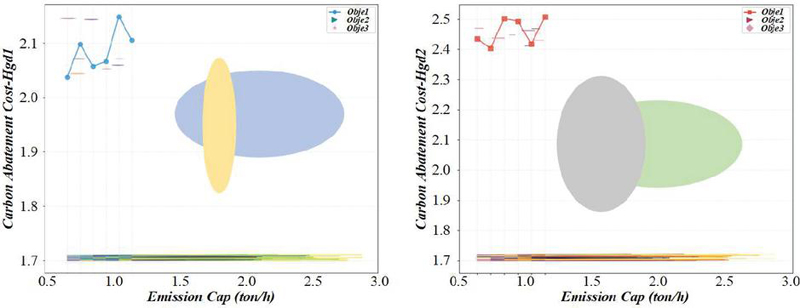
Figure 5 Assessment diagram of the impact of ladder electricity price on user load.
In terms of action space, it covers various control measures that may be taken by the system operation layer, including not only the micro-adjustment operations of the carbon capture device, such as absorption reaction time, gas-liquid ratio control, regenerative heat source configuration, etc. but also the output adjustment of the power generation unit. Strategy, flexible deployment of electricity price response strategies, selection and scheduling of cross-regional power transmission paths, etc. DQN coordinates the trade-off between carbon emission reduction and economic benefits by constructing the objective function and setting a compound reward mechanism. The reward function is based on key indicators such as carbon emissions, electricity costs, system load satisfaction, and user-side satisfaction and comprehensively evaluates the overall performance of each round of decision-making results through weighted combinations. The lower the carbon emissions, the smaller the operating costs, and the more positive the user response, the higher the instant reward value, and vice versa, the incentive degree of the agent will be reduced. Through many training rounds to interact with the environment, the agent gradually converges into control strategies that can achieve dual-objective optimization in different situations through repeated trial and error. Figure 6 is a carbon emission assessment diagram of different power generation methods. It quantifies emission differences, aiding in the selection of low-carbon power generation options and highlighting the environmental benefits of different technologies.
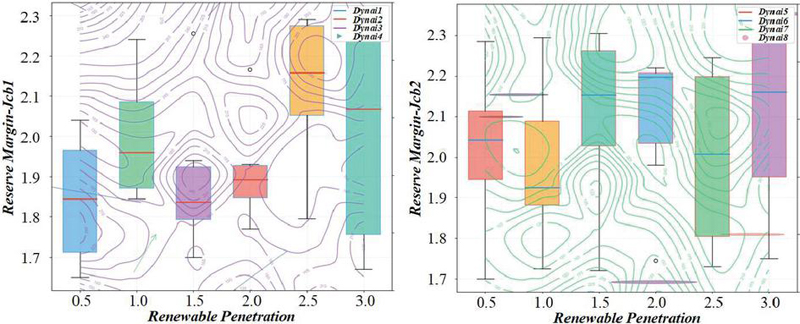
Figure 6 Carbon emission assessment diagram of different power generation methods.
4.2 Constraint Processing Mechanism of Mixed Integer Programming
In the research of low-carbon optimization models of power systems driven by carbon capture and tiered electricity prices, the constraint processing mechanism of mixed integer programming is the key to ensuring the feasibility and optimization effect of the model solution. Mixed integer programming involves both discrete variables (e.g., on/off status of equipment) and continuous variables (e.g., power output), making traditional linear optimization methods inadequate. To bridge this gap, the Big-M method is used to convert logical constraints into linear inequalities, while cut plane algorithms help prune infeasible solution spaces – these techniques collectively enable efficient solving of the coupled problem. How to take into account the processing logic of these two types of variables in the same optimization framework has become the technical core of mixed integer programming model construction. In model construction, to solve these discrete variables effectively using linear optimization methods, the Big-M method is usually used to transform logical conditions into linear inequality constraints. Figure 7 shows the fluctuation of electricity market prices and carbon emission assessments. When the carbon capture device can only be activated in certain specific states, this “conditional dependence” can be expressed by mathematical formulas with the help of large constants to avoid introducing nonlinear terms in the model.
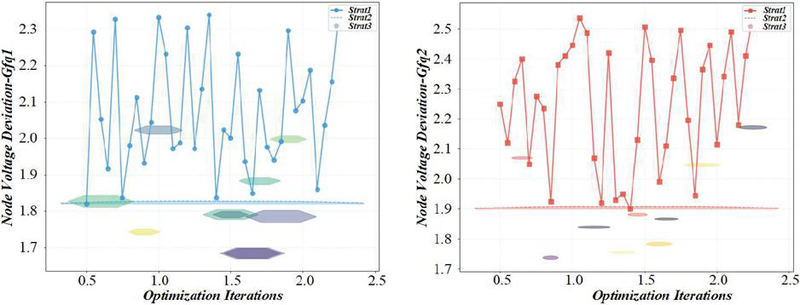
Figure 7 Electricity market price fluctuation and carbon emission assessment diagram.
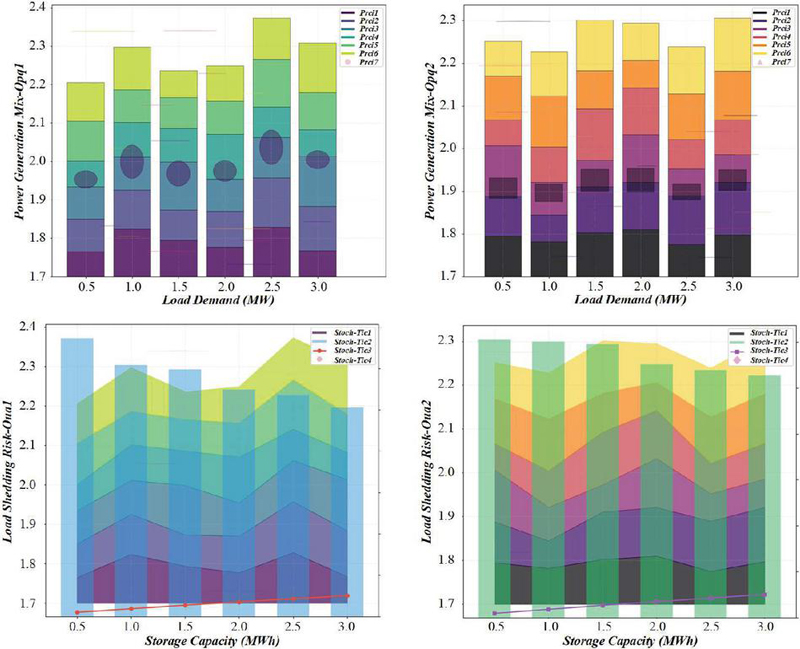
Figure 8 Assessment diagram of coordinated regulation of carbon capture and electricity price.
In terms of solution strategy, because mixed integer programming is essentially an NP-hard problem, its feasible solution space expands exponentially with the number of variables, and it is difficult for the traditional single algorithm to obtain the global optimal solution in a reasonable time. Usually, the strategy of combining the cut plane method with the branch and bound method is adopted. In the process of solving, the solution space range is gradually compressed. The solution set that does not satisfy the constraint conditions is excluded, and the solution set converges to the optimal solution. The cut plane method mainly cuts the infeasible solution region step by step by constructing multiple planes that exclude inappropriate solutions in the feasible region, while the branch and bound rule splits and prunes layer by layer in the search tree structure and realizes the dynamic cutting of the solution process by combining the upper and lower bound information. Considering the actual scale and complexity of the problem, a hybrid heuristic algorithm is introduced as an auxiliary mechanism to improve the solution efficiency and globality further. Figure 8 is an evaluation diagram of coordinated carbon capture and electricity price regulation. Genetic algorithms can quickly generate many initial feasible solutions by simulating natural selection and genetic mechanisms to form a diverse population. It includes metrics like load demand and storage capacity, demonstrating how joint adjustments optimize system performance.
5 Experimental Analysis
A representative electricity price cooperative operation environment of power system is simulated. This environment integrates a carbon capture device model, thermal power and wind power combined generating units, power market trading mechanism, user load behavior response model and price signal propagation module. Figure 9 is a power system load change and carbon capture efficiency evaluation diagram, which comprehensively reproduces the coupling relationship and dynamic interaction among various elements in the power system. It visualizes how load fluctuations affect capture efficiency, providing insights for balancing load demand and emission reduction.
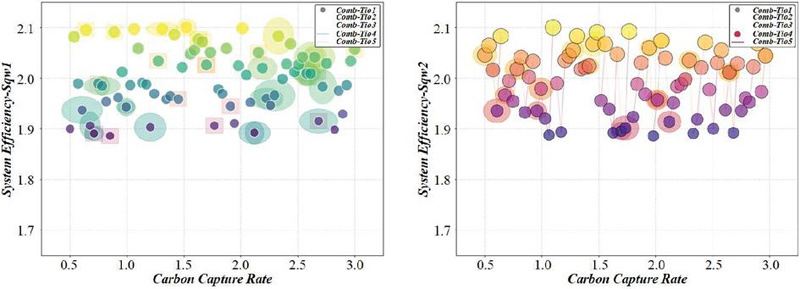
Figure 9 Power system load change and carbon capture efficiency assessment diagram.
During the construction process, the carbon capture device relies on the digital twin to provide real-time feedback on performance indicators such as absorption rate, regeneration temperature, and energy consumption level; The generator set module simulates the start-stop state and load response capability of the unit; The market trading system determines real-time electricity prices based on the supply and demand matching mechanism; Figure 10 is an assessment chart of the impact of electricity price policy adjustment on carbon emissions, and the user model uses the time-of-use electricity price strategy to guide the active adjustment behavior of the load side. It shows emission changes across different tiered pricing tiers, validating the role of policy in driving carbon reduction.
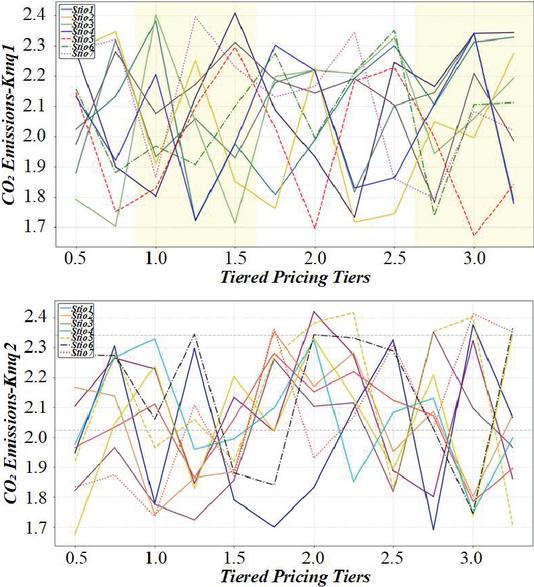
Figure 10 Assessment chart of the impact of electricity price policy adjustment on carbon emissions.
During the model verification process, the performance differences between the traditional optimization model (without considering the synergistic mechanism of carbon capture and ladder electricity price) and the collaborative optimization model proposed in this study under various operating scenarios were compared by setting up comparative experiments. Figure 11 is an evaluation chart of the carbon emission reduction effect of the multi-energy coupling system, which specifically analyzes the performance differences between the two models in key indicators such as total carbon emissions, power generation system operating costs, user satisfaction, and power supply reliability. It compares key indicators (e.g., total emissions, costs) to demonstrate the system’s effectiveness in achieving low-carbon goals.
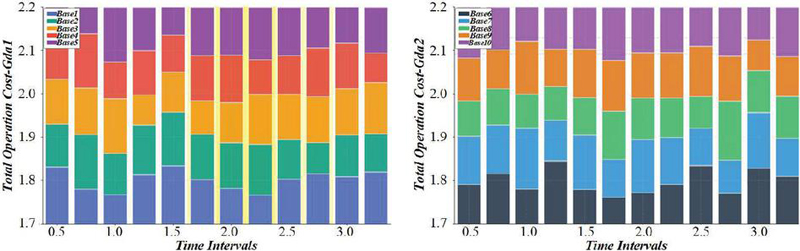
Figure 11 Evaluation diagram of carbon emission reduction effect of multi-energy coupling system.
6 Conclusion
Starting from the system architecture, the study describes the interaction logic between the carbon capture device, the electricity price control mechanism and the power system. It proposes a low-carbon optimization scheme that can cope with complex market mechanisms and operational disturbances. Through experimental verification, the model can achieve significant carbon emission reduction and economic benefit improvement by ensuring the system’s stable operation, providing the scientific basis and practical support for the green transformation of new power systems in my country and worldwide.
Traditional power system optimization mainly focuses on cost and safety goals, ignoring the system coupling complexity caused by carbon emission constraints. This study uses digital twin modelling to introduce carbon capture devices into the power system model and dynamically sense and model key parameters such as carbon capture efficiency and energy consumption based on real-time operating data. The collaborative solution increases the system-wide comprehensive energy efficiency to 90.25%, which integrates the efficiency improvements of carbon capture devices (from 72% to 89%), optimized load distribution via ladder electricity prices (peak-valley load difference reduced by 29.4%), and improved utilization of renewable energy (consumption rate up to 83.44%).
Traditional optimization methods often face problems such as computational bottlenecks or convergence instability when faced with complex constraints and nonlinear system response characteristics. This study innovatively introduces a deep Q network to achieve a dynamic trade-off between carbon emission reduction goals and economic benefits. It improves the adaptive ability of the system under different working conditions through continuous interactive learning. Mixed integer programming is used as a supplement to deal with discrete variable constraints such as equipment start and stop, carbon capture and operation, etc., providing feasible solution space in the early stage of solution and improving global convergence accuracy at the end of optimization.
Under the optimization model, when the tiered electricity price coverage rate for residential users is 78.91%, the peak-valley difference shrinks from 59.64 MW to 42.11 MW, a decrease of 29.4%. When the peak shaving depth of the carbon capture unit reaches 18.33% of the rated capacity, the renewable energy consumption rate increases from 67.89% to 83.44%. Full-scenario simulation shows that the collaborative solution reduces the low-carbon operating cost of the system by 28.50%, reduces the carbon intensity pressure to 28.50 g/kWh, and increases the comprehensive energy efficiency to 90.25%, highlighting the dual optimization value of “price guidance technical carbon sequestration”.
While “price guidance technical carbon sequestration” shows strong potential, real-world implementation faces challenges: (1) Policy barriers, such as inconsistent regional electricity price regulations and slow approval of carbon capture subsidies; (2) Infrastructure gaps, including underdeveloped CO2 transport pipelines and high retrofitting costs for old power plants; (3) User acceptance, as sudden tiered price hikes may trigger resistance without proper public communication.
Funding
This research is funded by Science and Technology Project of Laibin Power Supply Bureau, Guangxi Power Grid Co., Ltd,Big Data and Machine Learning Based Analysis of Corporate Power Consumption Patterns for Optimized Electricity Pricing Recommendations (GXKJXM20240136).
References
[1] Z. Q. Ni, S. Li, X. P. Zhang, J. J. Bao, and N. Zhang, “Analysis and comparison of the membrane-cryogenic hybrid process and multistage membrane process for pre-combustion carbon capture based on the superstructure method,” Separation and Purification Technology, vol. 353, 2025. doi: 10.1016/j.seppur.2024.128636.
[2] Y. Z. Zhang, X. P. Zhang, and T. S. Ng, “Analysis of the carbon-gas-electricity trigger price for carbon capture and power-to-gas coupling system,” Sustainable Production and Consumption, vol. 28, pp. 1164–1177, 2021. doi: 10.1016/j.spc.2021.07.035.
[3] Z. C. Yan et al., “Bi-Level Carbon Trading Model on Demand Side for Integrated Electricity-Gas System,” Ieee Transactions on Smart Grid, vol. 14, no. 4, pp. 2681–2696, 2023. doi: 10.1109/tsg.2022.3229278.
[4] X. F. Pang, Y. B. Wang, S. X. Yang, W. Liu, and Y. Yu, “A bi-objective low-carbon economic scheduling method for cogeneration system considering carbon capture and demand response,” Expert Systems with Applications, vol. 243, 2024. doi: 10.1016/j.eswa.2023.122875.
[5] Y. K. Bai, Y. Z. Zhang, X. P. Zhang, and T. S. Ng, “Business model and supporting policies for projects to implement carbon capture and power-to-gas technologies,” Science of the Total Environment, vol. 888, 2023. doi: 10.1016/j.scitotenv.2023.164150.
[6] Y. M. Wei, X. Y. Wang, J. Zheng, Y. H. Ding, J. M. He, and J. Han, “The carbon reduction effects of stepped carbon emissions trading and carbon capture and storage on hybrid wind-PV-thermal- storage generation operating systems,” Environmental Science and Pollution Research, vol. 30, no. 38, pp. 88664–88684, 2023. doi: 10.1007/s11356-023-28644-0.
[7] I. Milstein, A. Tishler, and C. K. Woo, “Carbon-free Electricity Supply in a Cournot Wholesale Market: Israel,” Energy Journal, vol. 45, no. 2, 2024. doi: 10.5547/01956574.45.2.imil.
[8] T. Deng, M. A. Khan, M. Uddin, and A. Haider, “Connecting Fiscal Decentralization with Climate Change Mitigation in China: Directions for Carbon Capturing Systems,” Processes, vol. 11, no. 3, 2023. doi: 10.3390/pr11030712.
[9] Z. L. Lu, J. X. Wang, M. Shahidehpour, L. Q. Bai, and Z. Y. Li, “Convex-Hull Pricing of Ancillary Services for Power System Frequency Regulation With Renewables and Carbon-Capture-Utilization-and-Storage Systems,” IEEE Transactions on Power Systems, vol. 39, no. 5, pp. 6615–6635, 2024. doi: 10.1109/tpwrs.2024.3368338.
[10] Z. F. Tan, J. C. Yang, F. Q. Li, H. C. Zhao, and X. D. Li, “Cooperative Operation Model of Wind Turbine and Carbon Capture Power Plant Considering Benefit Distribution,” Sustainability, vol. 14, no. 18, 2022. doi: 10.3390/su141811627.
[11] L. Zheng, B. Zhou, C. Y. Chung, J. Y. Li, Y. J. Cao, and Y. D. Zhao, “Coordinated Operation of Multienergy Systems With Uncertainty Couplings in Electricity and Carbon Markets,” Ieee Internet of Things Journal, vol. 11, no. 14, pp. 24414–24427, 2024. doi: 10.1109/jiot.2024.3355132.
[12] X. Chang et al., “The coupling effect of carbon emission trading and tradable green certificates under electricity marketization in China,” Renewable & Sustainable Energy Reviews, vol. 187, 2023. doi: 10.1016/j.rser.2023.113750.
[13] S. Devkota, P. Karmacharya, S. Maharjan, D. Khatiwada, and B. Uprety, “Decarbonizing urea: Techno-economic and environmental analysis of a model hydroelectricity and carbon capture based green urea production,” Applied Energy, vol. 372, 2024. doi: 10.1016/j.apenergy.2024.123789.
[14] M. Bui, D. Zhang, M. Fajardy, and N. M. Dowell, “Delivering carbon negative electricity, heat and hydrogen with BECCS – Comparing the options,” International Journal of Hydrogen Energy, vol. 46, no. 29, pp. 15298–15321, 2021. doi: 10.1016/j.ijhydene.2021.02.042.
[15] A. V. Olympios et al., “Delivering net-zero carbon heat: Technoeconomic and whole-system comparisons of domestic electricity- and hydrogen-driven technologies in the UK,” Energy Conversion and Management, vol. 262, 2022. doi: 10.1016/j.enconman.2022.115649.
[16] E. J. Markey et al., “Economic impact of thermal energy storage on natural gas power with carbon capture in future electricity markets,” International Journal of Greenhouse Gas Control, vol. 133, 2024. doi: 10.1016/j.ijggc.2024.104098.
[17] C. K. Chyong, D. M. Reiner, R. Ly, and M. Fajardy, “Economic modelling of flexible carbon capture and storage in a decarbonised electricity system,” Renewable & Sustainable Energy Reviews, vol. 188, 2023. doi: 10.1016/j.rser.2023.113864.
[18] C. M. He, K. J. Jiang, P. P. Xiang, Y. J. Jiao, and M. Z. Li, “Electricity Demand Characteristics in the Energy Transition Pathway Under the Carbon Neutrality Goal for China,” Sustainability, vol. 17, no. 4, 2025. doi: 10.3390/su17041759.
[19] D. Liu et al., “Electricity-Carbon Joint Trading of Virtual Power Plant with Carbon Capture System,” International Transactions on Electrical Energy Systems, vol. 2023, 2023. doi: 10.1155/2023/6864403.
[20] M. Jiao, M. Yang, M. B. Li, Y. M. Zhang, and P. Li, “Enhanced dispatch model for park-level integrated energy system considering electricity-carbon collaboration,” Electric Power Systems Research, vol. 246, 2025. doi: 10.1016/j.epsr.2025.111674.
[21] P. Lisbona, S. Pascual, and V. Pérez, “Evaluation of Synergies of a Biomass Power Plant and a Biogas Station with a Carbon Capture System,” Energies, vol. 14, no. 4, 2021. doi: 10.3390/en14040908.
[22] K. H. M. Al-Hamed and I. Dincer, “Exergoeconomic analysis and optimization of a solar energy-based integrated system with oxy-combustion for combined power cycle and carbon capturing,” Energy, vol. 250, 2022. doi: 10.1016/j.energy.2022.123814.
[23] W. Q. Li, F. Zhang, L. Y. Pan, and Z. Li, “Gas or electricity? Regional pathway selection under carbon neutrality target: A case study of industrial boilers,” Journal of Cleaner Production, vol. 349, 2022. doi: 10.1016/j.jclepro.2022.131313.
[24] J. X. Li, M. Chen, D. Q. Qu, and X. J. Ma, “A Hybrid Real-Time Electricity Pricing Strategy with Carbon Capture, Storage and Trading,” Electric Power Components and Systems, vol. 2024. doi: 10.1080/15325008.2024.2319710.
[25] P. P. Chinaris, G. N. Psarros, E. S. Chatzistylianos, and S. A. Papathanassiou, “Impact of Natural Gas Price Variations and Consumption Limitation on the Decarbonization of Sector-Coupled Energy Systems,” Ieee Access, vol. 11, pp. 131573–131596, 2023. doi: 10.1109/access.2023.3334397.
[26] J. Yuan, H. X. Gu, V. C. Nian, and L. Zhu, “Influence of system boundary conditions on the life cycle cost and carbon emissions of CO2 transport,” International Journal of Greenhouse Gas Control, vol. 124, 2023. doi: 10.1016/j.ijggc.2023.103847.
[27] A. Banu et al., “Life cycle cost analysis of direct air capture integrated with HVAC systems: Utilization routes in formic acid production and agricultural greenhouses,” Journal of Environmental Chemical Engineering, vol. 13, no. 3, 2025. doi: 10.1016/j.jece.2025.116201.
[28] D. Y. Lei, Z. H. Zhang, Z. J. Wang, L. Y. Zhang, and W. Liao, “Long-term, multi-stage low-carbon planning model of electricity-gas-heat integrated energy system considering ladder-type carbon trading mechanism and CCS,” Energy, vol. 280, 2023. doi: 10.1016/j.energy.2023.128113.
[29] L. X. Wang, H. D. Zhao, D. W. Wang, F. Dong, T. M. Feng, and R. Xiong, “Low-Carbon Economic Dispatch of Integrated Energy System Considering Expanding Carbon Emission Flows,” Ieee Access, vol. 12, pp. 104755–104769, 2024. doi: 10.1109/access.2024.3435051.
[30] Y. M. Zhang, P. K. Sun, X. Q. Ji, F. S. Wen, M. Yang, and P. F. Ye, “Low-Carbon Economic Dispatch of Integrated Energy Systems Considering Extended Carbon Emission Flow,” Journal of Modern Power Systems and Clean Energy, vol. 12, no. 6, pp. 1798–1809, 2024. doi: 10.35833/mpce.2023.000743.
Biographies
Hui Pan (born June 1985), female, Han ethnicity, from Laibin, Guangxi. She holds a bachelor’s degree and works as an engineer. Her research focuses on electricity pricing policies and electricity market trading.
Chan Yang (1979.11–) Female, Han ethnicity, from Beiliu, Guangxi, Bachelor’s degree, Senior Economist, Research focus: electricity pricing policy, electricity market trading.
Xi Wei (1981.6–) Male, Dong ethnicity, from Liuzhou, Guangxi, Bachelor’s degree, Engineer, Research focus: new energy policy, electricity market trading.
Dongliang Chen (1989.11–) Male, Han ethnicity, from Shaoyang, Hunan, Bachelor’s degree, Senior Engineer, Research focus: electricity application installation, metering management.
Tongtong Pan (1978.7–) Female, Zhuang ethnicity, from Laibin, Guangxi, Bachelor’s degree, Engineer, Research focus: electricity application installation, metering management.
Jiaying Wang (1993.7–) Female, Zhuang ethnicity, from Liuzhou, Guangxi, Bachelor’s degree, Engineer, Research focus: electricity consumption forecasting analysis.
Strategic Planning for Energy and the Environment, Vol. 44_4, 933–956.
doi: 10.13052/spee1048-5236.44413
© 2025 River Publishers