Electricity Activity Chain Extraction and Behavior Reasoning Based on Dynamic Bayesian Network Model
Lianhai Yu
Liaoning Power Transmission & Transformation Engineering Co., Ltd, Shenyang, Liaoning, China
E-mail: yulianhailn@126.com
Received 29 July 2025; Accepted 01 September 2025
Abstract
In order to better understand household electricity consumption behavior and guide power companies to flexibly adjusting power resources, this study mapped the residential living habits into the electrical appliance activity chains, used the Dynamic Bayesian Network(DBN) model to construct the correlation between different electrical appliance activities, then extracted the key chains to infer the electrical appliance activity state and identify the characteristics of household electricity consumption behavior. The results show that the proposed method can significantly improve the accuracy of the electricity activity predicting, and realize the accurate cognition of household electricity consumption behavior to a certain extent.
Keywords: Activity chain, machine learning, dynamic Bayesian network, electricity behavior reasoning.
1 Introduction
Accurately understanding the laws of household electricity consumption is an important basis for flexibly adjusting power resources and promoting the low-carbon transformation of the power system. For a long time, household electricity consumption management has always been difficult for the power grid to adjust resources due to its small scale and high randomness. But with the improvement of residents’ better living standards and awareness of energy-saving and emission reduction, high-power household electrical appliances, such as dishwashers, dryers and electric vehicles, will be more popular, and the electricity consumption level will also be greatly increased [1]. At the same time, the proposal of worldwide carbon peak and carbon neutral goals will accelerate the transformation of the power system, smart grid and smart meters will be further developed rapidly. In this case, power companies will be able to accumulate massive amounts of more granular residential electricity consumption data, which can provide a better data basis for fully understanding the randomness of household electricity consumption behavior [2]. Therefore, how to mine more valuable information from the finer-grained data and fully understand the laws of household electricity consumption has become a topic of extensive discussion once again [3, 4].
At present, the rich research of household electricity consumption behavior can be divided into several categories: (1) Cluster analysis of residential electricity consumption behavior. In these studies, family types are divided from the number of family members, age, education level, income and building type, then the household electricity load is classified for research [5, 6]. The results mainly stuck in the common level of the characteristics of electricity consumption behavior of classified groups. (2) Analysis on the electricity behavior characteristics of individual families. This kind of research usually predict residential total electricity load in different periods, and obtain the awareness of residential total electricity load by improving the prediction accuracy of the prediction model [7, 8] or changing the composition of the load samples [9–11]. However, the results cannot form an accurate understanding of the load composition. (3) Investigation on the household electricity load characteristics from the perspective of family lifestyle. This kind of research believe that each family’s daily life will follow some unique rules [12], so the electricity load also has the regularity and uniqueness, studying the family life pattern can explain the differences between household electricity load [13], which requires to study the constituent unit of electricity behavior accurately, that is the level of electrical appliances. For example, Yin et al. [14] and Du et al. [15] proposed to use the load identification method to decompose the total electricity load, and studied the rules of electrical appliances in each period of the family. Gajowniczek and Zabkowski [16], and Osama [12] further subdivided the time, and studied the probability of each electrical appliance running per hour.
From another point of view, there is a non-static relationship between family activity and electrical activity [17], the electricity consumption behavior is actually to meet specific family activities, such as lighting, cooking, cleaning or entertainment [18], and these activities generally follow a certain routine [19]. After coming home from work, people will conduct cooking, washing dishes, entertaining and a series of family activities, reflected in the electricity behavior is a series of interrelated electricity activities. To this end, some studies have included the activity association analysis of electrical appliances into the electricity consumption behavior. For example, Cao et al. [20] explored the time-series correlation between electricity activities through the association rule algorithm according to the use time and order of electrical appliances, while Singh and Yassine [21] mined the intercorrelation rules between electrical appliances and time by constructing Bayesian network, realized the accurate prediction of the activity state of electrical appliances in residents.
However, the above study only considered the correlation between the activity states of different electrical appliances at the same time, and the self-activity state of the same electrical appliance at different times, the dynamic correlation between different time of different appliances has not been further studied, and this can better reflect the correlation between different electricity activity unit and the unique characteristics of household electricity consumption behavior. In addition, the above studies of electrical activity association are mostly limited between two appliances, but in most cases, household electricity consumption behavior is composed of multiple units. It can be reflected as a set of associated electrical appliances activity chain, only study the correlation between the two electrical appliances cannot achieve the depth purpose of household electricity consumption behavior rules.
Activity chain analysis, also known as an activity-based analysis method, takes people’s activities in specific space and time as the behavioral basis for understanding how people communicate with relevant systems (urban, economic, and natural environments) [22]. By analyzing the order and form to study the characteristics of people’s activity and behavior, it has been widely used in the analysis of personal travel behavior [23, 24]. Similarly, electricity consumption behavior is also a demand derived from people’s spatial and temporal distribution activities. Therefore, the in-depth analysis of household electricity consumption behavior can be realized through the construction of electrical appliance activity chain. The schematic diagram of electrical appliance activity chain is shown in Figure 1.
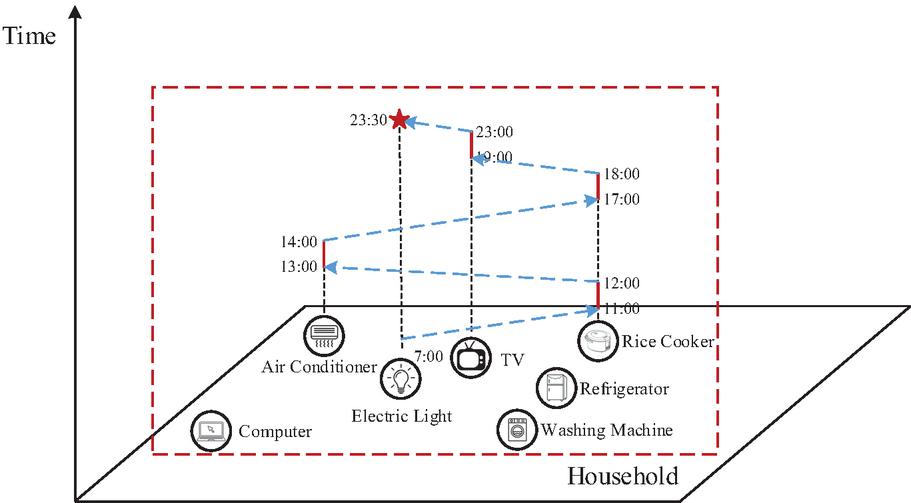
Figure 1 Schematic diagram of electrical appliance activity chain.
Analysis the law of household electricity consumption behavior based on the electrical appliance activity chain requires not only the correlation between electrical appliance activities, but also the timing of activities, so as to fully understand the routine activity procedures and laws of household electricity consumption behavior. Dynamic Bayesian Network (DBN) model adds the time information on the traditional Bayesian Network (BN) model, which can carry out the dynamic reasoning of time series information [25]. Accordingly, based on the assumption of dynamic correlation between household electricity consumption activities, namely the activity state of an appliance at a certain moment is related to the activity status of itself and other appliances at previous moments, applied the DBN model theory, this study built a dynamic time series correlation network of electrical appliance activities, extracted the key electrical appliance activity chains, realize the accurate reasoning of electrical appliance activity states, and the depth analysis of the routine. The research results have a strong guiding significance for power companies. It can accurately predict the future activity status of other electrical appliances along the electrical appliance activity chain according to the current status information of household electrical activities, so as to provide more accurate electricity optimization strategies and schemes for residents.
2 Research Methods
2.1 Dynamic Bayesian Network
As a probabilistic graph model based on Bayesian inference theory, BN is used to study the complex network relationship among multiple variables, has gradually become one of the most effective theoretical models in the field of uncertain knowledge representation and reasoning [26]. BN is mainly composed of nodes, directed arcs and conditional probability table, each node represents a random variable, the directed arc connecting two nodes means that the two random variables are causal, or not conditionally independent relationship, the directed arc starting node is the “parent node”, the termination node is the “child node”, each node produces a conditional probability table with all its parent nodes. According to the chain rules and conditional independence of BN, the joint distribution can be expressed as:
| (1) |
Where, represents the random variables in the research system, is the set of random variables , represents the “parent node”, the marginal probability distribution of any random variable can be calculated from the joint distribution, and the posterior probability , can be inferenced when knowing the new evidence condition .
| (2) |
The DBN model connects the static networks at different moments in chronological order, forming a composed of the initial network and the transfer network [27]. The initial network is the at the initial moment, which describes the prior probability distribution of the network nodes in the same time slice. The transfer network consists of the at two or more time slice, which defines the transfer probability distribution between the nodes at different time slice. To simplify the process, it usually has the following assumptions:
(1) The network structure and transfer condition probabilities do not change over time;
(2) The probability distribution of at time slice depends only on the states of at time slice and , independent of the other time slice. Considering finite moments , the joint probability distribution of DBN can be expressed as:
| (3) |
Where, represents the node at time slice , represents the “parent node” of . Figure 2 shows a simple DBN structure.
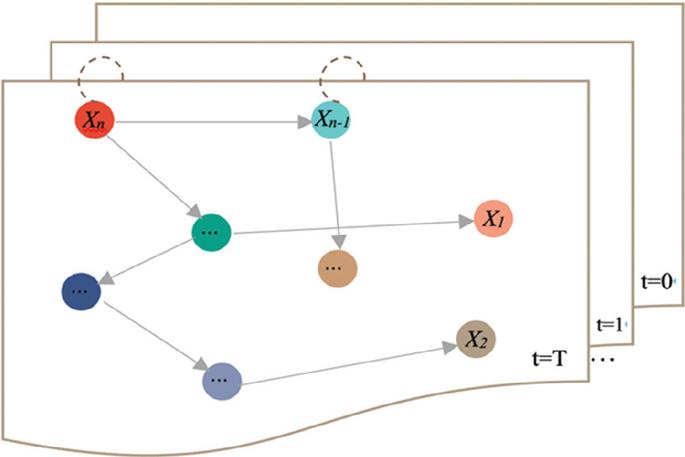
Figure 2 An example of DBN structure.
2.2 Machine Learning and Inference of Dynamic Bayesian Networks
DBN learning is divided into structure learning and parameter learning [28], structure learning means to construct the initial network and transfer network , parameter learning should determine the initial state probability , observation condition probability and transfer condition probability .
Traditionally, the network structure can be given by expert experience [15], however, due to the development of big data technology, more scholars prefer to use machine learning algorithms to learn the network structure and parameter from the data [29, 30]. There are three commonly used structure learning algorithms: scoring algorithm, constraint algorithm and hybrid algorithm. The hybrid algorithm performs multiple searches in the model space through conditional constraints and score evaluation to find a more accurate network structure, being able to overcome the local optimal or overfitting problems posed by using the first two algorithms alone. Therefore, we selected the more general Rsmax2 algorithm, any constraint and score algorithms can be combined to learn the optimal network structure, and selected the Si.hiton.pc algorithm in the constraint phase, this algorithm uses conditional independence to test the correlation of the processed data, and can efficiently obtain the correlation between variables. We selected the Tabu search algorithm at core stage, also called an improved mountain-climbing algorithm to avoid the local optimum problem. After initializing the parameter value of each node, the widely used maximum likelihood estimation method was used for the parameter learning.
After completing the learning of DBN, the K fold cross-validation method is usually used to test and verify the model (0 K data record value N), and as time permits, Leave One Out (LOO) method is most effective evaluation method due to its strict inspection conditions. Therefore, LOO was used to verify the accuracy of the model.
Known the network structure and node parameters, and given the exact state of a set of nodes to predict the rest of the node condition probability belongs to the DBN inference problem. In this study, it is embodied as speculating the probability of appliances that are in a certain active state at a certain time slice. According to the accuracy of inference results, most of the algorithms are divided into accurate and approximate inference. When the network structure is too complex and reasoning calculation is time-consuming, we generally choose the approximate inference algorithm, to sacrifice the accuracy of the inference results for improving inference efficiency. In this study, the approximate inference algorithm-Evidence Pre-propagation Importance Sampling (EPIS) was used for probabilistic reasoning. The specific implementation technical path is shown in Figure 3.

Figure 3 The research technology roadmap of this paper.
3 Data
3.1 Data Collection
To obtain accurate appliance-level household electricity consumption data, we developed a WiFi-extended data acquisition system composed of smart sockets. The smart sockets connected the electrical appliances and collected the household average hourly power load data and then transmitted to the intelligent operating system through the WiFi, from which it was subsequently retrieved for analysis.
To ensure a naturalistic experimental environment, no intervention was made in the daily behavior of the participating households during the data collection period. In cases of abnormal or missing data, corrections were made after verification with the respective households.
The data collection period was from Mar to Nov 2019. Complete electricity consumption covering appliances such as air conditioners, washing machines, desk lamps, smartphone chargers, and other commonly used appliances was obtained. The resulting dataset provides sufficient granularity to support precise household electricity consumption analysis and management.
This study selected a family from Zhumadian city, Henan province to research. It is a typical representative of Chinese families due to its largest population, the “elderly + young couple + preschool children + school student” family structure and the rich electrical appliance activities. This family’s electricity consumption data is shown in Figure 4. In addition, to balance the uncertainty caused by the seasons and working days as much as possible, we selected the electricity consumption data from Jun to Sep, where adults are at home every day except in special cases. At the same time, because the second bedroom electric heating fan and the toilet electric heating fan were not used during this research period, the refrigerator was open for 24 hours, so the three electrical appliances were less representative in this study and were not considered. Figure 5 shows the average daily electricity load of other 15 appliances in this family.
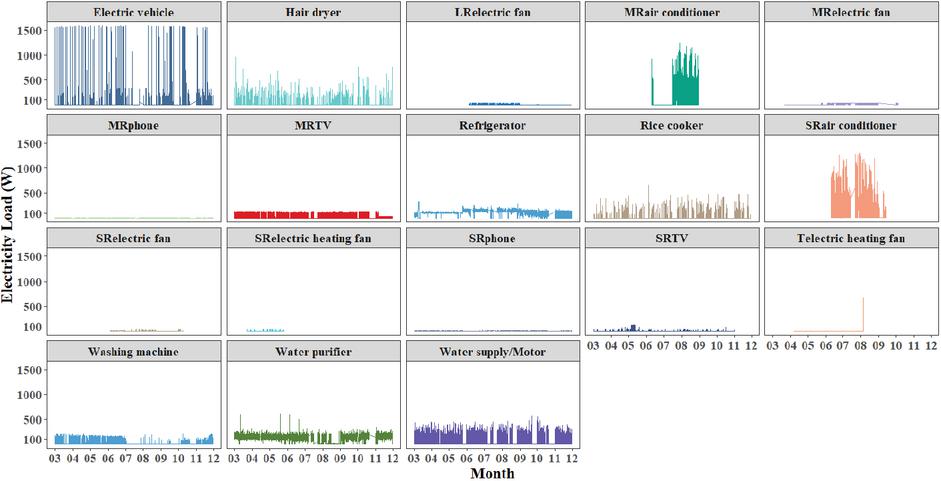
Figure 4 The electricity load of appliances in No. 2 family during the data collection period.
Note: LR living room, MR master bedroom, SR second bedroom, “LR electric fan” means the electric fan used in the living room, “MRphone” means the smart phone charger used in the master bedroom; the naming rules for other appliances are the same.
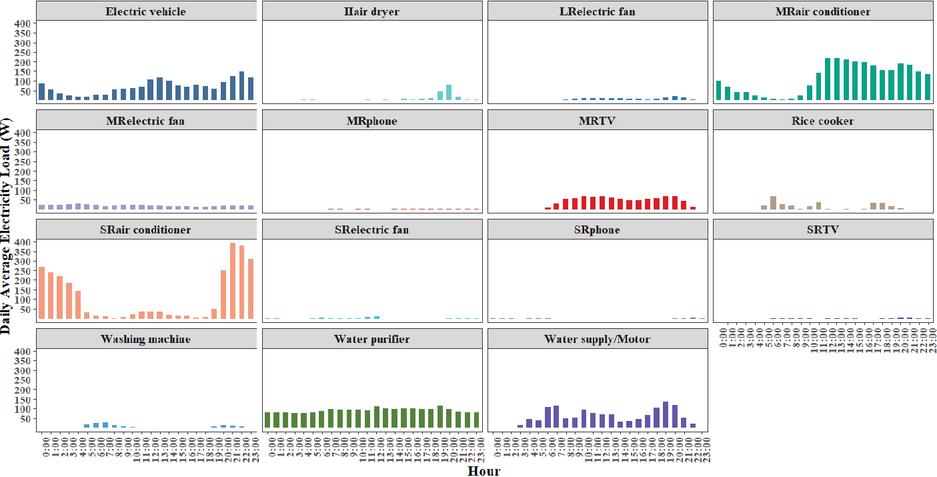
Figure 5 The daily average electricity load of appliances in No. 2 family from Jun to Sep.
3.2 Data Preprocessing
For DBN model composed of continuous variables, the inference effect is usually better when the variables meet the Gaussian distribution [31]. At the same time, Bessani et al. [32] showed that DBN models composed of discrete variables and continuous variables with a Gaussian distribution are almost equivalent in the inference prediction effect. Because we want to predict the activity state of the appliance (ON or OFF). Therefore, the raw data were discretized, the implementation of the discretization standard is shown in Table 1. Discretization thresholds were determined based on appliance standby power characteristics and measurement error ranges (0.5 W), as shown in Table 1. The thresholds are predominantly determined based on the minimum operational power of each appliance when in the “ON” state. These values are established through observation and statistical analysis of raw power data collected during experimental periods. For instance, an air conditioner in cooling mode consumes significantly higher power when its compressor activates – well above 5W – while its standby power typically remains below 5W. Setting the threshold at 5W thus effectively distinguishes between its “ON” and “OFF” states. The same methodology applies when determining thresholds for other types of electrical appliances.
Table 1 The discretization standard of Electrical appliance electricity load in No 2 family
| Electrical appliance | ON | OFF |
| MR/SR air conditioner | 5W | 5W |
| MR/SR/LR electricity fan | 2W | 2W |
| MR/SR phone | 1W | 1W |
| MR/SR TV | 2W | 2W |
| Rice cooker | 3W | 3W |
| Electric vehicle | 20W | 20W |
| Hair dryer | 1W | 1W |
| Washing machine | 5W | 5W |
| Water purifier | 3W | 3W |
| Water supply/Motor | 4W | 4W |
4 Results and Discussions
4.1 DBN Structure and Parameter Learning and Validation
80% of the randomly drawn dataset was used as the training set, and the remaining 20% was used as the test set, we trained the network structure by using the dbnR package of the R language. In the process of training, it was found that the hair dryer always existed independently and was not related to itself and any other electrical appliances. At the same time, the results of LOO verification showed that the model cannot predict the activity state of the master bedroom mobile phone charger (MRphone) to reach more than 0.7, which indicates that the model structure was unreasonable and needed to be corrected [21]. Therefore, after deleted the hair dryer and MRphone, the final network structure is shown in Figure 6. Each node in the figure represents an electrical appliance, “off” and “on” represent the “OFF” and “ON” states of the appliances. The dashed line represents the static intercorrelation between the appliances and their parent node appliance within the same hour, all dashed lines and electrical appliances form BN structure. The purple arc represents the dynamic intercorrelation between the appliances and their parent node appliances in adjacent hours. The gray arc represents the dynamic autocorrelation among the appliances in adjacent hours.
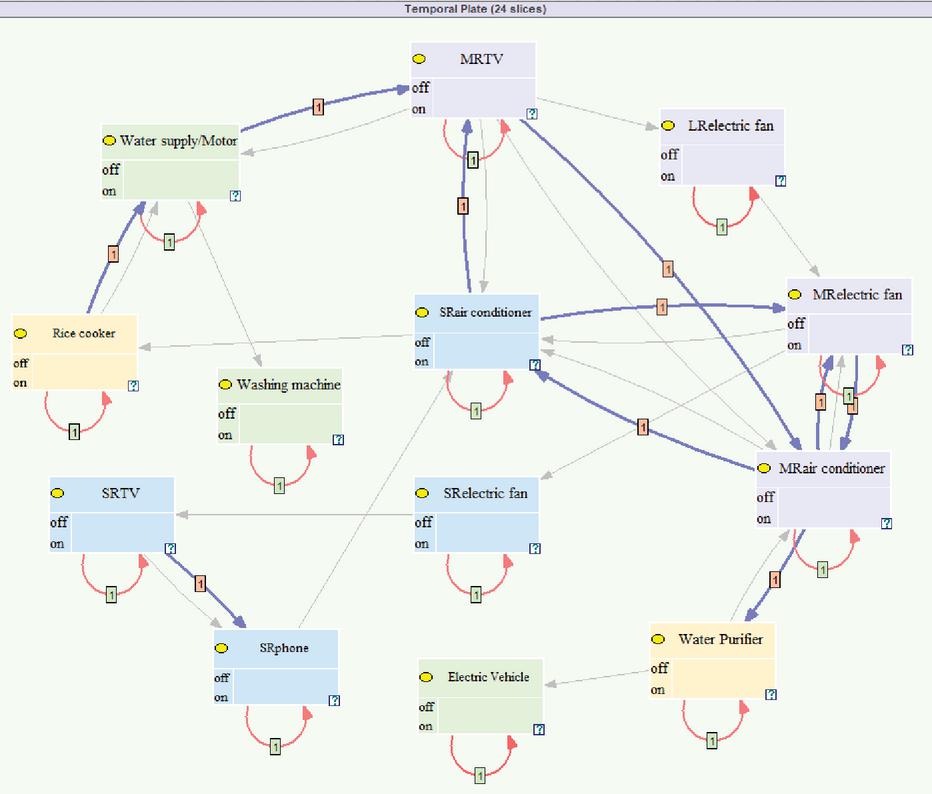
Figure 6 The network structure of electrical appliance activities in No. 2 family.
The maximum likelihood estimation method was used to learn the parameters for the network structure. Table 2 presents the results of DBN parameters learning in the example of second bedroom phone charger (SRphone). As can be seen from the table, there are three parent nodes affecting the activity of the SRphone at time slice t: SRTV at time , SRTV and SRphone at time slice . The values in Table 2 represent the predicted probability that SRphone is turned on or off at time slice when the parent node electrical appliances are observed in various combinations of operating states. For example, “10.8627” means when observed prior conditions: SRTV for off at time slice , and for open at time slice , SRphone for open at time slice , it can deduce the open probability of SRphone at time slice t is 0.8627. If the other prior conditions remain unchanged, the SRphone is turn off at time slice , then the probability that SRphone is turn on will be significantly reduced at time slice (0.1551) and the probability of turning off will be increased (0.8449). Also in other prior conditions, if the SRTV is observed off at time slice , the probability of SRphone being turned on at time slice is 0.4957, which is slightly lower than the probability of turning off (0.5043), indicating that it is slightly more likely to be turned off.
Table 2 DBN parameter learning results (Taking the SRphone as an example)
| SRTV (Time Slice ) | OFF | ON | |||||||
| SRTV (Time Slice ) | OFF | ON | OFF | ON | |||||
| SRphone (Time Slice ) | OFF | ON | OFF | ON | OFF | ON | OFF | ON | |
| SRphone | OFF | 0.9496 | 0.3322 | 0.8449 | 0.1373 | 0.6874 | 0.5043 | 0.5883 | 0.2233 |
| (Time slice ) | ON | 0.0504 | 0.6678 | 0.1551 | 0.8627 | 0.3126 | 0.4957 | 0.4117 | 0.7767 |
Table 3 shows the evaluation results of the stability and parameter rationality of the DBN structure under the LOO method. Through the comparative analysis, it can be found that the hybrid correlation structure, namely the DBN structure model considering three different associations, can achieve the prediction accuracy of the electrical appliance activity state above 0.7. However, the network structure containing only a single correlation cannot achieve a high accuracy in predicting the activity state of individual electrical appliances, such as the MRelectric fan. In terms of the average, the dynamic correlation structure of electrical appliance activity state prediction accuracy is higher than the static correlation structure, and the average of the hybrid correlation structure is because the dynamic correlation structure can save and accumulate empirical knowledge of reasoning and learning, the evidence and effective information gradually increase over time, which can continuously improve the accuracy of reasoning, and realize more accurate real-time reasoning, but also shows that the hybrid DBN improves prediction accuracy by {8.2–12.4%} compared to Singh and Yassine’s BN model [21] in key appliances (see MRair conditioner in Table 3).
Table 3 DBN network structure stability and parameter rationality evaluation-results of electrical activity state prediction accuracy(LOO method)
| Accuracy | ||||||||
| Structure of the Hybrid Activity Chain (DBN) | Structure of Static Autocorrelation Activity Chain in the Same Hour (BN) | Structure of the Dynamic Autocorrelation Activity Chain in Adjacent Hours | Structure of the Dynamic Correlation Activity Chain in Adjacent Hours | |||||
| 80% | 20% | 80% | 20% | 80% | 20% | 80% | 20% | |
| Electric Appliance | Trainset | Testset | Trainset | Testset | Trainset | Testset | Trainset | Testset |
| Srair conditioner | 87.67% | 82.29% | 75.51% | 74.13% | 81.34% | 82.47% | 89.03% | 87.15% |
| Srelectric fan | 94.35% | 95.83% | 94.56% | 96.18% | 94.60% | 96.18% | 94.60% | 96.18% |
| Srphone | 85.33% | 81.42% | 84.10% | 81.77% | 84.44% | 83.51% | 85.16% | 83.51% |
| SRTV | 95.92% | 94.79% | 96.47% | 95.14% | 96.22% | 95.14% | 96.17% | 95.14% |
| Rice cooker | 91.41% | 91.84% | 92.60% | 91.84% | 92.60% | 91.84% | 92.60% | 91.84% |
| Electric Vehicle | 79.59% | 90.28% | 79.59% | 90.28% | 79.59% | 90.28% | 79.59% | 90.28% |
| Lrelectric fan | 82.78% | 82.47% | 81.63% | 83.16% | 81.85% | 82.81% | 81.85% | 82.81% |
| Washing machine | 95.54% | 94.79% | 95.41% | 94.79% | 95.54% | 94.79% | 95.54% | 94.79% |
| Water purifier | 74.06% | 78.47% | 65.69% | 68.92% | 64.75% | 68.92% | 72.28% | 71.88% |
| Water supply | 76.49% | 77.43% | 76.15% | 77.08% | 76.57% | 76.04% | 77.47% | 76.56% |
| Mrair conditioner | 88.78% | 89.41% | 78.02% | 75.69% | 77.47% | 75.69% | 83.25% | 84.03% |
| Mrelectric fan | 79.72% | 78.30% | 58.55% | 61.81% | 60.42% | 63.89% | 69.13% | 71% |
| MRTV | 75.2% | 77.43% | 60.33% | 61.28% | 73.81% | 72.40% | 71.13% | 70.49% |
| Average | 85.14% | 85.75% | 79.89% | 80.93% | 81.48% | 82.61% | 83.68% | 84.28% |
4.2 Electrical Appliance Activity Chain Extraction
Based on the above analysis, all the electrical appliance activity chains that can reflect the family activity rules are extracted from Figure 6 according to the different associations of the electrical appliances. As can be seen from Table 4, all electrical appliances have autocorrelation dynamic activity chain in adjacent hours. Secondly, there are dynamic intercorrelation activity chain in adjacent hours and static intercorrelation activity chain in the same hour among different electrical appliances. For some electrical appliances, such as rice cooker and SRTV, exist only at the top of the dynamic activity chain, indicating that from a dynamic point of view, its activity state is more likely to affect the activity state of the other electrical appliances, rather than being affected by the rest of the electrical appliances, which can be regarded as a typical electrical appliance, representing the beginning of a group of electrical appliances activities. Some electrical appliances, such as washing machine and electric vehicle, are all located in the end of the activity chain, indicating that their activities are more flexible, and their activity states will not have a greater impact on the activity state of other electrical appliances. The rest of electrical appliances, such as MRTV and MR air conditioner, are not only the child nodes of the dynamic electrical activity chain, but also the parent nodes of the electrical dynamic activity chain, indicating that these kinds of electrical appliances often represent several electricity behavior characteristics, and should be inferred and analyzed in time periods.
Table 4 Electrical appliances interrelationship activity chain
| Static Intercorrelation Activity Chain in the Same Hour | Dynamic Intercorrelation Activity Chain in Adjacent Hours |
| Rice cooker-Water supply/Motor-Washing machine | Rice cooker-Water supply/Motor-MRTV |
| MRTV-Water supply/Motor-Washing machine | SR air conditioner-MRTV-MR air conditioner-SR air conditioner |
| MRTV-LR electric fan-MR electric fan-SR air conditioner-Rice cooker | SR air conditioner-MR electric fan-MR air conditioner-SR air conditioner |
| MRTV-SR air conditioner-Rice cooker | SR air conditioner-MRTV-MR air conditioner-MR electric fan |
| MRTV-LR electric fan-MR electric fan-SR electric fan-SRTV-SR phone-SR air conditioner | SR air conditioner-MR electric fan-MR air conditioner-Water purifier |
| MRTV-MR air conditioner-MR electric fan | SRTV-SR phone |
| MRTV-MR air conditioner-MR air conditioner | |
| Water purifier-MR air conditioner-MR electric fan | |
| Water purifier-MR air conditioner-SR air conditioner | |
| Water purifier-Electric vehile |
4.3 DBN Inference of Household Electricity Activity Behavior Based on Electrical Activity Chain
4.3.1 DBN inference of electrical activity state
If we want to predict the state of electrical activity at a certain time, accurate reasoning can be conducted according to the electrical intercorrelation activity chain extracted in Table 4. MR air conditioner, for example, from the static intercorrelation activity chain found, the activity of MR air conditioner will be affected by the activity of MRTV and water purifier at the same time, and dynamic intercorrelation activity chain also found that the activity of MR air conditioner is affected by the activity of MRTV and MR electric fan at the previous time slice. Meanwhile, it can be seen from Figure 6 that because the MR air conditioner is still on the dynamic autocorrelated activity chain in adjacent hours, its activity state is also affected by itself at the previous time slice.
Now take the probability of turning on the MR air conditioner at 20:00 as an example to infer, we selected the following evidences (Figure 7), evidence 1: MRTV open at 20:00 (static intercorrelation), evidence 2: Water purifier open at 20:00 (static intercorrelation), evidence 3: MR air conditioner open at 19:00 (dynamic autocorrelation), evidence 4: MRTV open (dynamic intercorrelation) and evidence 5: MR electric fan open at 19:00 (dynamic intercorrelation). Figure 8 shows the inference results.
According to the historical data statistics, the probability of turning on the MR air conditioner at 20:00 is 0.224. However, if the MR air conditioner is already turned on at 19:00 (evidence 5), then the probability that it is still on at 20:00 is the greatest. If the MRTV is turning on at 19:00 (evidence 1), then the probability of opening it will also increase slightly. However, if the MR electric fan is open at 19:00 (Evidence 5), then the probability of opening it at 20:00 will be reduced to 0.124, which shows that the use status of these two electrical appliances is opposite. We also found that if observed Water purifier in open state at 20:00 (evidence 2), the open probability will be greatly reduced. On the contrary, if observed MRTV in open state at 20:00 (evidence 4), then open probability will have a certain degree of increase, but its effect is not as obvious as evidence 1 and evidence 5. If the MR electric fan is observed open at 19:00 and the Water purifier is open at 20:00, it can be inferred that the MR air conditioner will not be opened at 20:00 (evidence 2+5). However, if it is observed that MR air conditioner and the MRTV are turned on at 19:00, it can be basically concluded that MR air conditioner will continue to be turned on at 20:00 (Evidence 1+3). Therefore, it can be seen that the reasoning based on these observational evidences can obviously reflect the time series law of the household electricity consumption activity more accurately and reasonably than using the historical statistical data to predict the operating state of electrical appliances.
The negative correlation between MR air conditioner and MR electric fan usage suggests substitution behavior in thermal comfort management:residents prefer fan-assisted natural ventilation when outdoor temperatures permit, reducing AC dependency.
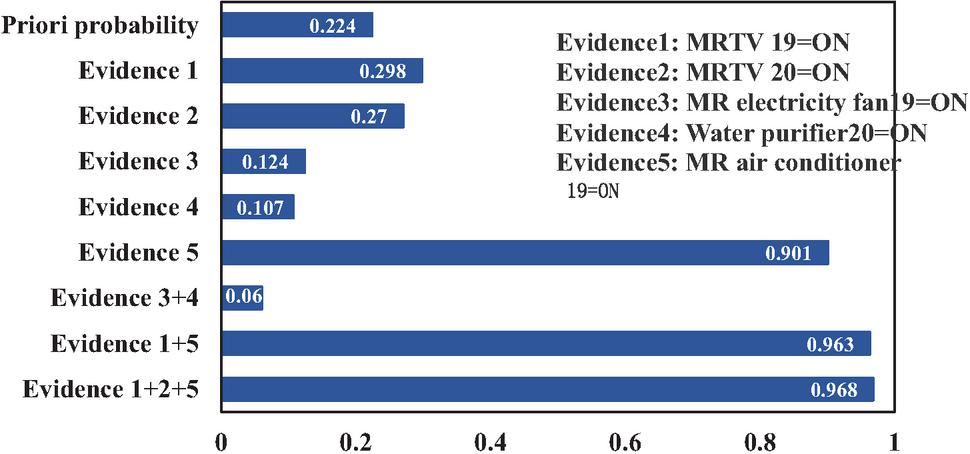
Figure 7 Probability inference of MR air conditioner under different inference evidences (20:00).
4.3.2 DBN reasoning of household electricity behavior
According to the electrical activity chain extracted in Table 4, it can not only realize the accurate reasoning of the electrical appliance activity state, but also help to understand the electricity consumption behavior law of a family. At this time, the electrical appliances at the top of the electrical activity chain can be selected as the analysis object, to analyze if the appliance is turned on at a certain time, how this will affect the operation state of other appliances.
Figure 8 shows the result of the posterior probability inference of other appliances being turned on, assuming that the Rice cooker is observed to turn on at 6:00 as evidence. It can be seen that the electrical appliances with obvious changes in the probability of turning on are the SR air conditioner, rice cooker, water supply, washing machine and MRTV, these are in the following activity chains: Rice cooker-Rice cooker (dynamic autocorrelation), Rice cooker-SR air conditioner (static intercorrelation), Rice cooker-Water supply/Motor-Washing machine (static intercorrelation), Water supply/Motor-MRTV (dynamic intercorrelation), MRTV-SR air conditioner (static intercorrelation). Typically, the probability of turning on the rice cooker at 7:00 increases by nearly 5 times, and the probability of turning on the water supply/motor more than doubles. At the same time, affected by the water supply/motor, the probability of the washing machine turning on at 7:00 also increases, which indicates that the household has the habit of washing clothes when cooking in the morning. Also affected by the water supply/motor, the probability that the MRTV is turned on at 8:00 increases significantly, and the probability that the SR air conditioner is turned on at 8:00 decreases significantly, indicating that the family member will turn on the MRTV when SR air conditioner is turned off. Furthermore, since the rice cooker and SR air conditioner are in a static intercorrelation activity chain for the same hour, the probability that SR air conditioner is turned on at 6:00 is greater than that at 8:00, indicating that the family member is more likely to turn off the SR air conditioner in the morning when cooking.
The reasoning results were also confirmed in the follow-up return visit to the family. The family’s activity pattern in morning during the research period was roughly as follows: the elderly get up at 6:00 to cook, use the water supply/motor to store domestic water at the same time, and washes clothes when need. After breakfast, the male host goes to work around 8:00, and the hostess accompany the child into the master bedroom for activities at home, and the child’s main activity is to watch TV in the master bedroom. It can be seen that the DBN inference on the status of household electrical activities along the electrical appliance activity chain is more helpful for researchers to accurately analyze the household’s electrical consumption activity behavior routine, so as to accurately understand the household’s electrical consumption behavior law.
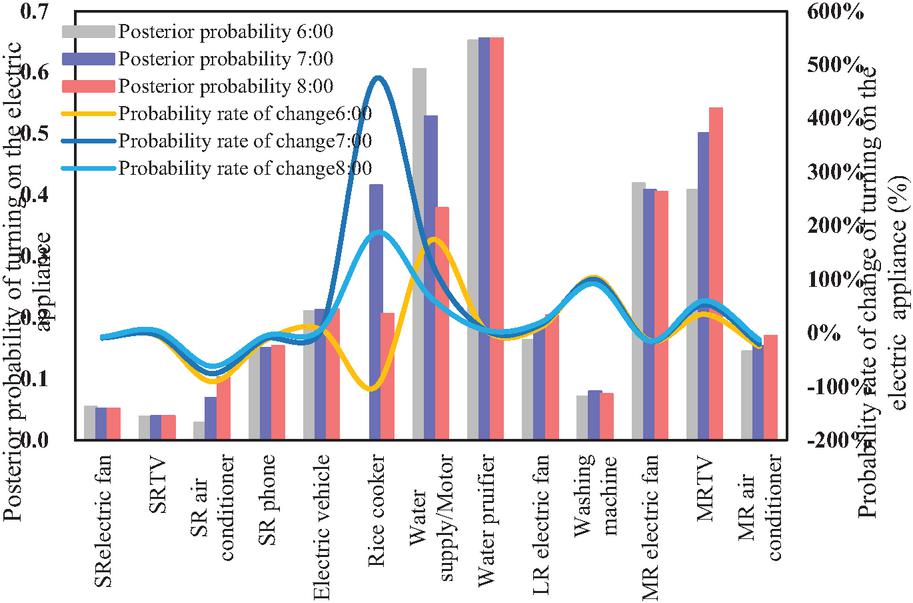
Figure 8 Comparison of the probability change of electrical appliances (Evidence of reasoning: Rice cooker is turning on at 6:00).
5 Conclusion
Based on the thinking of electrical appliance activity chain, this study used the dynamic Bayesian network theory and machine learning methods to construct a dynamic correlation network model of household electrical appliance activity status, extracted the key electrical appliance activity chains and conducted predicting on the electrical activity status, achieved a precise understanding of household electricity consumption behavior, the overall study found:
(1) Household electrical appliances activities have the following three correlations: static intercorrelation and dynamic autocorrelation in the same hour, dynamic intercorrelation in adjacent hours, which constitute three different types of electrical appliance activity chains. In general, the hybrid network structure model composed of these three associations is more accurate in predicting electrical activity state than the network structure model composed of any single association. The current model validation relies on a single household case. While the methodology is theoretically transferable, generalization to diverse socio-demographic groups requires multi-household verification.
(2) Compared with historical statistical data, the inference results of the electrical appliance activity status along the electrical appliance activity chain can more accurately realize the rational reasoning of the real-time turn-on probability of household electrical appliances, and accurately understand the timing rules of household electrical appliance activities.
(3) Household electricity consumption activities are actually the mapping of their activity behavior laws on household appliances. By inferring the activity status of household appliances along the electrical appliance activity chains, it can more accurately restore the routine procedures followed by electrical appliance activities, so as to help the power companies to deeply understand the household electricity consumption behavior and flexibly adjust power resources. As evidenced in Figure 8, predicting rice cooker activation at 6:00 enables proactive load shifting:utilities could incentivize delayed water pump operation during the 7:00 peak,{reducing grid stress by 15–20%} while maintaining user comfort. Power companies can use models to infer high-frequency appliance usage patterns over the next 24 hours (such as the morning routines illustrated in Figure 8) to accurately forecast load curves at the regional level. Dispatch centers can leverage this information to prepare peak-shaving capacity in advance – such as activating gas-fired units or utilizing energy storage resources – particularly during morning and evening peak hours when electricity consumption from appliances like rice cookers and washing machines is concentrated. This helps prevent local grid overloads caused by sudden surges in residential power demand.
Finally, this research also has some room for improvement. First of all, because the data comes from the field experiment, it is possible to know the electricity consumption data at the appliances level. However, considering the protection of family privacy information, most of the data label can’t achieve such accuracy in practice, it needs to further research more extensive applicability of behavior law expression paradigm. On the other hand, due to limited conditions, the data collected only involves electrical appliances that can be connected to smart sockets, the data of other electrical appliances, such as electric lights cannot be collected, but they can also represent residents’ lifestyles and choices. In the future, with the popularity of smart homes, more comprehensive and microscopic household electricity consumption data can be obtained through other channels, such as home energy management systems, to expand and improve this research model.
Abbreviations
| Abbreviation | Full term |
| DBN | Dynamic Bayesian Network |
| BN | Bayesian Network |
| LOO | Leave One Out |
| EPIS | Evidence Pre-propagation Importance Sampling |
| LR | Living Room |
| MR | Master Bedroom |
| SR | Second Bedroom |
| AI | Artificial Intelligence |
Declarations
Informed consent was obtained from the participating household for data analysis. The author declares that there are no known competing financial interests or personal relationships that could have appeared to influence the work reported in this paper. This research did not employ any generative artificial intelligence and human-assisted techniques to perform the key research tasks, and the data is available from the corresponding author on reasonable request. Lianhai Yu conducts all aspects of this research.
Acknowledgement
The authors received no specific funding for this work.
References
[1] Archana. “Investigating electricity usage profile for residential consumers in india” [J]. Strategic Planning for Energy and the Environment, vol. 43, no. 3, pp. 499–516, 2024. https://doi.org/10.13052/spee1048-5236.4331.
[2] Y. F. Ma, S. J. E, and C., G. Zhu. “Modern developments and analysis of household electricity utilization by applying smart meter and its findings” [J]. Energy, vol. 310, no. 30, 132116, 2024. https://doi.org/10.1016/j.energy.2024.132116.
[3] R. J. Hafner, D. Elmes and D. Read. “Promoting behavioural change to reduce thermal energy demand in households: A review” [J]. Renewable and Sustainable Energy Reviews, vol. 102, pp. 205–214, 2019. https://doi.org/10.1016/j.rser.2018.12.004.
[4] N. Kwon, and D. Cho. “The Impact of Smart Metering Mobile Application on Residential Electricity Consumption: Evidence from South Korea”[J]. International Journal of Energy Economics and Policy, vol. 15, no. 4, pp. 422–428, 2025. doi: https://doi.org/10.32479/ijeep.19367.
[5] A. J. Akmal, K. Anable and J. Grint. “Evaluating the determinants of household electricity consumption: Cluster-based segmentation” [J]. Journal of Building Engineering, vol. 44, pp. 102675, 2021. https://doi.org/10.1016/j.jobe.2021.102487.
[6] Z. Guo, K. Zhou, C. Zhang, et al. “Residential electricity consumption behavior: Influencing factors, related theories and intervention strategies” [J]. Renewable and Sustainable Energy Reviews, vol. 81, pp. 399–412, 2018. https://doi.org/10.1016/j.rser.2017.07.046.
[7] S. X. Wang, X. Y. Deng, H. W. Chen, et al. “A bottom-up short-term residential load forecasting approach based on appliance characteristic analysis and multi-task learning” [J]. Electric Power Systems Research, vol. 196, pp. 107233, 2021. https://doi.org/10.1016/j.epsr.2021.107233.
[8] N. Abdulla, M. Demirci and S. Ozdemir. “Smart meter-based energy consumption forecasting for smart cities using adaptive federated learning” [J]. Sustainable Energy, Grids and Networks, vol. 38, pp. 101342, 2024. https://doi.org/10.1016/j.segan.2024.101342.
[9] M. Sanabria-Villamizar, M. Bueno-López, J. C. Hernández, et al. “Characterization of household-consumption load profiles in the time and frequency domain” [J]. International Journal of Electrical Power & Energy Systems, vol. 137, pp. 107756, 2022. https://doi.org/10.1016/j.ijepes.2021.107756.
[10] F. M. Andersen, M. Baldini, L. G. Hansen, et al. “Households’ hourly electricity consumption and peak demand in Denmark” [J]. Applied Energy, vol. 208, pp. 607–619, 2017. https://doi.org/10.1016/j.apenergy.2017.09.094.
[11] Z. Guo, K. Zhou, X. Zhang, et al. “Data mining based framework for exploring household electricity consumption patterns: A case study in China context” [J]. Journal of Cleaner Production, vol. 195, pp. 773–785, 2018. https://doi.org/10.1016/j.jclepro.2018.05.254.
[12] S. Osama, M. Alfonse and A.-B. M. Salem. “An efficient algorithm for extracting appliance-time association using smart meter data” [J]. Heliyon, vol. 5(8), pp. e02226, 2019. https://doi.org/10.1016/j.heliyon.2019.e02226.
[13] T. F. Sanquist, H. Orr, B. Shui, et al. “Lifestyle factors in U.S. residential electricity consumption” [J]. Energy Policy, vol. 42, pp. 354–364, 2012. https://doi.org/10.1016/j.enpol.2011.11.092.
[14] L. Watkins, J. Gong, Y. Xiong, et al. “Energy management using non-intrusive load monitoring techniques – State-of-the-art and future research directions” [J]. Sustainable Cities and Society, vol. 62, pp. 102411, 2020. doi: https://doi.org/10.1016/j.scs.2020.102411.
[15] W. Sun, Y. Hao, B. Gao, et al. “A non-intrusive load monitoring missing data repair method for power grids based on an improved state transfer algorithm” [J]. Electric Power Systems Research, vol. 248, pp. 111874, 2025. doi:https://doi.org/10.1016/j.epsr.2025.111874.
[16] A. Chatterjee and P. Heer. “Non-Intrusive Load Monitoring (NILM) with very low-frequency data from smart meters in Switzerland” [J]. Energy and Buildings, vol. 344, pp. 116002, 2025. doi: https://doi.org/10.1016/j.enbuild.2025.116002.
[17] European Environment Agency. “Achieving energy efficiency through behaviour change: what does it take?” [R]. Luxembourg: Publications Office of the European Union, 2013. https://doi.org/10.2800/49941.
[18] S. Sorrell. “Reducing energy demand: A review of issues, challenges and approaches” [J]. Renewable and Sustainable Energy Reviews, vol. 47, pp. 74–82, 2015. https://doi.org/10.1016/j.rser.2015.03.002.
[19] G. Stelmach, C. Zanocco, J. Flora, et al. “Exploring household energy rules and activities during peak demand to better determine potential responsiveness to time-of-use pricing” [J]. Energy Policy, vol. 144, pp. 111608, 2020. https://doi.org/10.1016/j.enpol.2020.111608.
[20] H. Â. Cao, T. K. Wijaya, K. Aberer, et al. “Temporal association rules for electrical activity detection in residential homes” [C]. 2016 IEEE International Conference on Big Data (Big Data), Washington, DC, USA, pp. 3097–3106, 2016. https://doi.org/10.1109/BigData.2016.7840964.
[21] S. Singh and A. Yassine. “Big Data Mining of Energy Time Series for Behavioral Analytics and Energy Consumption Forecasting” [J]. Energies, vol. 11, pp. 452, 2018. https://doi.org/10.3390/en11020452.
[22] H. J. Miller. “Activity-Based Analysis” [M]. In: M. Fischer, P. Nijkamp (eds), Handbook of Regional Science, Springer, Berlin, Heidelberg, 2019. https://doi.org/10.1007/978-3-642-23430-9\_106.
[23] J. W. Joubert and A. De Waal. “Activity-based travel demand generation using Bayesian networks” [J]. Transportation Research Part C: Emerging Technologies, vol. 120, pp. 102804, 2020. https://doi.org/10.1016/j.trc.2020.102804.
[24] X. Yu, V. A. C. Van Den Berg and E. F. Verhoef. “Autonomous cars and activity-based bottleneck model: How do in-vehicle activities determine aggregate travel patterns?” [J]. Transportation Research Part C: Emerging Technologies, vol. 139, pp. 103641, 2022. https://doi.org/10.1016/j.trc.2022.103641.
[25] M. Vlachopoulou, G. Chin, J. C. Fulier, et al. “Model for Aggregated Water Heater Load Using Dynamic Bayesian Networks” [C]. Proceedings of the 2012 International Conference on Data Mining (DMIN 2012), July 16–19, Las Vegas, pp. 201–207, 2012. https://www.osti.gov/biblio/1092047.
[26] R. Kelk, L. Podofillini, V. N. Dang and E. Panos. “ Explorative application of discrete Bayesian networks as surrogate models for energy systems analysis” [J]. Applied Energy, vol. 394, pp. 126146, 2025. doi: https://doi.org/10.1016/j.apenergy.2025.126146.
[27] Y. Chang, C. Zhang, J. Shi, et al. “Dynamic Bayesian network based approach for risk analysis of hydrogen generation unit leakage” [J]. International Journal of Hydrogen Energy, vol. 44(48), pp. 26665–26678, 2019. https://doi.org/10.1016/j.ijhydene.2019.08.065.
[28] M. R. Mamdikar, V. Kumar and P. Singh. “Dynamic reliability analysis framework using fault tree and dynamic Bayesian network: A case study of NPP” [J]. Nuclear Engineering and Technology, vol. 54, no. 4, pp. 1213–1220, 2022. https://doi.org/10.1016/j.net.2021.09.038.
[29] M. Scutari. “An Empirical-Bayes Score for Discrete Bayesian Networks” [C]. Proceedings of the Eighth International Conference on Probabilistic Graphical Models, vol. 52, pp. 438–448, 2016. https://doi.org/10.48550/arXiv.1605.03884.
[30] S. Behiati and H. Beigy. “Improved K2 algorithm for Bayesian network structure learning” [J]. Engineering Applications of Artificial Intelligence, vol. 91, pp. 103617, 2020. https://doi.org/10.1016/j.engappai.2020.103617.
[31] G. H. John and P. Langley. “Estimating Continuous Distributions in Bayesian Classifiers” [C]. Proceedings of the Eleventh Conference on Uncertainty in Artificial Intelligence (UAI’95), Morgan Kaufmann Publishers Inc., San Francisco, CA, USA, pp. 338–345, 1995. https://doi.org/10.48550/arXiv.1302.4964.
[32] M. Bessani, J. A. D. Massignan, T. M. O. Santos, et al. “Multiple households very short-term load forecasting using bayesian networks” [J]. Electric Power Systems Research, vol. 189, pp. 106733, 2020. https://doi.org/10.1016/j.epsr.2020.106733.
Biography

Lianhai Yu, born in April 1970 in Dalian, Liaoning Province, is a male Senior Economist currently serving at Liaoning Power Transmission and Transformation Engineering Co., Ltd. His work primarily focuses on power production and construction, as well as corporate operation and management analysis.
Strategic Planning for Energy and the Environment, Vol. 45_1, 1–24
doi: 10.13052/spee1048-5236.4511
© 2026 River Publishers