MPC-Based Coordinated Control Strategy for Wind–Photovoltaic–Hydrogen–Storage Coupled Systems
Zhenming Zhang*, Ge Yin, Xueli Sun, Yuanzhi Gao and Feng Huang
State Key Laboratory of Low-carbon Smart Coal-fired Power Generation and Ultra-clean Emission, China Energy Science and Technology Research Institute Co., Ltd., Nanjing 210023, China
E-mail: zhenmingzzm@hotmail.com; 18012941830@163.com; sun-xue-li@163.com; gyz0213@outlook.com; 20107597@ceic.com
*Corresponding Author
Received 14 September 2025; Accepted 10 November 2025
Abstract
The heterogeneous characteristics of proton exchange membrane fuel cells (PEMFCs), alkaline electrolyzers (AEs), and batteries introduce significant challenges to the coordinated control of wind–photovoltaic (PV)–hydrogen–storage coupled systems. Furthermore, conventional state-based energy management strategies are incapable of dynamically and in real time optimizing the reference power of individual devices, thereby limiting both operational stability and utilization efficiency. To overcome these limitations, this study develops a model predictive control (MPC)-based coordinated control strategy for wind–PV–hydrogen–storage coupled systems, aiming to enhance the effective consumption of renewable energy. Within the proposed framework, reference power is dynamically and optimally allocated under system constraints, while power limits, weighting factors, and state–space equations can be flexibly formulated through a user-defined power management module implemented in MATLAB/Simulink. Simulation studies confirm the feasibility of the proposed strategy: the coordinated control not only accommodates the operating characteristics of AEs and PEMFCs, but also reduces redundant power conversion stages and switching devices. Moreover, the decoupling mechanism enables accurate determination of both the direction and magnitude of power flow, achieving superior tracking performance through the regulation of two free variables.
Keywords: Renewable energy, model predictive control, three-port converter, hydrogen system.
1 Introduction
Recently, the more importance of the renewable energy resources (RES) increased in the development of human society [1], the more urgency of finding approaches to overcome the drawbacks such as intermittent nature and high capital cost of RES has increased [2, 3]. As a clean energy carrier, hydrogen can be produced by water electrolysis of abundant renewable energy in nature, such as solar energy and wind energy, without emitting carbon dioxide. Hydrogen is easy to store and transport [4], and can be used in different industries in various ways, which makes hydrogen energy have advantages and convenience in large-scale utilization [5, 6]. The integrated energy system (IES) coupling renewable energy and hydrogen energy to overcome the intermittency of renewable energy is considered to be one of the best solutions for hydrogen economy. Therefore, how to operate the hybrid energy system with hydrogen energy storage system safely, efficiently and economically has attracted more and more research interests in recent years.
The common form of comprehensive utilization of renewable energy and hydrogen energy is the large-scale use of wind/solar/hydrogen coupling system. In most case, renewable power sources, i.e. wind power generation, photovoltaic (PV) power generation, hydrogen energy systems i.e. proton exchange membrane fuel cell (PEMFC), alkaline electrolyzer (AE), and hydrogen storage tank and energy storage systems i.e. battery are coupled to the hybrid system through bus bars [7]. However, in terms of safely coupling renewable energy and hydrogen energy, it is well known that with the large-scale development of renewable energy, the anti-interference ability of the power system is greatly weakened, and the ability of faults to form a chain reaction from local to global effects is strengthened [8]. Obviously that the electric coupling wind/solar/hydrogen integrated system coupled through bus bars does not establish electrical isolation between equipment with different voltage levels. In addition, the circulating current problem [9], the difficulty of coordinated control design and the interaction caused by the parallel operation of multiple dual port DC converters cannot be ignored [10, 11]. In addition, an excessive voltage difference between the two ports of the DC converter in the IES may lead to an increase in the control difficulty of the converter. The use of a large number of DC converters also increases the number of energy conversion and reduces the energy utilization rate.
When the hybrid energy system is coupled magnetically rather than electrically, the design of DC-AC-DC converter with multi ports constitutes another challenge for the coupling system. The main converter of magnetic coupling hybrid energy system is DC-AC-DC converter with multiple ports [12]. Three-port converter (TPC) based on half bridge is proposed in reference [13] and reference [14], in which half bridge can also be some other derived topologies. Besides, TPC can also be made of full bridge [15]. TPC with full bridge structure can realize power decoupled by reducing the size of leakage inductance on the main circuit to realize free control of power flow and zero voltage switching [16]. However, the traditional TPC with full bridge structure will have back-flow power at the port connected to AE, and the control design is troublesome [17]. Furthermore, the TPC with full bridge structure uses many switchgears, resulting in slightly higher costs.
After determining the coupling form of the system, the power management strategy that determines how to coordinate the power distribution between subsystems can also directly affect the overall performance of such hybrid energy systems [18]. The power management strategies involving the power distribution between different energy sectors or the optimization of different evaluation indicators have been investigated by many papers. For the hybrid energy systems the power management methods can be roughly divided into two categories:rule-based and optimization-based approaches [19]. [20] proposed a rule-based strategy to control a battery-based hybrid energy storage system to ensure electrical production continuity. [21] proposed a rule-based home power management system with the advantage of significant reductions in the total daily energy consumption. In general, rule-based strategy has the advantages of high reliability, easy implementation and strong robustness [22], but it relies on the engineering experience of engineers, which may lead to the low efficiency of the hybrid system and the reduction of its response ability to sudden disturbances of renewable resources. In addition, systems operating under these rules are usually far away from the optimal state of the system’s set goals, thus encouraging researchers to seek alternative power management strategies [23].
To solve this issue, optimization-based approaches can provide more flexible solutions. As a globally optimal algorithm, dynamic programming is often used to develop theoretically optimal power management strategies [24]. The operating expense of a solid oxide cell-based renewable microgrids was minimized by dynamic programming in [25]. However, the computational efficiency of dynamic programming is very low, which does not meet the requirements for real-time control, especially for dynamic models with multi-objective problem [26].
The characteristics of rolling optimization, feedback correction and prediction model of model predictive control (MPC) make it an outstanding optimization control algorithm, when dealing with unpredictable wind power and solar power. It can optimize the equipment’s reference power according to the predetermined single or multiple expected performance indicators in real time [27]. For examples, [28] is an application to the optimal economic control of a community micro-grid which includes three generation and six storage subsystems. [29] made the unit can automatically and dynamically adapt to the changes of photovoltaic output, and respond to the requirements and price signals of external system operators through the model prediction method, providing higher profits and smoother power output. Moreover, the data in the [30] showed that compared with state control, MPC can make the battery state of charge (SOC) decrease more slowly in a long period of time due to the increase of battery participation. On the other hand, fuel cells are more efficient at low power [31], that is to say, with the increase of battery participation, the utilization rate of equipment will be higher. MPC can also adjust the weight to cope with the situation that the fuel cell consumes four times as much hydrogen as the electrolytic cell under the same efficiency and power operation [31], so that the hydrogen storage capacity is basically unchanged in a long-time scale. Therefore, without considering the unit power cost of equipment, MPC can not only have good tracking performance when the sudden renewable energy interference occurs, but also effectively extend the service life of equipment and system efficiency.
As summarized in Table 1, previous studies have mainly addressed either electrical-bus coupling with poor isolation or multi-stage magnetic topologies with complex control, while power management relied on rule-based or offline optimization. This work integrates a decoupled three-port converter with an MPC-based dispatch framework, achieving safe magnetic coupling and real-time optimal coordination of renewable–hydrogen hybrid systems.
Table 1 Comparison with representative studies
| Ref. | Research Focus | Main Limitation | Improvement in This Work |
| [7] | Wind/solar/fuel-cell/battery hybrid system coupled through DC bus | Lacks electrical isolation; prone to circulating current and fault propagation | Replaces electrical coupling with magnetically decoupled TPC to ensure isolation and suppress interference |
| [12] | Multi-port DC–AC–DC magnetic coupling for PV-based hydrogen production | Multi-stage structure, high device count, and complex coordination | Uses single-core three-port converter to simplify structure and reduce conversion stages |
| [13] & [14] | Half-bridge three-port converter topology | Limited controllability, coupling among ports | Introduces dual phase-shift control (D1, D2) for independent port regulation |
| [15] & [16] | Full-bridge TPC with power decoupling and ZVS | Back-flow power at AE port, complex control, higher cost | Redesigned decoupled structure suppresses back-flow and simplifies modulation |
| [20] & [21] | Rule-based power-management strategies | Depend on experience; far from system-optimal operation | Adopts MPC-based optimization to achieve real-time, objective-driven coordination |
| [25] | Dynamic-programming optimization for microgrids | Heavy computation; unsuitable for real-time dispatch | Employs rolling model-predictive control with low computational load and real-time feasibility |
To sum up, this paper uses TPC composed of high-frequency transformer and insulated gate bipolar transistor to replace the DC bus in the electrical coupling integrated system. This integrated three-port DC/DC converter topology based on phase-shift full bridge (PSFB) and dual active bridge converter (DAB) converter has the following characteristics:
• It can meet the operation characteristics of AE and PEMFC;
• It can control the power flow only through two free variables with less switching devices after decoupling;
• It can provide current isolation through a transformer in some cases;
• It can reduce the difficulty of choosing the rated voltage of low-voltage side devices in the system through wide and alternative voltage ratio by transformer;
• It can provide a more direct energy conversion mode instead of using an additional boost circuit between the low-voltage side and the high-voltage side;
• It can be input-paralleled output-paralleled.
Then, considering the three characteristics of MPC that can smoothly run AE and PEMFC, rapidly change the reference power according to different net power conditions and improve the system efficiency through different weight factors, this paper takes MPC as the control strategy for the power distribution of the equipment in the whole system. In this paper, the net power (including wind power, solar power and load power) is taken as the expected curve, and after modeling each part of the integrated system, considering the rate and power constraints of PEMFC, AE and battery, the state space model of wind-photovoltaic-hydrogen coupling system is established. In addition, the MPC strategy adopted in this paper is made into a user-defined module in Matlab/simulink that can write in the power constraint of the equipment and the system state space equation as the reference power distribution module flexibly.
2 System Components, Characteristics and Models
The Port 1 was defined as the Port DC. The Port DC is connected to the power grid, wind turbine, PV array and load. The DAB converter was chosen for the Port 2 while the PSFB convert was chosen for the Port 3. Port 2 and Port 3 are also defined as Port FC/Bat and Port AE for simplicity and accuracy in this article. Port FC/Bat is connected to the PEMFC and battery. Port AE is connected to the AE.
The three-port integrated system is shown as the Figure 1.
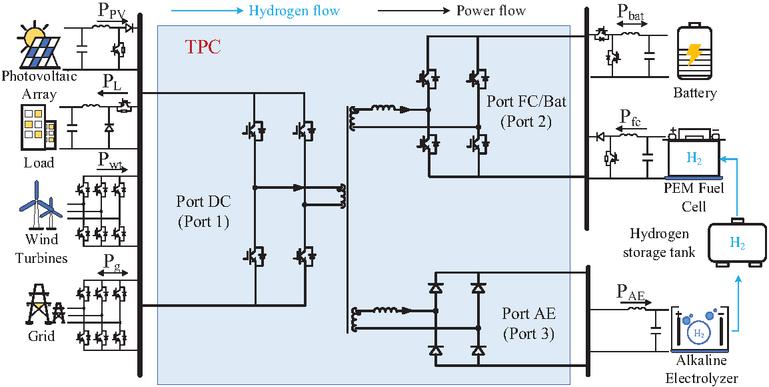
Figure 1 The structure of three-port integrated system.
2.1 PV Array
At any temperature, PV array U-I equation is expressed in Equation (1).
| (1) |
where is the current of the equivalent circuit of PV array, is the short-circuit current, is the parallel number of photovoltaic modules in the photovoltaic array, is the series number of photovoltaic modules in the photovoltaic array, is the capacitance of Port DC, is the capacitance of Port FC/Bat, is the voltage of PV array, is the open-circuit voltage.
The respective expressions of , , dI, and dU in Equation (1) could be expressed in Equation (2).
| (2) |
where is the maximum power point current, is the maximum power point voltage, is the current temperature variation coefficients under the reference irradiation, is the voltage temperature variation coefficients under the reference irradiation, G is irradiation, is reference irradiation, is the temperature of PV array, is the reference temperature, is PV series resistance.
2.2 Wind Turbine
The selected wind turbine uses a turbine of two blades with fixed pitch angle and coupled to a three-phase synchronous generator with permanent magnets. The model of the wind turbine is based on its steady-state power characteristics. The turbine output power is expressed in Equation (3).
| (3) |
where is power captured by the wind turbine blades, is impeller radius, is air density, is tip speed ratio of the rotor blade tip speed to wind speed, is wind speed, is power coefficient of the wind turbine.
The electrical power system of this model is composed by a three-phase synchronous generator with permanent magnets, an inverter and a DC/DC converter, considered to consist of a three-phase symmetrical power supply and a DC/DC converter due to simplification.
2.3 Alkaline Electrolyzer
The AE model established in this paper adopts the following assumptions: (a) all gases are ideal gases; (b)The temperature of the whole electrolyzer is uniform; (c) The influence of water vapor is not considered.
The relationship between the output voltage and the load current of an alkaline AE could be expressed in Equation (2.3).
| (4) |
where is the voltage of an AE cell, is the AE cell area, is the Gibbs free energy change, z is the number of electrons transferred in each reaction, F is Faraday constant, is the parameters for ohmic resistance of electrolyte , is the temperature of AE, is the DC current drawn by the AE, is parameters for overvoltage on electrodes , is parameters for overvoltage on electrodes .
The voltage of AE stack is expressed in Equation (5).
| (5) |
where is the voltage of AE, is the number of AE cells in series.
The rate of hydrogen generated in the water-splitting reaction is defined in Equation (6):
| (6) |
where is the faraday efficiency, is the hydrogen production rate.
Where is defined in Equation (7).
| (7) |
where is the parameters for faraday efficiency .
2.4 Proton Exchange Membrane Fuel Cell
The voltage of a PEMFC single cell could be expressed in Equation (8).
| (8) |
where is the activation over-potential, is the voltage of a PEMFC elementary cell, is the concentration over-potential, is the ohmic over-potential, is the voltage of PEMFC stack, is the number of PEMFC cells in series, the equilibrium voltage.
The variables of Equation (8) could be expressed in Equation (9).
| (9) |
where is standard mole entropy change, is the temperature of PEMFC, R is gaseous constant, is the concentration equivalent resistance, is the equivalent membrane impedance, is the contact resistances both between the membrane and electrodes as well as the electrodes and the bipolar plates, the resistivity of Nafion series proton exchange membrane, is the effective partial pressure of hydrogen, is the effective partial pressure of oxygen, is the model coefficients obtained by experimental data fitting based on electrochemistry, thermodynamics, and fluid mechanics , is the dissolved oxygen concentration in the interface of the cathode catalyst, is the current of the equivalent circuit of PEMFC, l is the thickness of the membrane, is the activation area of the membrane, is the constant determined by the PEMFC and its working status, J is the current density, is the maximum current density.
Where is expressed in Equation (10).
| (10) |
And the is expressed in Equation (11).
| (11) |
where is empirical coefficient.
2.5 Hydrogen Storage Tank
The hydrogen storage rate is defined in Equation (12).
| (12) |
where is net hydrogen storage rate, is hydrogen generated rate, is hydrogen assumed rate.
Hydrogen storage is expressed in Equation (13).
| (13) |
where is hydrogen storage, is the volume of hydrogen storage tank.
Pressure of hydrogen storage tank is expressed in Equation (14).
| (14) |
where is pressure of hydrogen storage tank, is the temperature of hydrogen storage tank.
2.6 Battery
The internal electromotive force of the battery could be expressed in Equation (2.6).
| (15) |
where E is the internal electromotive force of the battery, is the initial internal electromotive force, is the number of batteries in series, K is the polarization voltage constant, SOC is state of charge, is the rated capacity of the battery, is the voltage variation coefficient, is the capacity variation coefficient.
where the SOC, can be expressed in Equation (16).
| (16) |
where is the number of batteries in parallel, is the polarization effect coefficient, is the temperature of battery.
3 Three-port Convert
The proposed TPC topology in this paper is shown as Figure 2.
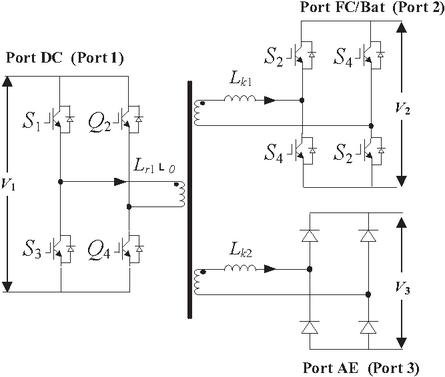
Figure 2 The proposed TPC topology.
Choosing DAB converter for Port FC/Bat takes advantages of DAB’s characteristic such as high efficiency and wide gain range. Figure 3(a) illustrates the topology of the proposed bidirectional converter consisting of two full bridges, a transformer, and a series inductor.
The PSFB converter was chosen for the Port AE. Input and output ports of the converter, as shown in Figure 3(b), are magnetically coupled through the isolation transformer. It enables high switching frequency operation in order to improve power density and conversion efficiency. Besides, the PSFB reduces cost due to utilizing the diode rectifiers instead of active switches in the secondary side of converter and meets the needs for wide voltage ranges from Port AE to Port DC and the AE’s characteristic such as low voltage and high current. These advantages make this kind of converter well suited for AE.
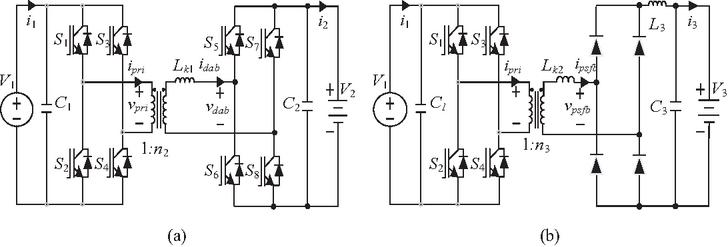
Figure 3 Converter for the TPC. (a) DAB converter for Port FC/Bat; (b) PSFB converter for Port AE.
An equivalent model (Figure 4) is used for analyzing the power flow between three ports, where is the primary leakage inductance, and all parameters for Port 2 and Port 3 are referred to the primary side. Port 2 is considered as power supply and Port 3 is considered as load. From the Y-circuit shown in Figure 4(a), the equivalent-circuit is derived as shown in Figure 4(b), where the formula is expressed in Equation (17).
| (17) |
where is leakage inductance, is DAB series inductance, is PSFB series inductance, DAB is dual active bridge, PSFB is phase-shifted full-bridge.
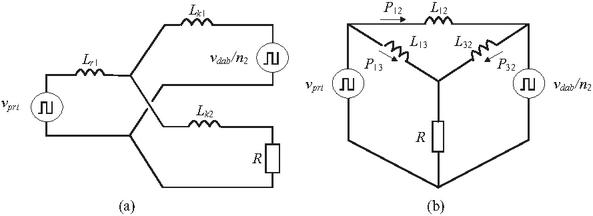
Figure 4 Equivalent circuit of the proposed TPC. (a) Y-type primary-referred circuit. (b) -type primary-referred circuit.
The proposed TPC configuration is a special case of the conventional configuration with the leakage inductance of the master port reduced removed. Rewriting the link inductance expression of Equation (17) with selecting Port DC as the master port, i.e., .
In another word, the TPC converter can decouple via reducing the .
In the TPC topology and are defined as a pair of bridge arms. and are a pair of bridge arms too. and S4 are also a pair of bridge arms. is ratio of the delay-time that lags behind lags to switching cycle of TPC. is the ratio of the delay-time that lags behind lags to switching cycle of TPC. When Port AE is in open circult the converter is controlled by the single-phase shift modulation due to its simplicity and effectiveness. When the two ports are running simultaneously, the proposed converter is controlled by hybrid phase shift control. It is equivalent to extended phase shift for DAB converter.
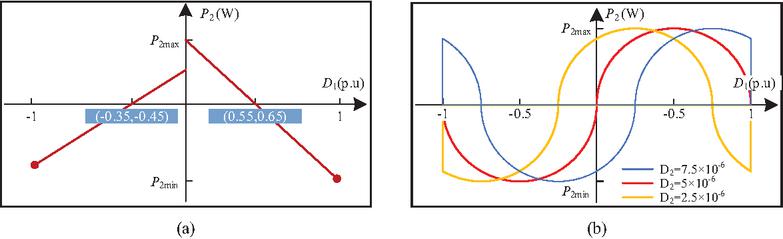
Figure 5 Relationship between D1 and P2 maximum power. (a) ; (b) .
The Port FC/Bat and the Port AE of the proposed converter can operate independently or simultaneously to deal with the power mismatch between renewable energy and AE load by combination of PEMFC and battery. Therefore, the TPC in this paper uses and as independent control variables to control the direction of Port FC/BAT’s power flow and size of both Port FC/Bat and Port AE’s power.
In fact, according to the topology of TPC, the value of has an impact on . Relationship between and under different values of is shown in Figure 5 ( kHz). is considered not be greater than 10-5 at this frequency in combination with the actual situation.
Relationship between and maximum power when is expressed in Equation (18).
| (18) |
where is atio of the delay-time that S2 lags behind lags to switching cycle of TPC, is ratio of the delay-time that lags behind lags to switching cycle of TPC, is switching frequency at grid side.
Different transformer leakage inductance and real-time voltage of Port FC/Bat will affect the value of when . Since this paper does not focus on the detailed value range of at this time, the value of obtained after a large number of experiments is shown in Figure 5(a).
In rectangular coordinates, the conditions for ZVS are described, as shown in Figure 6. We can see that with the decrease of , the ZVS range of the DAB converter moves upward, indicating that the ZVS range of the switches in the input bridge is narrowing, while the ZVS range of the switches in the output bridge is expanding.
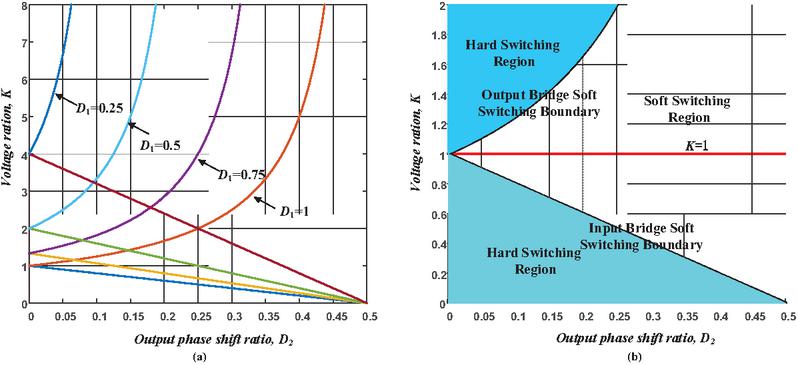
Figure 6 Conditions for the converter operates under soft switching. (a) Relation curve between voltage ratio K and . (b) ZVS range diagram when .
4 Coordinated Control Strategy
4.1 Converter Control Strategy
Converter control strategy of isolated three-port integrated system with wind-photovoltaic-hydrogen is shown in Figure 7.
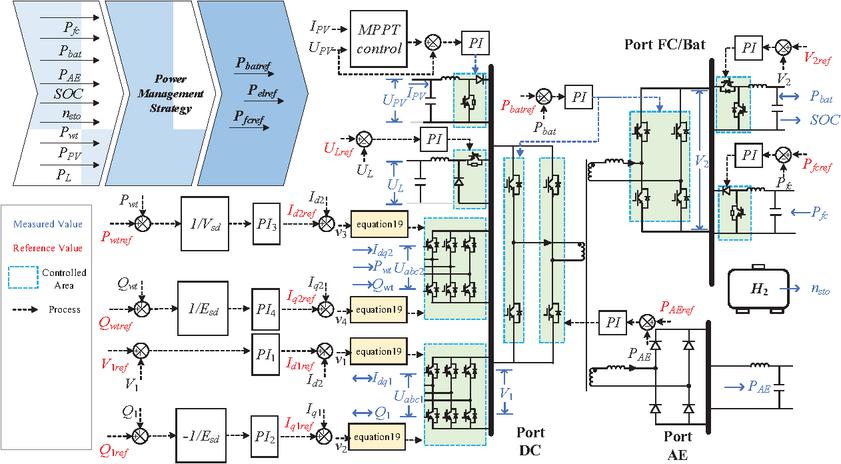
Figure 7 Converter control strategy.
The Equation (19) is expressed as the following:
| (19) |
where is d-axis component of power grid’s voltage source converter’s switching function, is d-axis component of wind turbine’s voltage source converter’s switching function, is q-axis component of power grid’s voltage source converter’s switching function, q-axis component of wind turbine’s voltage source converter’s switching function, is line resistance at grid side, is line resistance at wind turbine side, is line inductor at grid side, is line inductor at wind turbine side, is DC-Bus voltage of Port DC, is d-axis component of wind turbine voltage vector, is the angular frequency of power grid and wind turbine voltage, is the angular frequency of wind turbine voltage, is d-axis component of power system voltage vector.
4.2 MPC-based Power Management Strategy
The MPC adopted in this paper can be described as follows: in each sampling period, according to the obtained , , SOC and a finite horizon open-loop optimization problem is solved online, and the obtained value is used as the reference power of controllable equipment such as battery, PEMFC and AE. In the next sampling period, repeat the above process and resolve the optimization problem with new measured values, as shown in Figure 8.
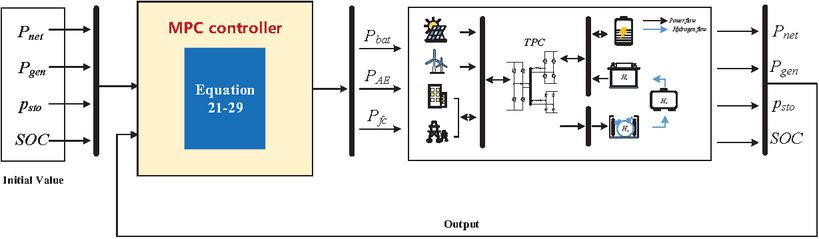
Figure 8 Overall scheme of the energy dispatching based on MPC.
and are defined in Equation (20):
| (20) |
where is the active power generated by the wind turbine, is the power generated by the PV panels, is the power demanded by the load, is the power consumed by the AE, is the power generated by the PEMFC, is the power generated by battery.
The state space model of linear discrete system can be expressed in Equation (21).
| (21) |
where x is the state variable, is constrained output, is the controlled output, A is system matrix, B is control matrix, is the controlled output matrix, is the constrained output matrix. u is the control variable,
The state variable, control variable and output variable of the isolated three-port integrated system with wind-photovoltaic-hydrogen are expressed in Equation (22):
| (22) |
System matrix, control matrix, controlled output matrix and constrained output matrix are expressed in Equation (23).
| (23) |
where , and are expressed in Equation (24).
| (24) |
where Ts is sampling interval.
The MPC is designed to minimize the following finite horizon control and performance index as Equation (4.2) expressed:
| (25) |
where and are the weight matrix of output variable and control variable respectively, expressed in Equation (26).
| (26) |
The is reference path, is set as the reference path; and are the prediction and control horizons, respectively. and are weight factor.
The operation constraints of hybrid renewable energy systems are expressed as (27):
| (27) |
where is control increment.
When , there is residual power in hybrid renewable energy systems. Considering the energy storage capacity of hydrogen storage tank and battery, the PEMFC stops working, the battery and AE absorb the residual power, the hydrogen produced by AE is stored in hydrogen storage tank, and the stored hydrogen cannot exceed the upper limit of hydrogen pressure, In addition, when the battery absorbs power, the SOC shall not exceed the upper limit of SOC.
The operation constraints of hybrid renewable energy systems when are expressed in Equation (28):
| (28) |
where is lower limit of AE power, is upper limit of AE power, is lower limit of PEMFC power, upper limit of PEMFC power, is lower limit of BAT power, is upper limit of BAT power.
When , there is a shortage in the power of hybrid renewable energy systems, resulting in the shutdown of the AE, while the PEMFC and battery make up for the insufficient power in the system. The hydrogen consumed by the PEMFC shall not cause the hydrogen pressure in the hydrogen storage tank to be lower than the lower limit, and the SOC of the battery shall not be lower than the lower limit of SOC.
The operation constraints of hybrid renewable energy systems when are expressed in Equation (29).
| (29) |
5 Simulation
5.1 Parameter Setting
In order to validate the feasibility of the proposed strategy, a three-port DC/DC converter is built in the Matlab/simulink simulation environment. The electrical parameters of the converter are shown in Table 2.
As it defined above, is compoesd by , and . And the curve of the is shown in the Figure 9.
Table 2 The parameters and the variables
| Parameters of different units | Symbol | Value | Unit |
| The parameters of Port AE | 237000 | kJ/mol | |
| z | 2 | ||
| F | 96485 | C/mol | |
| m2 | |||
| 18.1 | m2K-1 | ||
| 0.159 | 0.159 V | ||
| 1.38*10-3 | VK-1 | ||
| 1.61*10-5 | VK-2 | ||
| 1.6*10-2 | m2A-1 | ||
| 1.302 | mAK | ||
| 4.21*102 | mA-1K2 | ||
| 0.18 | m2 | ||
| 12 | |||
| 0.995 | |||
| 9.5788 | Am-2; | ||
| 0.0555 | AmK-1 | ||
| 1502.71 | A2m-4 | ||
| 70.8 | Am-4K-1 | ||
| The parameters of Port FC/Bat | 46 | ||
| 164.028 | kJ/mol | ||
| 0.9514 | V | ||
| 0.00312 | VK-1 | ||
| 7.410*10-5 | VKPa-1 | ||
| 1.8710*10-4 | VK-1A-1 | ||
| 14 | |||
| 0.0003 | |||
| l | 51 | 51m | |
| 0.5 | Am-2 | ||
| 400 | cm2 | ||
| 0.016 | |||
| 4 | kHz | ||
| 2 | mH | ||
| 25 | |||
| 1 | |||
| 0.051 | V | ||
| 2000 | Ah | ||
| 0.005 | V | ||
| 0.6 | Ah-1 | ||
| 0.011 | K-1 | ||
| 2.078 | V | ||
| 10 | kHz | ||
| 2.5 | mH | ||
| The parameters of hydrogen storage tank | 3 | m3 | |
| 298 | K | ||
| Ts | 0.02 | s | |
| The parameters of MPC | 5 | ||
| 4 | |||
| 0 | kW | ||
| 7 | kW | ||
| 5 | kW | ||
| 0 | kW | ||
| 12 | kW | ||
| 12 | kW | ||
| 0.2 | 0.2 | ||
| 0.9 | 0.9 | ||
| 0.1 | MPa | ||
| 1 | MPa |
Due to the intermittence of the wind power system, the power generated within 0–1 s and 2.1–2.3 s is small, and the maximum power generated at 1.7 s is about 15 kW. The PV array mainly emits power within 0.5–2.8 s. The PV power gradually increases within 1–1.2 s, and then decreases to 1000 W at 2.8 s. At 1.5 s, the maximum power provided by PV is about 7 kW. Within 1.2–2.1 s and 2.3–2.8 s are the two peak periods of power consumption. After 2.8 s, the total load power gradually decreases.
5.2 Weight Factor Value Analysis
The effects of weight factor on the power tracking effect of MPC is shown in the Figure 10.
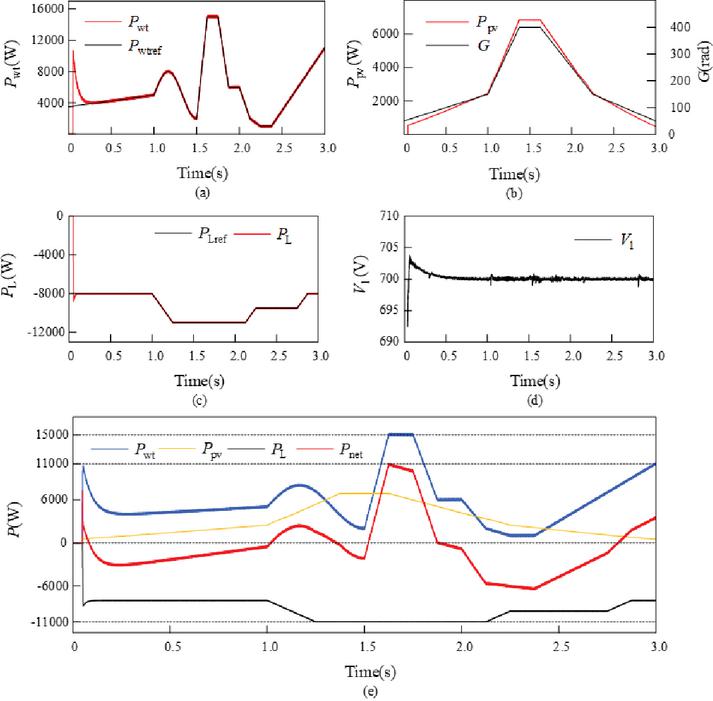
Figure 9 The curve of the and . (a) t race curve of the ; (b) trace curve of the ; (c) trace curve of the ; (d) curve of the ; (e) curve of the .
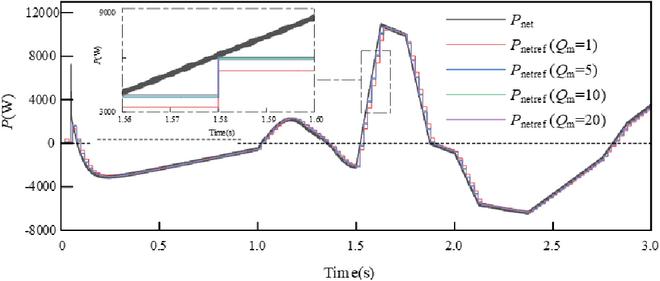
Figure 10 The effects of Qm with different values.
When the weight factor is 1, the tracking effect is not good; When the weight factor is 5, the tracking situation at the peak and trough of the reference value is improved, and the overall tracking effect is general; When the weight factor is 10, the tracking effect is ideal. When the weight factor is 20, the curve tracking effect has not been significantly improved. Therefore, the larger the is, the closer the expected output is to the given reference, while the curve tracking effect has not been significantly improved.
The influence of weight factor on the power tracking effect of MPC is shown in the Figure 11.
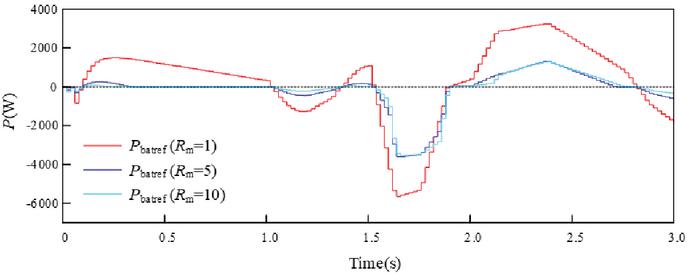
Figure 11 Effects of different values of Rm on battery.
Taking the change of the weight factor of the battery as an example, when , the absorbed and released power of the battery is larger, and when , the charging and discharging power of the battery decreases; That is, with the increase of the weight of the battery, the charging and discharging power of the battery in the system decreases. Therefore the larger the weighting factor is, the smaller the corresponding control value change is expected.
5.3 Analysis
To verify the feasibility of three-port integrated system, it is assumed that the waveform of is shown in Figure 8. The values of weight factors are as follows:
| (30) |
As it shown in Figure 12, the TPC completed the power transmission in a timely and rapid manner. The disturbance of value mainly comes from the fluctuation of real-time voltage , as shown in Figure 15. When , the power flew from Port FC/Bat to Port DC. When , power flew from Port DC to Port AE and Port FC/Bat. And the closer is to 0, the greater is with approached 0. It can be seen that the relationship between and is basically consistent with Figure 5.
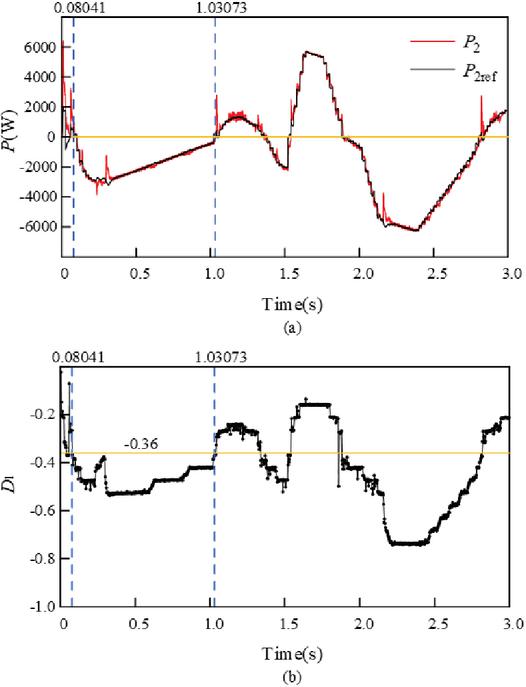
Figure 12 Curve of and . (a) trace curve of ; (b) curve of and .
Reference value calculated by MPC is shown in Figure 13. The sampling interval is 20 ms, and it can be seen that thr trace perfomance is good.
It can be seen that when , the reference value of the battery calculated by MPC is basically equal to the reference value of the AE or PEMFC calculated by MPC for . And when , the reference value of the battery calculated by MPC is basically equal to the reference value of the PEMFC or AE calculated by MPC for the same reason.
In other words, when , will be divided equally by battery and PEMFC (or AE), which means PEMFC (or AE) can operate smoothly and avoid working at the limit reference work too often when is massive. Changing also means the improvement of battery participation and the high efficiency of PEMFC and AE when it works at low voltage. Besides, through different values, the distribution of can be changed in real-time and dynamically, so as to deal with uncertain renewable resource allocation schemes under different capacity configurations.
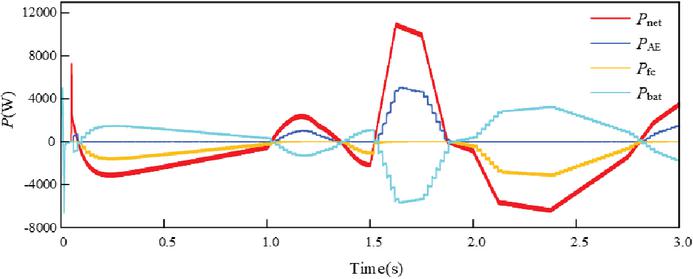
Figure 13 Curve of reference value calculated by MPC.
The power tracking curve of AE and ’s curve of AE is show as Figure 14.
When Port AE is almost closed (), AE has a minimum voltage of 14.17 V. When Port AE operates normally (), the change trend of is basically consistent with that of . Due to the operating characteristics of AE, when AE operates normally with the power changeing greatly, the change trend of is not obvious as the Figure 14 shown Besides it can be seen that the actual power of AE meets its slow dynamic regulation characteristics.
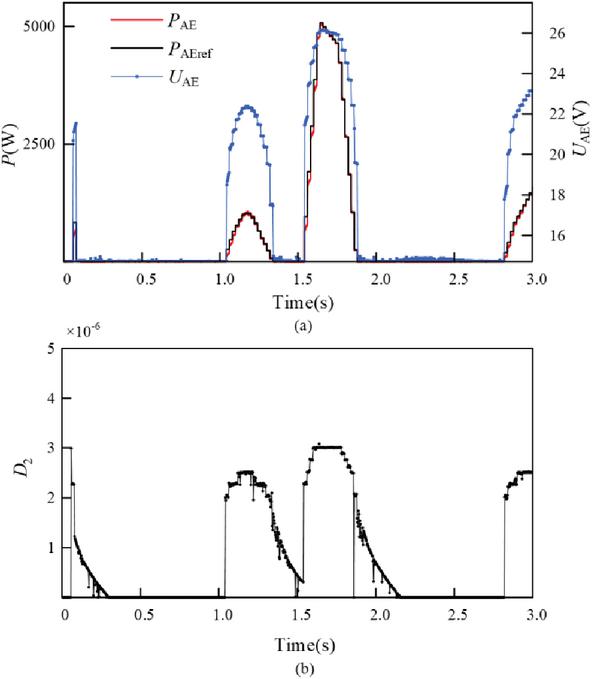
Figure 14 The power tracking curve and ’s curve of AE. (a) power tracking curve; (b) curve of .
The power tracking curve and volt ampere characteristic curve of PEMFC is show as Figure 15.
When the voltage is greater than a certain value, the current of the PEMFC basically does not change with the voltage change. When the voltage is less than a certain value, the current of the PEMFC increases with the voltage drop.
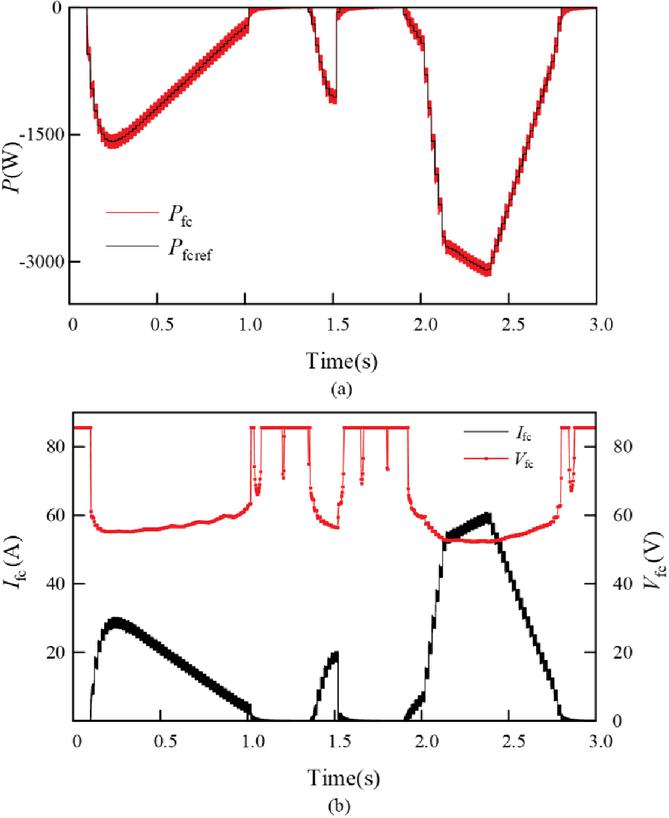
Figure 15 Power tracking curve and volt ampere characteristic curve of PEMFC. (a) power tracking curve; (b) characteristic curve of PEMFC.
The power tracking curve of battery and ’s curve is show as Figure 16.
It can be seen from the figure that except for the situation that the voltage will rise briefly every time PEMFC is started, is basically constant equal to 100 V, which is very important for the normal operation of fuel cell and TPC.
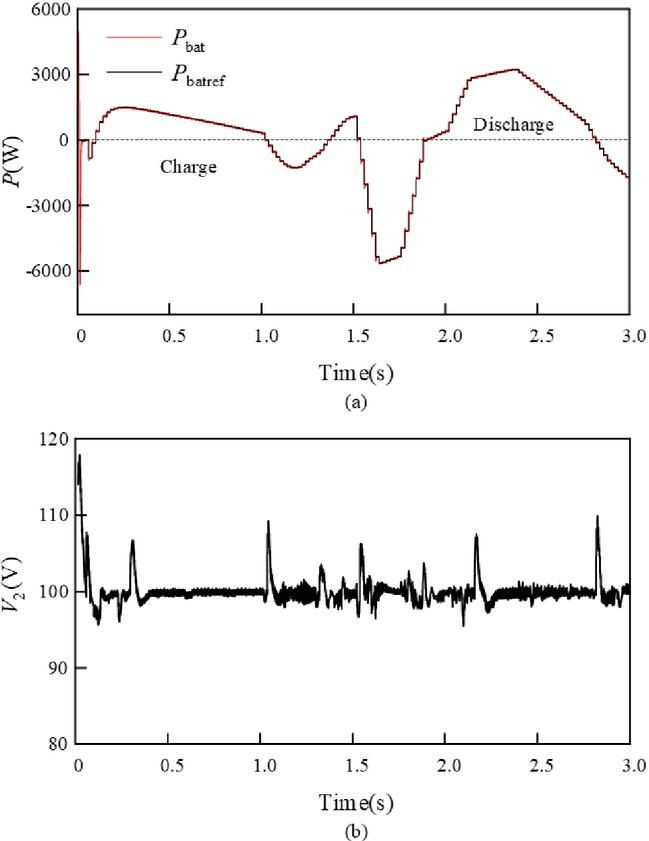
Figure 16 The power tracking curve of battery and ’s curve. (a) tracking curve; (b) curve of the .
The curves of different pressure of hydrogen storage tank and SOC are shown in Figure 17. It can been seen that when the work consumed by AE is almost twice the work produced by PEMFC, if the rated voltage of PEMFC is twice the rated voltage of AE, the total amount of hydrogen in the hydrogen storage tank is basically unchanged, as shown in Figure 17(a) (t 1–1.5 s).
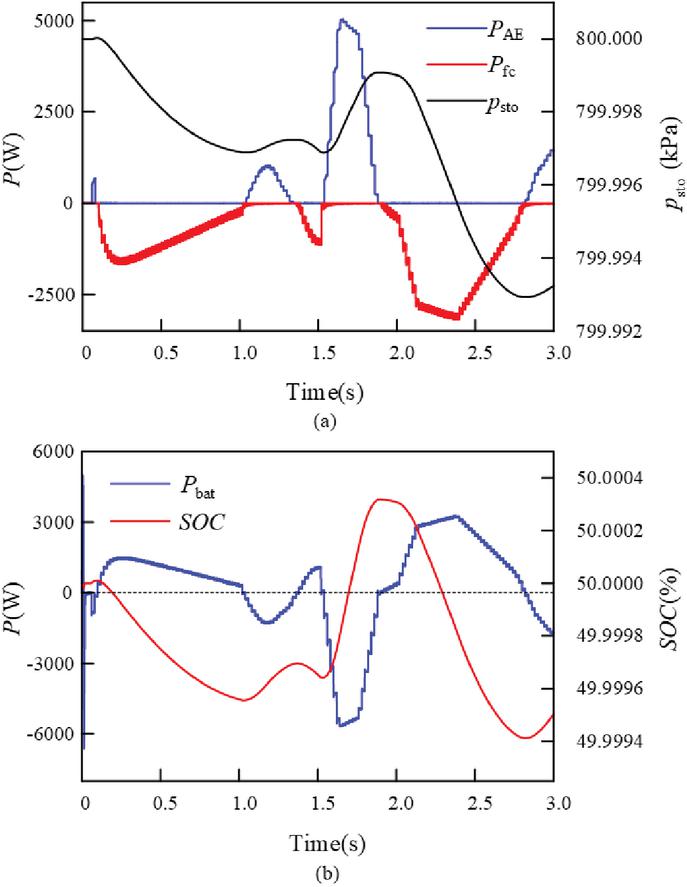
Figure 17 Curve of and SOC. (a) ; (b) SOC.
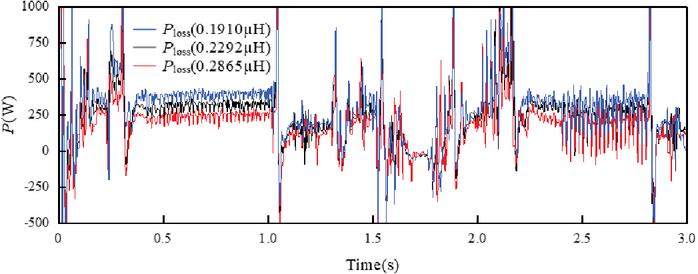
Figure 18 Loss power of system.
The difference between the outflow power of the Port DC and the inflow power of Port AE is defined as the incoming inflow power of the Port FC/Bat. And the difference between the incoming inflow power of the Port FC/Bat and the sum actual power of the equipment connected to the Port FC/Bat (including the sum of the switching loss power generated by the IGBT tube at high frequency and the loss power of the transformer winding) is defined as the loss power of the TPC. And the losses of the system are mainly concentrated in the loss power of the TPC. The loss power of the system is shown in the Figure 18. Firstly, it can be seen that the loss power of system is not significant and the change is not obvious. When the transient process is not considered, even if (t 2.2 s), the loss is almost the same as that when . Secondly, it can be seen that the loss power is related to the change of . Thirdly, it can be seen that as the inductance value of Port FC/Bat gradually decreases, the loss power also gradually decreases, but the reduction of loss power also means that the total power transmitted through Port FC/Bat decreases, so the inductance value should not be too low.
6 Conclusions
The present study proposed a MPC-based coordinated control of integrated system with wind-photovoltaic-hydrogen-storage to achieve clean and low-carbon energy consumption. A TPC based on DAB and PSFB is adopetd to replace the bus in IES while the MPC is used as power management strategy to achieve the coordinated control of the system. Based on software platform of Matlab/simulink, modules of PV power generation, wind turbine, power grid, load, AE, PEMFC and battery are performed. A user-defined MPC moudule as power allocation module that can write in the power constraint of the equipment and the system state space equation flexibly is also devopled in Matlab/simulink. Using MPC to control power of PEMFC, AE and battery with a specific weight factor coordinately, the system coupled by TPC can absorb power fluctuation of RES, and operate stably. The main conclusions extracted from the study are:
(1) Considering that the total simulation time in this paper is 3 s, changes dramatically. And while the sampling and calculation time interval of MPC is only 20 ms, the power tracking performance of the system is still good and the voltage of ports are still stable, which shows that the proposed coordinated control is feasible in this system structure.
(2) The losses of the system are mainly concentrated on the loss power of TPC defined above. When the total capacity of the system is 15 kW, the loss is not only small (only about 300 W), which is related to the inductance value at the port and the port voltage, but also has little change under different , which indicates that the system has high efficiency.
(3) When D1 is basically unchanged, the controlled power P2 can have different values, and the voltage of each bus of the system is basically kept at a constant value, which means that the system can operate normally even if there is a small disturbance in the external system within a calculation time interval after the MPC distributes the power.
(4) The system can work simply by changing the and to control the direction of Port FC/Bat’s power flow and size of both Port FC/Bat’s power and Port AE’s power after decoupling by making .
(5) The weight factor of MPC is the key factor to distribute power. When , will be divided equally by battery and PEMFC (or AE), which means PEMFC (or AE) can operate smoothly and avoid working at the limit reference work too often when is massive. The weight factor of MPC is the key factor to track the expected curve. The large is, the performance of tracking is better. However, the weighting factor should not be too large, otherwise, Hessian matrix will appear asymmetry.
Acknowledgements
The authors would like to thank the support by China Energy Science and Technology Research Institute Co., Ltd. (No. D2025Y09).
Nomenclature
| 1:: | transformer turn ratio |
| system matrix | |
| the voltage variation coefficient | |
| the AE cell area, (m2) | |
| the activation area of the membrane, (m2) | |
| the parameters for faraday efficiency | |
| control matrix | |
| the capacity variation coefficient | |
| the constant determined by the PEMFC and its working status | |
| capacitance of Port DC, (F) | |
| capacitance of Port FC/Bat, (F) | |
| capacitance of Port AE, (F) | |
| the constrained output matrix | |
| the controlled output matrix | |
| capacitance at load side converter, (F) | |
| the dissolved oxygen concentration in the interface of the cathode catalyst, (mg/m3) | |
| power coefficient of the wind turbine, (%) | |
| capacitance at array side, (F) | |
| the polarization effect coefficient | |
| ratio of the delay-time that lags behind lags to switching cycle of TPC. | |
| ratio of the delay-time that lags behind lags to switching cycle of TPC. | |
| the internal electromotive force of the battery, (V) | |
| the initial internal electromotive force, (V) | |
| the equilibrium voltage, (V) | |
| d-axis component of power system voltage vector, (V) | |
| Faraday constant, (C/mol) | |
| switching frequency at BAT side converter, (Hz) | |
| switching frequency at PEMFC side converter, (Hz) | |
| switching frequency of TPC, (Hz) | |
| switching frequency at load side converter, (Hz) | |
| switching frequency at grid side, (Hz) | |
| switching frequency at array side, (Hz) | |
| switching frequency at wind turbine side, (Hz) | |
| the Gibbs free energy change, (kJ/mol) | |
| irradiation, (rad) | |
| reference irradiation, (rad) | |
| the DC current drawn by the AE, (A) | |
| the current of the equivalent circuit of PEMFC, (A) | |
| maximum power point current, (A) | |
| the current of the equivalent circuit of PV array, (A) | |
| short-circuit current, (A) | |
| d-axis or q-axis component of power grid’s current, (A) | |
| d-axis or q-axis component of wind turbine’s current, (A) | |
| current from Port 1 to TPC, (A) | |
| current from TPC to Port 2, (A) | |
| mean value of current from TPC to Port 2, (A) | |
| current from TPC to Port 3, (A) | |
| current at primary side of high frequency transformer, (A) | |
| current at secondary side of high frequency transformer, (A) | |
| current at tertiary side of high frequency transformer, (A) | |
| the charge and discharge current, (A) | |
| the current density, (A/m2) | |
| the maximum current density, (A/m2) | |
| the polarization voltage constant | |
| freewheeling inductor at load side converter, (H) | |
| inductor of Port AE, (H) | |
| freewheeling inductor at BAT side, (H) | |
| freewheeling inductor at PEMFC side, (H) | |
| DAB series inductance, (H) | |
| PSFB series inductance, (H) | |
| line inductor at grid side, (H) | |
| freewheeling inductor at array side, (H) | |
| leakage inductance, (H) | |
| line inductor at wind turbine side, (H) | |
| the thickness of the membrane, (m) | |
| d-axis component of power grid’s voltage source converter’s switching function, (Hz) | |
| d-axis component of wind turbine’s voltage source converter’s switching function, (Hz) | |
| q-axis component of power grid’s voltage source converter’s switching function, (Hz) | |
| q-axis component of wind turbine’s voltage source converter’s switching function, (Hz) | |
| the number of AE cells in series | |
| the number of PEMFC cells in series | |
| the number of batteries in series | |
| the number of batteries in parallel | |
| the prediction horizons | |
| the control horizons | |
| the parallel number of photovoltaic modules in the photovoltaic array | |
| the series number of photovoltaic modules in the photovoltaic array | |
| hydrogen storage, (mol) | |
| power flowing from TPC to Port 2, (W) | |
| upper limit of power flowing from TPC to Port 2, (W) | |
| the power consumed by the AE, (W) | |
| lower limit of AE power, (W) | |
| upper limit of AE power, (W) | |
| rated power consumed by the AE, (W) | |
| reference power consumed by the AE, (W) | |
| the power generated by battery, (W) | |
| lower limit of BAT power, (W) | |
| upper limit of BAT power, (W) | |
| reference power of BAT, (W) | |
| the power generated by the PEMFC, (W) | |
| lower limit of PEMFC power, (W) | |
| upper limit of PEMFC power, (W) | |
| rated power of PEMFC, (W) | |
| reference power generated by the PEMFC, (W) | |
| the effective partial pressure of hydrogen, (Pa) | |
| the power demanded by the load, (W) | |
| power captured by the wind turbine blades, (W) | |
| the effective partial pressure of oxygen, (Pa) | |
| the power generated by the PV panels, (W) | |
| rated power generated by the PV panels, (W) | |
| rated power of transformer, (W) | |
| the active power generated by the wind turbine, (W) | |
| rated active power generated by the wind turbine, (W) | |
| reference active power of wind turbine, (W) | |
| pressure of hydrogen storage tank, (Pa) | |
| lower pressure limit of hydrogen storage tank, (Pa) | |
| upper pressure limit of hydrogen storage tank, (Pa) | |
| reactive power at grid side, (Var) | |
| reference reactive power at grid side, (Var) | |
| the rated capacity of the battery, (Ah) | |
| reactive power of wind turbine, (Var) | |
| reference reactive power of wind turbine, (Var) | |
| gaseous constant, (JKmol-1) | |
| the contact resistances both between the membrane and electrodes as well as the electrodes and the bipolar plates, () | |
| line resistance at grid side, () | |
| the equivalent membrane impedance, () | |
| the concentration equivalent resistance, () | |
| PV series resistance, () | |
| line resistance at wind turbine side, () | |
| impeller radius, (m) | |
| the parameters for ohmic resistance of electrolyte | |
| the resistivity of Nafion series proton exchange membrane, (m) | |
| standard mole entropy change, (kJ/mol) | |
| state of charge | |
| lower limit of SOC | |
| upper limit of SOC | |
| parameters for overvoltage on electrodes | |
| the temperature of battery, (K) | |
| the temperature of PV array, (K) | |
| the temperature of AE, (K) | |
| the temperature of PEMFC, (K) | |
| the reference temperature(K) | |
| sampling interval, (s) | |
| the temperature of hydrogen storage tank, (T) | |
| parameters for overvoltage on electrodes (i = 1 …3) | |
| three phase voltage of power grid, (V) | |
| three phase voltage of wind turbine, (V) | |
| the voltage of AE, (V) | |
| the voltage of an AE cell, (V) | |
| voltage of load, (V) | |
| rated voltage of load, (V) | |
| reference voltage of load, (V) | |
| maximum power point voltage, (V) | |
| the voltage of PV array, (V) | |
| open-circuit voltage, (V) | |
| the control variable | |
| DC-Bus voltage of Port DC, (V) | |
| rated voltage of Port DC, (V) | |
| output voltage of Port FC/Bat, (V) | |
| rated voltage of Port FC/Bat, (V) | |
| output voltage of Port AE, (V) | |
| rated voltage of Port AE, (V) | |
| the activation over-potential, (V) | |
| the voltage of a PEMFC elementary cell, (V) | |
| the concentration over-potential, (V) | |
| the voltage of PEMFC stack, (V) | |
| the ohmic over-potential, (V) | |
| d-axis component of wind turbine voltage vector | |
| the volume of hydrogen storage tank, (m3) | |
| voltage at primary side of high frequency transformer, (V) | |
| hydrogen generated rate, (mol/s) | |
| hydrogen assumed rate, (mol/s) | |
| voltage at secondary side of high frequency transformer, (V) | |
| voltage at tertiary side of high frequency transformer, (V) | |
| net hydrogen storage rate, (mol/s) | |
| wind speed, (m/s) | |
| the state variable | |
| constrained output | |
| the controlled output | |
| Abbreviation | |
| AE | alkaline electrolyzer |
| DAB | dual active bridge |
| IES | integrated energy system |
| MPC | model predictive control |
| PEMFC | proton exchange membrane fuel cell |
| PSFB | phase-shifted full-bridge |
| PV | photovoltaic |
| RES | renewable energy sources |
| SOC | state of charge |
| TPC | three-port converter |
| Greek Letters | |
| z | the number of electrons transferred in each reaction |
| the current temperature variation coefficients under the reference irradiation | |
| the voltage temperature variation coefficients under the reference irradiation | |
| air density, (kg/m3) | |
| tip speed ratio of the rotor blade tip speed to wind speed | |
| empirical coefficient | |
| the faraday efficiency, (%) | |
| the hydrogen production rate, (mol/s) | |
| the model coefficients obtained by experimental data fitting based on electrochemistry, thermodynamics, and fluid mechanics | |
| the angular frequency of power grid and wind turbine voltage, (Hz) | |
| the angular frequency of wind turbine voltage, (Hz) |
References
[1] Egeland-Eriksen T, Hajizadeh A, Sartori S. Hydrogen-based systems for integration of renewable energy in power systems: achievements and perspectives [J]. International Journal of Hydrogen Energy, 2021, 46(63):31963–31983.
[2] Rabiee A, Keane A, Soroudi A. Green hydrogen: A new flexibility source for security constrained scheduling of power systems with renewable energies[J]. International Journal of Hydrogen Energy, 2021, 46(37):19270–19284.
[3] M. Yue, H. Lambert, E. Pahon, et al., “Hydrogen energy systems: A critical review of technologies, applications, trends and challenges,” Renew. Sust. Energ. Rev., vol. 146, p. 111180, 2021.
[4] Tobi Michael Alabi, Emmanuel I Aghimien, Favour D Agbajor, Zaiyue Yang, et al. A review on the integrated optimization techniques and machine learning approaches for modelling, prediction, and decision making on integrated energy systems[J]. Renewable Energy, 2022, 822–849.
[5] A. Z. Arsad, M. A. Hannan, A. Q. AI-Shetwi, et al., “Hydrogen electrolyser technologies and their modelling for sustainable energy production: A comprehensive review and suggestions,” Int. J. Hydrog. Energy, vol. 48, no. 72, pp. 27841–27871, 2023.
[6] Nikolaidis P, Poullikkas A. A comparative overview of hydrogen production processes[J]. Renewable and sustainable energy reviews, 2017, 67:597–611.
[7] Boualam Benlahbib, Noureddine Bouarroudj, Saad Mekhilef, Dahbi Abdeldjalil, Thameur Abdelkrim, Farid Bouchafaa, Abelkader Lakhdari. Experimental investigation of power management and control of a PV/wind/fuel cell/battery hybrid energy system microgrid [J]. International Journal of Hydrogen Energy, 2020, 45(53):29110–29122.
[8] Dozein M G, Jalali A, Mancarella P. Fast frequency response from utility-scale hydrogen electrolyzers [J]. IEEE Transactions on Sustainable Energy, 2021, 12(3): 1707–1717.
[9] Huang C, Zong Y, You S, et al. Analytical modeling and control of grid-scale alkaline electrolyzer plant for frequency support in wind-dominated electricity-hydrogen systems [J]. IEEE Transactions on Sustainable Energy, 2023, 14(1): 217–232.
[10] Koponen J, Poluektov A, Ruuskanen V, et al. Comparison of thyristor and insulated-gate bipolar transistor-based power supply topologies in industrial water electrolysis applications [J]. Journal of Power Sources, 2021, 491: 229443.
[11] Koponen J, Ruuskanen V, Hehemann M, et al. Effect of power quality on the design of proton exchange membrane water electrolysis systems [J]. Applied Energy, 2020, 279: 115791.
[12] Concha D, Renaudineau H, Hernández M S, et al. Evaluation of DCX converters for off-grid photovoltaic-based green hydrogen production [J]. International Journal of Hydrogen Energy, 2021, 46(38): 19861–19870.
[13] Vitale G, Castaldi F, Guilbert D. Design of a LLC resonant converter for powering a PEM electrolyzer [J]. Renewable Energy and Power Quality Journal, 2021, 19: 452–458.
[14] Zhang H, Fan Z, Zhou J, et al. Design and simulation of LLC resonant converter for hydrogen production based on proton exchange membrane electrolysis [J]. Journal of Physics: Conference Series, 2022, 2215: 012017.
[15] Guilbert D, Sorbera D, Vitale G. A stacked interleaved DC-DC buck converter for proton exchange membrane electrolyzer applications: design and experimental validation [J]. International Journal of Hydrogen Energy, 2020, 45(1): 64–79.
[16] Yodwong B, Guilbert D, Phattanasak M, et al. AC-DC converters for electrolyzer applications: state of the art and future challenges [J]. Electronics, 2020, 9(6): 912.
[17] Furkan Akar. A fuel-cell/battery hybrid DC backup power system via a new high step-up three port converter[J]. International Journal of Hydrogen Energy, 2021, 46(73): 36398–36414.
[18] Pei Wei, Zhang Xue, Deng Wei, Tang Chenghong, Yao Liangzhong. Review on operation control strategy of DC microgrid with electric-hydrogen hybrid storage system[J]. CSEE Journal of Power and Energy Systems, 2022: 1–17.
[19] Lü Xueqin, Wu Yinbo, Lian Jie, Zhang Yangyang, Chen Chao, Wang Peisong, Meng Lingzheng. Energy management of hybrid electric vehicles: A review of energy optimization of fuel cell hybrid power system based on genetic algorithm[J]. Energy Conversion & Management, 2020:112474.
[20] Roumila, Z, Rekioua, D, Rekioua, T. Energy management based fuzzy logic controller of hybrid system wind/photovoltaic/diesel with storage battery[J]. International Journal of Hydrogen Energy, 2017, 42(30): 19525–19535.
[21] Hussain Shareef, Eslam Al-Hassan, Reza Sirjani. Wireless home energy management system with smart rule-based controller[J]. Applied Sciences, 2020, 10(4533): 4533.
[22] N. Ding, K. Prasad, T. T. Lie. Design of a hybrid energy management system using designed rule-based control strategy and genetic algorithm for the series-parallel plug-in hybrid electric vehicle[J]. International Journal of Energy Research, 2021, 45(2): 1627–1644.
[23] Saiteja Pemmareddy, Ashok. Critical review on structural architecture, energy control strategies and development process towards optimal energy management in hybrid vehicles[J]. Renewable & Sustainable Energy Reviews, 2022, 157: 1120–1138.
[24] Leonori Stefano, Martino Alessio, Frattale Mascioli, Fabio Massimo, Rizzi, Antonello. Microgrid energy management systems design by computational intelligence techniques[J]. Applied Energy, 2020, 277: 115524.
[25] Vitale F, Rispoli N, Sorrentino M, Rosen M. A, Pianese C. On the use of dynamic programming for optimal energy management of grid-connected reversible solid oxide cell-based renewable microgrids[J]. Energy, 2021: 1203–1204.
[26] Hu Xiaosong, Zou Changfu, Tang Xiaolin, Liu Teng, Hu Lin. Cost-optimal energy management of hybrid electric vehicles using fuel cell/battery health-aware predictive control[J]. IEEE Transactions on Power Electronics, 2020, 35(1): 382–392.
[27] Pan G, Gu W, Qiu H, et al. Bi-level mixed-integer planning for electricity-hydrogen integrated energy system considering levelized cost of hydrogen [J]. Applied Energy, 2020, 270: 115176.
[28] Samy M M, Mosaad M I, Barakat S. Optimal economic study of hybrid PV-wind-fuel cell system integrated to unreliable electric utility using hybrid search optimization technique [J]. International Journal of Hydrogen Energy, 2021, 46(20): 11217–11231.
[29] He Y, Guo S, Zhou J, et al. The quantitative techno-economic comparisons and multi-objective capacity optimization of wind-photovoltaic hybrid power system considering different energy storage technologies [J]. Energy Conversion and Management, 2021, 229: 113779.
[30] Zhang Y, Campana P E, Lundblad A, et al. Planning and operation of an integrated energy system in a Swedish building [J]. Energy Conversion and Management, 2019, 199: 111920.
[31] Kong L, Yu J, Cai G. Modeling, control and simulation of a photovoltaic/hydrogen/supercapacitor hybrid power generation system for grid-connected applications [J]. International Journal of Hydrogen Energy, 2019, 44(46): 25129–25144.
Biographies

Zhenming Zhang received the master’s degree in computer technology from Northeast Electric Power University in 2018, and the philosophy of doctorate degree in electrical engineering from Northeast Electric Power University in 2021, respectively. He is currently working as an intelligent control researcher at the State Key Laboratory of Low-carbon Smart Coal-fired Power Generation and Ultra-clean Emission, China Energy Science and Technology Research Institute Co., Ltd. His research areas include electric hydrogen coupling control, 3D simulation of industrial scale electrolysis stacks, and deep reinforcement learning.

Ge Yin received the bachelor’s degree in thermal energy and power engineering from China University of Mining and Technology in 2005, the master’s degree in power machinery and engineering from Southeast University in 2008, and is currently pursuing the doctorate degree in engineering at Southeast University, respectively. He is currently serving as the deputy director of the State Key Laboratory of Low-carbon Smart Coal-fired Power Generation and Ultra-clean Emission, China Energy Science and Technology Research Institute Co., Ltd. His research areas include multiphase heat and mass transfer, water electrolysis for hydrogen production, and multiphysics coupling.

Xueli Sun received the bachelor’s degree in environmental engineering from China University of Mining and Technology (Beijing Campus) in 2004, the master’s degree in Environmental Engineering from Beijing University of Technology in 2007, respectively. She is currently working as a Senior Engineer at National Energy Group Science and Technology Research Institute Co., Ltd. Her research areas include environmental protection in the energy sector, as well as research on energy-saving and environmental protection technologies and policies.

Yuanzhi Gao received the bachelor’s degree in Process Equipment and Control Engineering from Inner Mongolia University of Technology in 2017, the master’s degree in Chemical Engineering from Tianjin University in 2020, and the philosophy of doctorate degree in Power Engineering and Engineering Thermophysics from Southeast University in 2024, respectively. He is curently working as an Energy & Power Researcher at the State Key Laboratory of Low-carbon Smart Coal-fired Power Generation and Ultra-clean Emission, China Energy Science and Technology Research Institute Co., Ltd. His research areas include thermal energy storage and utilization, liquid air energy storage system, full spectrum utilization of solar energy, and thermoelectric system. He has been serving as a reviewer for several reputable journals in his field.

Feng Huang received the bachelor’s degree in Vehicle Engineering from Nanjing University of Aeronautics and Astronautics in 2014, the master’s degree in Mechanical Engineering from the University of Sydney in 2017, and the philosophy of doctorate degree in Mechanical Engineering from the University of New South Wales in 2022, respectively. He is currently serving as a researcher at the State Key Laboratory of Low-carbon Smart Coal-fired Power Generation and Ultra-clean Emission, China Energy Science and Technology Research Institute Co., Ltd. His research areas include multifunctional composites, cryogenic carbon fiber storage tanks, structural supercapacitors/batteries, solid-state electrolytes, and carbon fiber-based electrodes.
Strategic Planning for Energy and the Environment, Vol. 45_1, 139–178
doi: 10.13052/spee1048-5236.4516
© 2026 River Publishers