Urban Integrated Energy System Planning Integrating Temporal Characteristics and Two-Layer Optimization
Qiao-hua Guo, Shen Bao*, Ke-yong Guo, Wen Li and Hua-xiang Huang
Architectural Engineering Institute, Chenzhou Vocational Technical College, 423000 Chenzhou City, Hunan Province, China
E-mail: czzykyckt@163.com
*Corresponding Author
Received 19 January 2026; Accepted 28 February 2026
Abstract
To address the problems of insufficient consideration of source-load temporal characteristics, weak coordination between site and equipment configuration, and low efficiency of multi-objective optimization in the planning of urban smart local energy systems, this paper constructs a system planning method that integrates temporal characteristic analysis and two-layer multi-objective optimization. By constructing a source-load temporal coupling model, the dynamic characteristics of combined heat and power loads and renewable energy outputs such as wind, solar, hydrogen, and storage are accurately characterized. The temporal model provides dynamic data input for the lower-layer equipment configuration optimization. A two-layer optimization framework based on Voronoi diagrams and genetic algorithms is designed. The upper layer uses Voronoi diagrams to partition the space and select station sites. The lower layer employs an improved NSGA-II algorithm to optimize equipment selection and capacity configuration. The two layers interact iteratively: the upper layer provides zoning and load information to the lower layer, and the lower layer feeds back configuration costs to update the upper-layer planning. The framework achieves collaborative site selection and zoned energy supply for multiple energy stations. A fuzzy membership decision mechanism is introduced to enhance the engineering applicability of the Pareto solution set. Experimental results show that, for economics, the total annual cost of the system is reduced by approximately 12% compared to the traditional step-by-step optimization method. In terms of environmental protection, carbon emissions are reduced by approximately 15%. In terms of robustness, even considering demand-side response and load fluctuations of up to 20%, the system can still maintain an energy supply reliability of over 88%. The core innovation lies in the deep integration of high-resolution temporal dynamics with spatial-device collaborative optimization through a closed-loop iterative mechanism, which significantly improves planning accuracy, efficiency, and system adaptability. This method provides a theoretical and technical support for the low-carbon and efficient layout of urban smart local energy systems.
Keywords: Energy system, temporal characteristics, two-layer optimization, Voronoi diagram, NSGA-II algorithm, demand-side response.
Overview
As the demand for intelligent and low-carbon transformation of urban energy systems gradually increases, urban comprehensive energy system planning has become the key to achieving the “double carbon” goal. Therefore, developing a collaborative planning method that can deeply integrate temporal dynamics and spatial layout is the core key to improving system economy, reliability, and environmental protection [1, 2]. At present, although methods such as mixed integer programming are accurate enough, their solution efficiency is low, and it is difficult to cope with large-scale timing scenarios. Heuristic algorithms such as Particle Swarm Optimization (PSO) easily handle site selection and configuration in steps, separating the strongly coupled feedback between the two [3]. In contrast, Voronoi diagrams provide efficient geometric tools for site optimization with their natural partitioning capabilities based on spatial proximity. The Non-Dominated Sorting Genetic Algorithm (NSGA-II) can effectively obtain a uniformly distributed Pareto optimal solution set in multi-objective optimization [4, 5]. Therefore, this study proposes an urban comprehensive energy system planning method that integrates timing characteristics and Two-Layer Optimization (TLO), aiming to systematically solve core difficulties such as insufficient source-load dynamic characterization and space-equipment collaborative optimization difficulties. The innovation lies in the construction of a refined source-charge time series coupling model to accurately depict the dynamic characteristics of wind and solar hydrogen storage and multi-load. A two-layer iterative optimization framework based on the Voronoi diagram and the improved NSGA-II algorithm of “upper-layer location selection – lower-layer configuration” is designed to achieve collaborative decision-making of space layout and equipment capacity. A fuzzy membership decision-making mechanism is introduced to improve the engineering applicability of multi-objective Pareto solution sets.
1 Literature Review
Nowadays, energy system planning methods are more intensively studied. Cai X et al. proposed a frequency-constrained power generation planning method to address the problem of insufficient frequency adjustment resources in high-proportion Renewable Energy (RE) systems. This method extracted nonlinear constraints based on frequency dynamics simulation and embedded them into the system planning model, which could effectively improve frequency quality [6]. Allen R C et al. proposed a general multi-period comprehensive planning method for the operation scheduling problems of multi-node complex energy systems. This method used graph-based pattern scheduling to handle infrastructure decision-making and multi-path coordination, which could reduce the total system cost by more than 20% [7]. Zhao H et al. proposed an evaluation framework built on multi-criteria decision-making to address the lack of scientific evaluation of urban Integrated Energy System (IES) construction plans. This framework integrated the fuzzy Delphi method to establish an assessment system, and integrated subjective and objective weights to rank solutions and select the optimal solution [8]. Yan N et al. proposed a seasonal carbon trading optimization scheduling method to address coordination between Carbon Emissions (CEs) and economics of the IES under the carbon trading policy. This method embedded carbon flow in the energy hub model and built a staged and seasonal carbon trading mechanism, which could effectively reduce system costs, reduce CEs, and increase net income [9]. Fu X et al. proposed a photovoltaic greenhouse load control and energy system collaborative optimization method to address the difficult coordination of agricultural production and photovoltaic power generation in rural IESs. This method could reduce the energy cost of a typical photovoltaic greenhouse by 15%, effectively improving the system economy [10].
Many scholars have conducted extensive research on timing characteristic analysis and TLO technology. Girigoudar K et al. proposed an analysis framework based on TLO to address the problem that the flexibility of distributed energy resources managed by third parties in active distribution networks is difficult to safely invoke. This method could produce a concise set of operating rules, allowing entities such as transmission operators to safely and freely call distributed energy resources [11]. To collaboratively optimize electric bus dispatching and multi-energy operation in a regional IES, Fan H. et al. constructed a TLO model. The upper layer aimed to minimize system operating costs, while the lower layer optimized vehicle charging and discharging strategies and power generation/heating equipment. This model could effectively reduce electricity load fluctuations [12]. Toolabi Moghadam A et al. proposed a collaborative dispatching method based on TLO to address the lack of an interactive optimization framework between energy hubs and electric and heating distribution networks. The upper layer of the solution was hub optimization, the lower layer was grid response, and machine learning was integrated to deal with uncertainty. This method could effectively improve system flexibility and increase operating profits by 40% [13]. Ranjbar H et al. proposed a TLO framework based on stochastic programming to address RE distributed power grid connection investment and coordination. The upper level aimed to minimize the total social cost, and the lower level determined the electricity price and operating status through market clearing. This method could effectively coordinate economy, reliability, and CE targets [14]. Dong H et al. put forth a TLO method to address the problem of neglecting operational stability in size optimization of urban rail transit hybrid energy storage systems. This method collaboratively reduced costs and improved stability by optimizing capacity, power, and control strategies in two layers. It reduced daily operating costs by 12.68% and grid energy costs by 57.26% [15].
However, a critical gap persists in existing approaches: they often fail to simultaneously capture high-resolution temporal dynamics and perform spatial-equipment co-optimization in a tightly coupled manner. Specifically,
Temporal modeling granularity is insufficient: many studies adopt hourly or larger time steps, smoothing out intra-hour variability of renewable generation and multi-energy loads, which leads to under- or over-sizing of storage and conversion capacities.
Decoupled two-layer schemes cause sub-optimal results: when site selection and equipment configuration are optimized sequentially or with weak feedback, the spatial-energy-flow matching is compromised, increasing network losses and investment redundancy.
Convergence efficiency is limited: traditional mixed-integer programming and even some heuristic algorithms suffer from long computation times when scaling to annual hourly profiles and multiple energy stations, hindering practical application.
These limitations underscore the need for a holistic framework that embeds fine-grained temporal coupling directly into a collaborative TLO process, which is precisely the core contribution of the proposed method.
The gaps summarized in Table 1 highlight the specific shortcomings that the proposed method directly addresses. By integrating a high-resolution temporal model into a tightly-coupled TLO architecture, the decoupling and efficiency bottlenecks observed in prior works are overcome, thereby offering a more accurate, coordinated, and computationally feasible planning tool for urban IESs.
Table 1 Research gaps in temporal-spatial co-optimization of urban IES planning
| Research Gap | Limitation in Existing Methods | Proposed Countermeasure |
| Fine-grained temporal dynamics | Coarse time-steps (e.g., hourly) ignore intra-hour variability; steady-state assumptions weaken operational accuracy. | Source-load temporal coupling model with sub-hourly resolution to capture renewable and load fluctuations. |
| Tight coupling between site selection and equipment configuration | Sequential or weakly-iterated two-layer models lead to sub-optimal spatial-energy matching. | Iterative two-layer framework where Voronoi-based upper layer and improved NSGA-II-based lower layer interact in closed-loop. |
| Efficient solving under high-resolution temporal and spatial scales | High computational complexity limits application to large-scale, multi-station, yearly hourly scenarios. | Enhanced NSGA-II with improved crowding-distance mechanism accelerates Pareto front generation while preserving diversity. |
To sum up, current energy system planning methods mostly focus on specific aspects, and there is no system that integrates high-precision timing characteristics and space-equipment collaborative optimization. Traditional TLO technology tends to ignore temporal dynamics in the lower-layer model, and the solution efficiency and solution set quality need to be improved. Therefore, this study proposes a system planning method that deeply integrates timing characteristics and enhanced dual-layer optimization. This method accurately describes the dynamic characteristics by constructing a source-charge time series coupling model, and combines the Voronoi diagram space partitioning with the improved NSGA-II. It achieves collaborative optimization in the “upper-level site selection-lower-level configuration” framework, and effectively improves the dynamic adaptability, economic and environmental protection balance, and solution efficiency of the planning scheme.
2 Methodology
2.1 Temporal Characteristics Analysis and Modeling of Urban IESs
Urban energy systems are rapidly developing in the direction of intelligence and low-carbonization, but traditional steady-state planning methods are difficult to accurately describe their dynamic interaction process. Therefore, it is necessary to construct a refined source-load time-series coupling model to accurately describe the time-series changes in the output of REs, including electricity, heating, cooling loads, wind, and solar, etc., to provide reliable data input and physical constraints for subsequent capacity allocation and operation strategy optimization [16, 17]. The urban IES consists of energy production, conversion, transmission, and consumption links. Its architecture is shown in Figure 1.
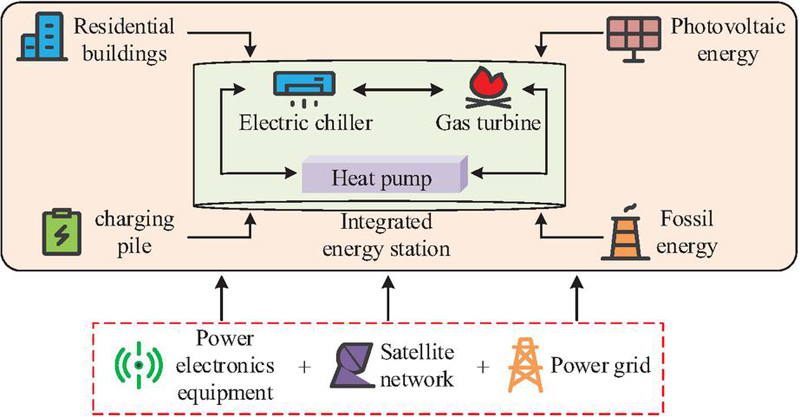
Figure 1 Architecture of urban IES.
In Figure 1, with the information communication network and cloud platform as the core, the urban comprehensive energy system relies on energy networks such as power grids and gas grids to integrate traditional energy and RE. It realizes the complementary utilization of electricity, heat, air, and cooling through multiple types of energy conversion equipment in the integrated energy station, and is ultimately controlled by intelligent power electronic equipment to meet users’ multiple load needs [18, 19].
The urban IES achieves efficient energy utilization through multi-energy complementation, of which integrated energy stations are the core carrier. To quantitatively analyze the flow, conversion, and distribution process of energy in the station, the basic equation of energy flow is introduced as shown in Equation (1).
| (1) |
In Equation (1), is the output energy vector, is the input energy vector, and is the coupling matrix. To further specify the above relationship, considering taking electricity and gas input and electricity and heat output as examples, the coupling process is shown in Equation (2).
| (2) |
In Equation (2), and are the output electrical load and thermal load. and are the input electric energy and gas. is the proportion of input electric energy allocated to the electric boiler for heating. is the proportion of input gas allocated to the fuel cell for cogeneration of heat and power. is the electrical conversion efficiency of the fuel cell. and are the electric energy output by the electrical Energy Storage Device (ESD) and the thermal ESD to the system. Distributed energy output has significant timing characteristics and is a key factor affecting system operation. Among them, the photovoltaic output model is directly related to light intensity and temperature, and its specific expression is given by Equation (3).
| (3) |
In Equation (3), and denote the actual output power and power temperature coefficient of the photovoltaic module. is the rated power of the photovoltaic module under standard test conditions. is the actual light intensity on the surface of the photovoltaic panel. is the actual operating temperature of the photovoltaic panel. and are the reference temperature and light intensity under standard test conditions. Similar to photovoltaics, wind energy resources are also highly volatile. The random characteristics of wind speed are usually described by the Weibull distribution, and its probability distribution function is shown in Equation (4).
| (4) |
In Equation (4), is the actual wind speed. is the scale parameter of the Weibull distribution. is the shape parameter of the Weibull distribution. is the probability density when the wind speed is . Based on this, the relationship between the actual output of the wind turbine and the wind speed can be expressed through a piecewise function model, as shown in Equation (5).
| (5) |
In Equation (5), , , and are the cut-in, cut-out, and rated wind speeds of the fan. means the rated output power of the fan. denotes the actual output power of the fan at wind speed . This study constructs the flow and conversion path of the above energy in the system. Figure 2 shows the specific energy flow framework.
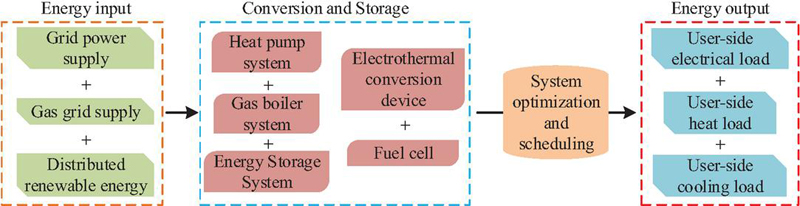
Figure 2 Framework for comprehensive energy flow in cities.
In Figure 2, the urban IES inputs energy through the external power grid, natural gas, and distributed RE, and converts and stores it through internal electric and thermal conversion devices, gas boilers, fuel cells, heat pumps, and energy storage systems. It then performs intelligent dispatching through a multi-energy complementary coordination and optimization mechanism, and finally outputs multiple loads of electricity, heat, and cooling that meet the demand to the user side, achieving efficient coupling and cascade utilization of energy.
In addition to RE, controllable energy conversion equipment is also an essential component of the system. The expression of the gas turbine power generation model is shown in Equation (6).
| (6) |
In Equation (6), is the output electric power of the gas turbine at time . denotes the natural gas energy consumed by the gas turbine at time . means the power generation efficiency of the gas turbine. is the low calorific value of natural gas. To smooth out fluctuations in RE and load, energy storage equipment is crucial. Its energy storage model needs to consider charge and discharge efficiency and self-loss, and the dynamic equation is shown in Equation (7).
| (7) |
In Equation (7), , , and are the stored energy, charging power, and discharging power of the ESD at time . , , and are the self-discharge rate, charging efficiency, and discharge efficiency of the ESD. is the time interval. Based on this, the time series modeling method of urban IES is obtained. The specific design process is displayed in Figure 3.
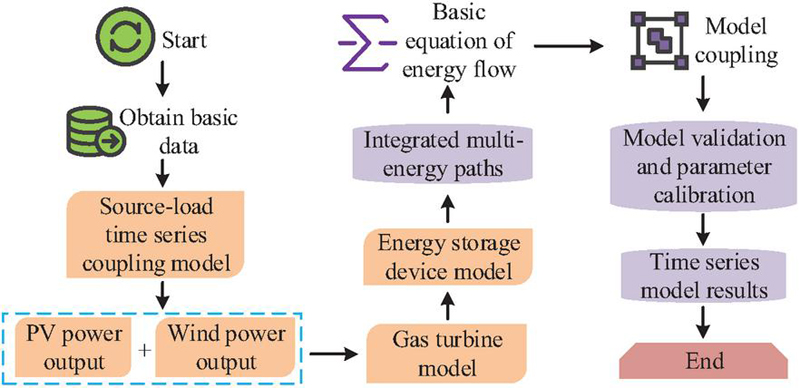
Figure 3 Time series modeling method for urban comprehensive energy system.
In Figure 3, the modeling method starts with the collection of basic data such as electricity, heating, cooling loads and meteorology, and then builds refined dynamic models of photovoltaics, wind turbines, gas turbines and energy storage equipment. It performs multi-energy coupling through energy flow equations, and finally forms a comprehensive timing model of the system after integration and verification, providing dynamic data support for subsequent planning and optimization.
The parameters for the aforementioned mathematical models are calibrated using real-world urban data to ensure practical relevance and accuracy. For the photovoltaic model (Equation 3), the power temperature coefficient and the reference irradiance are derived from manufacturer specifications and local historical meteorological data. The Weibull distribution parameters (scale and shape in Equation 4) for wind speed are fitted using long-term hourly wind speed data from the NASA POWER dataset, employing maximum likelihood estimation to capture local wind patterns. Load profiles (electrical, heating, and cooling) are constructed based on the OpenEI Commercial & Residential dataset, with typical load shapes calibrated against measured consumption data from target urban areas to reflect temporal variations accurately. This data-driven calibration process ensures that the temporal coupling model reliably represents the dynamic characteristics of renewable generation and multi-energy loads under specific urban contexts, forming a credible foundation for subsequent optimization.
2.2 TLO Planning for Urban IESs
Although timing modeling provides an accurate dynamic data basis for planning, if the strong coupling relationship between the energy station spatial layout and equipment configuration is ignored. Therefore, this study proposes a TLO framework: the upper layer determines the optimal location and service zoning of energy stations, and the lower layer optimizes the equipment selection and capacity of each station under a given location. The hierarchical structure and information interaction relationship of the two-tier site selection optimization configuration model are shown in Figure 4.
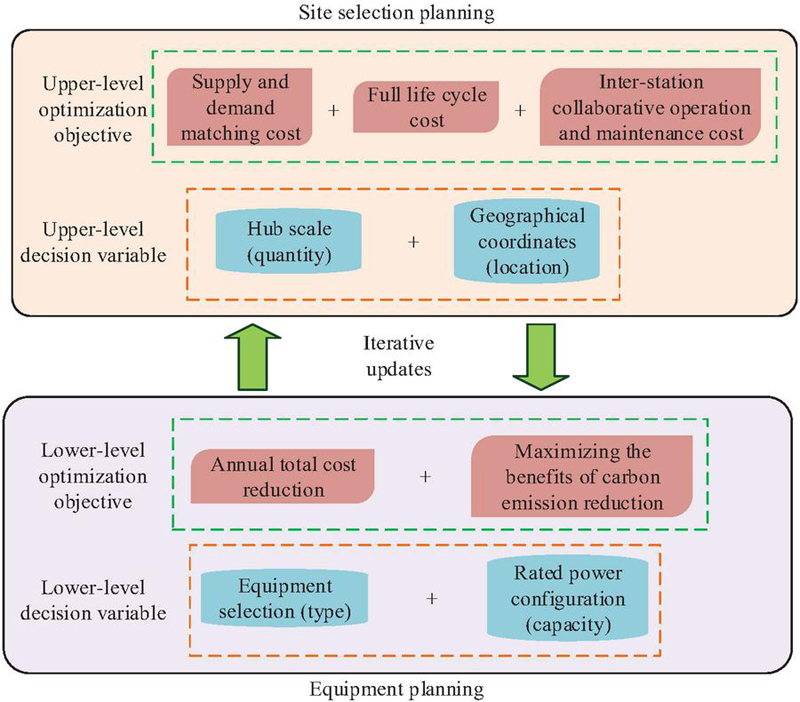
Figure 4 Dual layer site selection optimization configuration model
In Figure 4, the upper layer site selection planning aims to minimize the cost of contact, investment and maintenance, and inter-station communication. The decision variables are the number and location of stations, and the energy supply range load situation is output to the lower layer. The lower layer is the equipment planning model, whose decision variables are equipment type and capacity, and the optimized configuration plan and corresponding costs are fed back to the upper layer. The optimization goal is to maximize the annual total cost savings rate and CE reduction rate. The two calculate iteratively, and the upper layer updates the cost according to the results of the lower layer, loops until convergence, and optimizes the site and equipment configuration.
The upper and lower optimization objectives are internally related and may conflict with each other. The upper layer focuses on minimizing the total investment cost and tends to reduce the number of stations; However, the lower layer shall be economical and environmentally friendly, which may require richer or higher equipment configuration. To coordinate this contradiction, the implicit penalty mechanism based on cost feedback is adopted in the iterative process of this study: the Total Annual Cost (TAC) of lower feedback directly reflects the feasibility and economic efficiency of the configuration scheme. If the lower-layer options are not feasible or perform poorly, this can result in costly TAC. This creates a penalty effect in the upper-level objective function, leading to site selection in favor of the lower-level direction to achieve an economically feasible configuration. In addition, the fuzzy membership decision mechanism (Equations 14–15) adopted at the final stage assists in the comprehensive trade-off between economic and environmental benefits. This mechanism ensures the coordinated promotion of TLO and finally obtains the system scheme that balances the spatial planning, operation performance, and emission reduction benefits.
The upper-level site selection planning aims to minimize the total system investment while satisfying load coverage. Its objective function is shown in Equation (8).
| (8) |
In Equation (8), is the total cost of the upper-level site selection plan. is the load weight or priority coefficient of the -th energy station. is the unit energy transmission or connection cost from the -th load point to the -th energy station. is whether the -th load point is supplied by the -th energy station. is the fixed investment and operation and maintenance cost of building the energy station at location . is the cost coefficient of the inter-site communication connection. and indicate whether to establish a site at and and consider their communication connections. Among them, the investment cost of the site needs to be evaluated from a full life cycle perspective, and is usually converted using the equal annuity method, as shown in Equation (9).
| (9) |
In Equation (9), is the annual investment cost of equal annuity for the -th energy station. is the capacity of Class equipment installed in the -th station. is the investment cost per unit capacity of Class equipment. is the discount rate. is the economic service life of Class equipment. In lower-level equipment planning, the goal is to further focus on improving the comprehensive benefits of specific configuration solutions. To this end, this study defines two core indicators: Annual total Cost savings Rate (ACR) and CO2 Reduction rate (COR). Their calculation is shown in Equation (10).
| (10) |
In Equation (10), and are the ACR and COR of the -th energy station. / and / are the TAC and CEs of station under the reference plan and design plan. Any planning scheme must satisfy basic physical operation constraints, among which the instantaneous balance of electric power is one of the most critical constraints, as shown in Equation (11).
| (11) |
In Equation (11), is the electrical load demand. , , and are the power generation of photovoltaics, wind power, and gas turbines. is the power purchased from the grid. and are the charging and discharging power of the electrical energy storage. Optimizing the complex models described above requires efficient solution strategies. In the upper-level location selection problem, the Voronoi diagram is first used to divide the spatial area, and its definition is shown in Equation (12).
| (12) |
In Equation (12), is any point in the planning area. is a different energy station candidate point in the site set . is the distance from point to site . After identifying candidate sites and service partitions, multiple target device optimization configurations need to be performed within each partition. This study introduces the NSGA-II algorithm with efficient Non-Dominated Sorting (NDS) capabilities to solve this problem. Its workflow is shown in Figure 5.
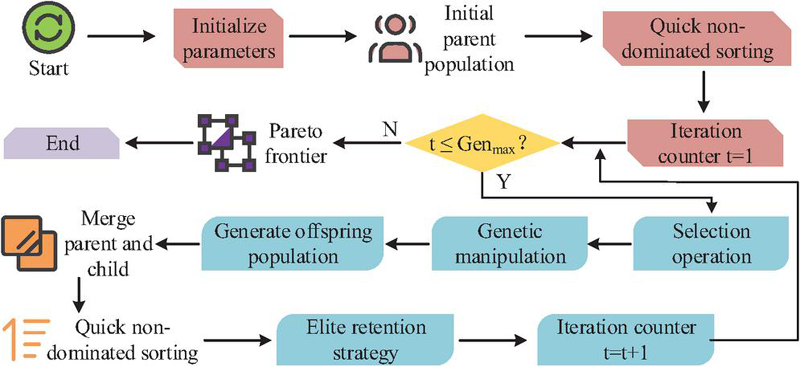
Figure 5 Workflow of NSGA-II.
In Figure 5, the first step is to initialize the population parameters and classify the initial population through fast NDS and individual crowding calculation. In the iterative process, the algorithm performs binary tournament selection based on sorting and crowding, and generates offspring populations through crossover and mutation operations. Subsequently, the algorithm merges the parent-child generation populations and sorts them again, uses the elite retention strategy to screen out the new generation population, and finally outputs a uniformly distributed Pareto optimal solution set [20, 21].
However, the standard NSGA-II algorithm is still insufficient in maintaining the diversity of solution set distribution, which may lead to uneven distribution of Pareto front solution sets. To this end, an improved congestion degree calculation mechanism is introduced, and its specific calculation is shown in Equation (13).
| (13) |
In Equation (13), is the crowding degree of individual . is the value of the -th objective function of the next individual adjacent to individual in the Pareto front. The two parameters and calibrate the upper and lower limits of the value range of the current population on the nth objective function. Finally, selecting a solution that best suits the decision-maker’s preferences from the obtained Pareto optimal solution set requires effective decision-making tools. A fuzzy membership function is used to handle this multi-objective decision-making problem, whose definition is shown in Equation (14).
| (14) |
In Equation (14), and are the satisfaction and actual values of solution on the objective function. and are the completely satisfactory lower and upper limits set by the decision-maker for the objective function. Afterwards, this study comprehensively evaluates and ranks the plans by calculating the standardized satisfaction of each plan, thereby clearly identifying the final recommended planning plan with the best overall performance. The details are given by Equation (15).
| (15) |
In Equation (15), is the standardized satisfaction degree of the -th Pareto solution (scheme). is the fuzzy membership degree of the -th solution on the -th objective function. To sum up, this study forms a complete planning method system by integrating the source-charge temporal coupling model, Voronoi diagram space segmentation, and improved NSGA-II. The specific framework is exhibited in Figure 6.
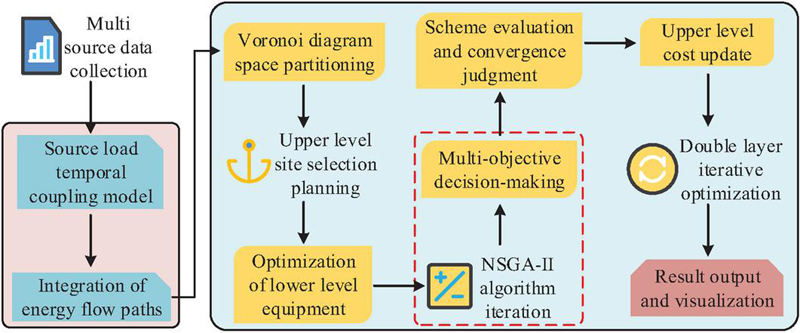
Figure 6 Urban comprehensive energy system planning system.
In Figure 6, the algorithm obtains multi-source time series data through data preprocessing, and constructs a source-charge dynamic coupling model and a multi-energy conversion matrix. It uses Voronoi diagrams to achieve spatial partitioning optimization and determine candidate energy station layouts. Based on the improved NSGA-II, collaborative optimization is carried out in a two-layer iterative framework of upper-layer location selection and lower-layer equipment configuration through fast NDS, congestion degree calculation, and elite retention strategy. Finally, a Pareto optimal planning solution that takes into account economy and reliability is output.
3 Results and Analysis
3.1 Urban IES Performance Testing
For a planning algorithm that integrates timing characteristics and two-level optimization, this study aims to evaluate its actual performance when applied to urban IESs. The experiment selects NASA POWER and OpenEI Commercial & Residential datasets as the main test data sources. To concretize the planning scenario, a representative urban new district with an area of 10 km 10 km (100 km2) is used as the case study region. The planning task involves determining the optimal layout of integrated energy stations to serve this area. Key spatial and load input parameters are defined as follows: (1) Load Points: 500 points are uniformly distributed across the region, each representing aggregated electrical, heating, and cooling demands for a building block. Their load profiles are scaled from the OpenEI dataset based on assumed building types and area densities. (2) Candidate Station Sites: 25 potential sites are pre-selected at intersections of major infrastructure corridors, serving as inputs to the Voronoi-based upper-layer optimization. (3) Spatial Scale: The 100 km2 area and the load density range of 50–300 MW/km2 (as used in Figure 7) represent a typical medium-scale urban development zone, ensuring the generality of the findings. (4) Network Constraints: A simplified radial structure is assumed for the underlying electrical and heating distribution networks, with distance-based loss coefficients applied to the energy transmission cost term in Equation (8). This defined case provides a realistic and reproducible spatial-physical foundation for evaluating and comparing the performance of all planning algorithms.
When performing performance testing, Table 2 shows the software and hardware used and their parameters.
Table 2 The preset parameters of each component in the device
| Names | Parameter |
| Optimization modeling | Pyomo |
| Scientific computing | SciPy/NumPy |
| Data processing | Pandas |
| Visualization | Matplotlib |
| GIS analysis | QGIS |
| Energy monitoring | OpenEnergyMonitor |
| Building energy consumption | EnergyPlus |
| Power system | OpenDSS |
| Optimization solver | CBC |
Tests are conducted based on the above configuration, and the research method is referred to as Temporal-Dual Optimization Planning (TDOP).
To highlight the advantages of time-space collaborative optimization, the research method is compared with the urban comprehensive energy system planning method based on the PSO-NSGA-II algorithm and the Kalush-Kuhn-T (KKT) condition transformation method. Two kinds of benchmark strategies at the level of timing or spatial optimization are introduced for comparison. The core features of all comparison methods are shown in Table 3.
Table 3 Characteristics of compared planning methods
| Temporal | Spatial | Core Mechanism & Rationale | |
| Method | Modeling | Partitioning | for Comparison |
| TDOP (Proposed) | High-resolution source-load temporal coupling | Dynamic partitioning via Voronoi diagram | Integrates fine-grained time-series data with iterative, feedback-driven spatial-equipment co-optimization. Serves as the benchmark for full spatio-temporal coordination. |
| PSO-NSGA-II | Coarse time-steps (e.g., typical daily profiles) | Pre-defined, static zones | Represents heuristic methods that partially address multi-objective configuration but lack integrated temporal dynamics and adaptive spatial planning. |
| KKT | Steady-state or single-time-slice | Not applicable (single-station or network model) | Represents traditional precise optimization with high complexity, struggling with temporal scalability and spatial decision-making. |
| Time-Ignored Method | Steady-state (average load & generation) | Dynamic via Voronoi | Isolates the impact of temporal modeling by using static data, highlighting the value of time-series dynamics. |
| Static-Partition Method | High-resolution temporal coupling | Fixed, pre-defined geographic zones | Isolates the impact of adaptive spatial planning, highlighting the value of dynamic site selection and zoning. |
By comparing TDOP with these benchmark methods, the results can be explained mechanically: the performance gap directly caused by the lack of high-precision time series analysis or adaptive space optimization can be clearly identified, thus exceeding the simple numerical comparison, revealing the functional contribution of each integrated component.
To ensure a rigorous and equitable comparison, the benchmark algorithms (PSO-NSGA-II and the KKT-based method) are meticulously adapted to address the identical urban IES planning problem defined in Section 2, utilizing the same input datasets, spatial parameters (e.g., candidate sites, load points), and optimization objectives. For the PSO-NSGA-II baseline, a sequential two-stage approach is implemented: a PSO module performs site selection (upper-layer), the output of which is then fed into a standard NSGA-II module for equipment configuration (lower-layer). Its key parameters (e.g., swarm size of 50 for PSO, population size of 100 and 200 generations for NSGA-II) are set based on common practices in the literature and calibrated through preliminary trials to ensure convergence without undue advantage. The KKT-based method transforms the bi-level model into a single-level Mathematical Program with Equilibrium Constraints (MPEC), which is solved using the IPOPT solver with tight convergence tolerances (1e-6). Crucially, all algorithms are subjected to the same computational budget and termination criteria (e.g., maximum iteration limits, convergence thresholds) within the identical software/hardware environment (Table 1). This careful configuration ensures that performance differences observed in Figures 7–11 are attributable to the core methodological distinctions (e.g., integrated vs. decoupled optimization, handling of temporal dynamics) rather than disparities in implementation or parametric tuning.
Comparing the research method with the planning efficiency of PSO-NSGA-II and KKT, the test results are shown in Figure 7.
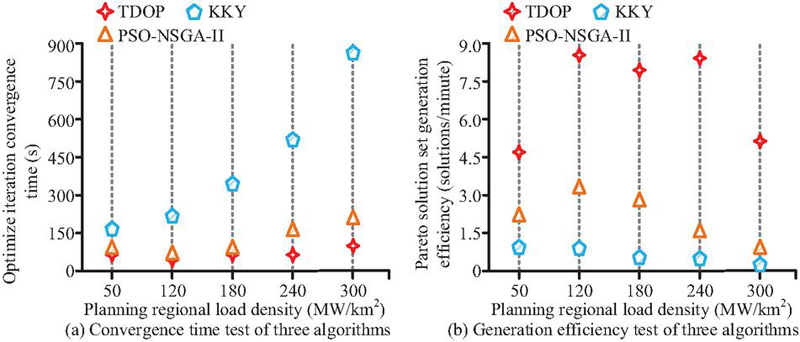
Figure 7 Planning efficiency among three algorithms.
Figure 7(a) shows the comparison of the optimization iteration convergence time of the various algorithms, and Figure 7(b) shows the comparison of the Pareto solution set generation efficiency. In Figure 7(a), as the load density in the planned area increases, TDOP relies on the synergistic advantages of timing coupling, Voronoi partitioning, and improved NSGA-II, and the convergence time fluctuates in a “decline – slight rise – slow drop – steep rise”. At 120 MW/km2, the minimum value reaches 38.6 s, and at 300 MW/km2, it is 106.7 s. PSO-NSGA-II quickly climbs after 120 MW/km2, reaching 289.4 s at 300 MW/km2. The KKT method rises steeply throughout the process, breaking through 897 s at 300 MW/km2. In Figure 7(b), TDOP forms double peaks (8.5, 8.3/min), PSO-NSGA-II peaks at only 3.3/min and then drops sharply, and KKT is lower than 1/min throughout the process. Research algorithms are more efficient in planning. The observed convergence speed advantage of TDOP at 120 MW/km2 (Figure 7a) can be attributed to the optimal synergistic effect between temporal coupling and Voronoi partitioning under this specific load density. At this moderate density level, the temporal variability of renewable generation and multi-energy loads is significant enough to provide rich data for capacity optimization, yet not excessively complex to process. Simultaneously, the Voronoi diagram yields well-proportioned and geographically coherent service partitions, enabling efficient feedback between the upper-layer site selection and lower-layer equipment configuration. At lower load densities, the temporal and spatial variations are too mild to fully exploit the co-optimization mechanism. At higher densities, the increased complexity of both temporal dynamics and spatial interactions elevates the computational burden, thus extending the convergence time despite the maintained robustness of the framework.
Afterwards, this study compares the system adaptability of the three methods, as shown in Figure 8.
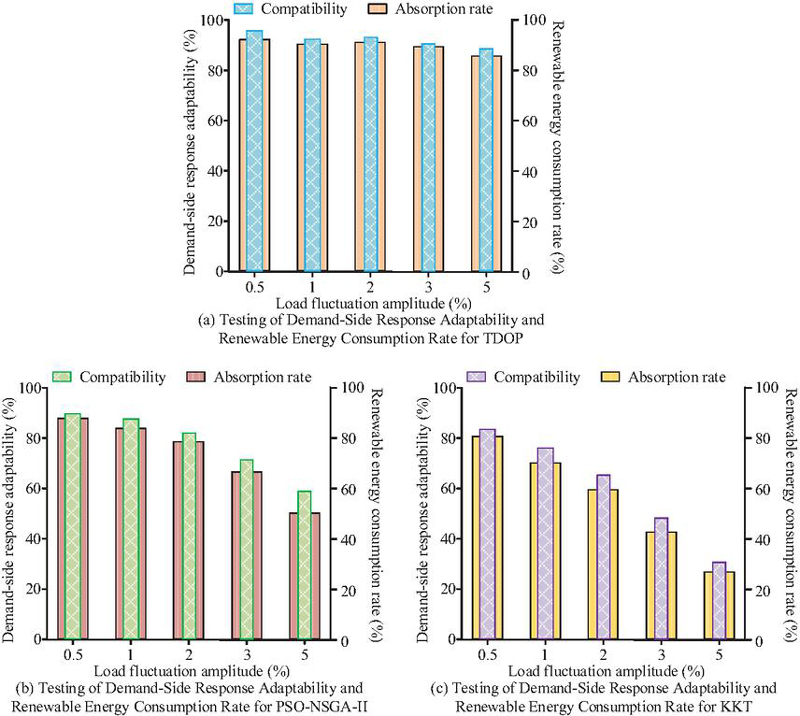
Figure 8 Comparison of system adaptability of three algorithms.
Figure 8(a) shows the test results of demand-side response adaptability and RE consumption rate of TDOP, while Figure 8(b) and Figure 8(c) show the test results of PSO-NSGA-II and KKT. In Figure 8(a), TDOP relies on the advantages of source-load timing coupling and double-layer optimization. As the load fluctuation amplitude increases, the demand-side response adaptability and RE consumption rate fluctuate smoothly, and still reach more than 85% when the load fluctuates by 30%. In Figure 8(b), PSO-NSGA-II lacks precise timing adaptation, and the index accelerates downward after a 20% fluctuation, and the adaptation degree is only 58.9% at 30%. In Figure 8(c), KKT is limited by the static algorithm, the indicator drops sharply throughout the process, and the consumption rate is only 35.6% when the fluctuation is 30%. The TDOP system has better adaptability and can adapt to complex load fluctuation scenarios.
3.2 Urban IES Simulation Verification
To verify the testing effect of the research method in actual application scenarios, this study compares the economics of the three algorithms, as shown in Figure 9.
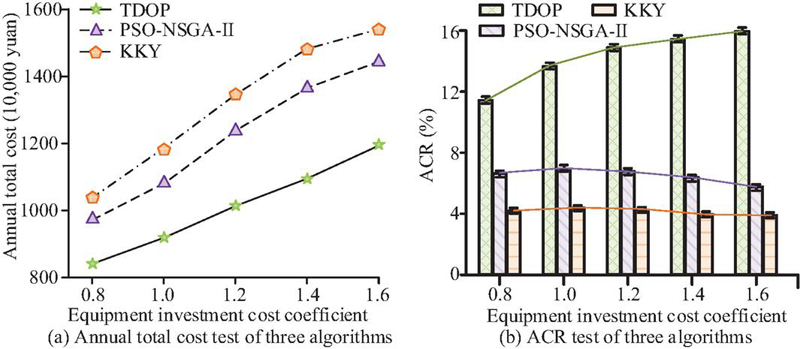
Figure 9 Economic comparison of three algorithms.
Figure 9(a) shows the annual total cost test results of the three algorithms. Figure 9(b) shows the ACR comparison of each algorithm. In Figure 9(a), TDOP relies on the advantages of source-load timing coupling modeling and two-layer collaborative optimization to adapt to different equipment investment cost coefficient scenarios and has outstanding cost control capabilities. When the coefficient is 1.6, the TAC is only 12.03 million yuan. PSO-NSGA-II lacks timing and space coordination, and its redundant configuration results in high costs, with the same coefficient reaching 14.5 million yuan. KKT does not consider system-level optimization, has the highest cost, and the fastest growth rate, reaching 15.5 million yuan. In Figure 9(b), the ACR of TDOP steadily flattens to 15.8% as the coefficient increases, maintaining significant cost savings even under high cost pressure. PSO-NSGA-II is subject to optimization limitations, and the ACR dropped slightly to 6.1%. KKT only maintains a low savings rate of 3.9%–4.5%. TDOP adapts to different equipment cost scenarios through balanced optimization of investment and operating costs, significantly reducing the TAC and making the economic application value higher.
Attribution Analysis of Economic Advantages: The superior economic performance of TDOP stems directly from its core innovations. The high-resolution temporal coupling model enables precise matching of supply and demand, minimizing the oversizing of conversion and storage equipment, a major contributor to capital cost. Concurrently, the iterative two-layer framework dynamically balances upfront investment against long-term operational expenses. As quantified in Table 4, TDOP’s cost saving is not merely a reduction in total expenditure but a structural optimization across cost components.
Table 4 Decomposition of economic advantages for the scenario with an equipment cost coefficient of 1.6
| Cost | KKT | Primary Driver | ||
| Component | TDOP | PSO-NSGA-II | Method | of TDOP’s Advantage |
| Annualized Capital Cost (Million CNY) | 6.82 | 8.45 | 9.10 | Temporal model avoids over-sizing; Voronoi optimizes station number/location. |
| Annual Operational Cost (Million CNY) | 5.21 | 6.05 | 6.40 | Two-layer co-optimization achieves efficient dispatch, reducing energy purchase and waste. |
| TAC (Million CNY) | 12.03 | 14.50 | 15.50 | Synergistic effect of integrated spatio-temporal planning. |
Afterwards, this study compares the environmental protection of the three methods and simulates the actual application scenario of gradually increasing the penetration rate of RE in the urban IES, as shown in Figure 10.
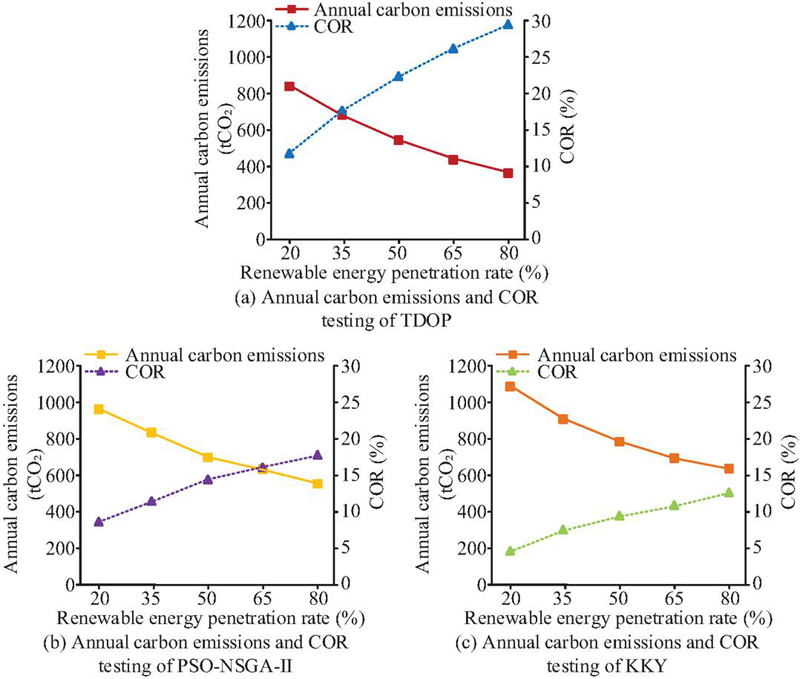
Figure 10 Comparison of environmental protection of three algorithms.
Figure 10(a) shows the annual CEs and COR data of TDOP. As the penetration rate increases from 20% to 80%, leveraging the advantages of source-charge sequential coupling modeling and double-layer optimization, CEs non-linearly decrease from 850t CO2 to 380t CO2, and COR rises steadily from 12.1% to 29.5%. Efficient emission reduction is still maintained during the high penetration rate stage. Figure 10(b) shows the comparison of PSO-NSGA-II. Due to the lack of temporal and spatial coordination, the decrease in CEs has slowed down. At 80% penetration, it reaches 550t CO2, and the COR is only 17.9%, limiting the emission reduction potential. Figure 10(c) shows the test data of the KKT method. Multi-energy complementation is not considered, and the CEs are always the highest. At 80% penetration, there is still 650t CO2, the COR is only 12.8%, and the environmental performance is weak. The research algorithm is more environmentally friendly, can adapt to high penetration and low-carbon needs, and has outstanding application value.
Attribution Analysis of Environmental Benefits: The enhanced carbon reduction capability of TDOP is primarily driven by its improved utilization of RE and optimized operation of hybrid energy systems. The temporal coupling model forecasts renewable generation peaks and load valleys with high accuracy, guiding the storage system to store excess RE effectively. The TLO ensures that the siting and configuration of stations facilitate the local consumption of RE, minimizing transmission losses and curtailment. As shown in Table 5, TDOP achieves a higher RE penetration rate internally, which is the direct cause of its lower CEs.
Table 5 Key sub-indicators of environmental performance at 80% RE penetration
| KKT | ||||
| Sub-indicator | TDOP | PSO-NSGA-II | Method | Interpretation |
| Effective Local RE Utilization Rate | 71.5% | 63.2% | 58.7% | Temporal-spatial synergy maximizes onsite consumption. |
| Energy Storage Round-Trip Efficiency Utilization | 88.3% | 79.1% | 72.4% | Precise temporal guidance optimizes storage cycles. |
| CE per Unit of Delivered Energy (kgCO2/kWh) | 0.132 | 0.181 | 0.205 | Result of optimized generation mix and reduced fossil fuel backup. |
Afterwards, this study compares the robustness of the three algorithms, as shown in Figure 11.
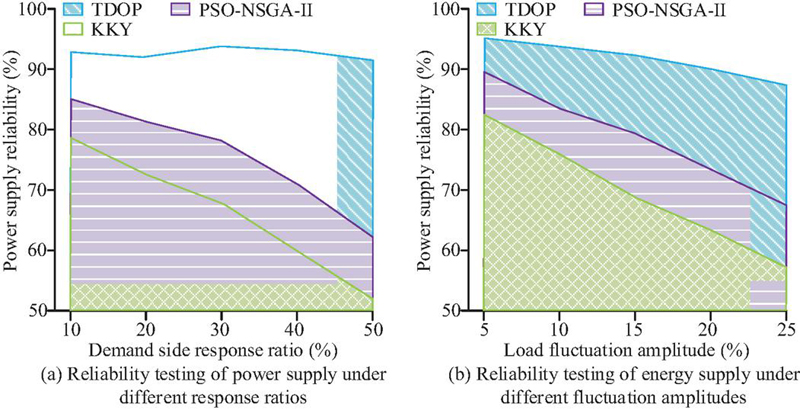
Figure 11 Comparison of robustness of three algorithms.
Figure 11(a) shows the energy supply reliability under different demand-side response ratios of each algorithm. Figure 11(b) shows the energy supply reliability test under different load fluctuation ranges. In Figure 11(a), as the demand-side response ratio increases, TDOP relies on the advantages of timing coupling and double-layer optimization, and the energy supply reliability fluctuates smoothly, still reaching 92.9% at the extreme ratio of 50%. PSO-NSGA-II drops sharply after 30% and is only 63.8% at 50%. KKT falls sharply throughout the whole process, falling to 52.7% at 50%. In Figure 11(b), the energy supply reliability is 90.5% when TDOP fluctuates by 20%, and remains 88.3% when TDOP fluctuates by 25%. PSO-NSGA-II quickly drops to 68.2% after 20%. KKT deteriorates throughout, with only 57.1% at 25%. The research algorithm is more robust and can adapt to complex actual scenarios of demand-side response and load fluctuations.
4 Limitations and Assumptions
The validity of the research method depends on the setting of key parameters, mainly including: (1) Weibull distribution parameters of wind speed; (2) Temperature and loss coefficient of PV module; (3) Typical time series curve of load; (4) Equipment and energy cost forecast; (5) Fixed efficiency value of energy efficiency equipment. Sensitivity analysis verifies that parameter fluctuations have a limited impact on the scheme (e.g., 20% change of Weibull parameter only causes about 8% change of energy storage configuration), and the overall planning framework remains stable. However, the dependence of models on historical data and typical patterns may limit their generality in scenarios of very different resource conditions or rapidly evolving technologies. Therefore, enhancing the adaptability to parameter uncertainty is an important aspect of subsequent research.
5 Summary and Future Work
To address insufficient consideration of timing characteristics and weak coordination of site and equipment in urban IES planning, this study proposed a system planning method that integrated timing characteristics analysis and two-layer multi-objective optimization. By constructing a source-charge timing coupling model to accurately characterize the dynamic characteristics, a TLO framework of “upper-layer location selection-lower layer configuration” based on the Voronoi diagram and improved NSGA-II algorithm was designed. In the experiment, in the planning efficiency test, when the load density was 120 MW/km2, the algorithm convergence time was only 38.6 s. In the system adaptability test, when the load fluctuation reached 30%, the RE consumption rate remained above 85%. In practical application, in terms of economy, the highest ACR of the research algorithm reached 15.8%. In terms of environmental protection, when the RE penetration rate reached 80%, the COR increased to 29.5%. In terms of robustness, when the demand-side response ratio reached 50%, the system energy supply reliability was 92.9%. In summary, the proposed planning scheme has excellent economy, environmental protection, and system resilience, and can provide effective support for the layout of urban low-carbon energy systems. However, the computational complexity of the algorithm is high when dealing with very large-scale networks, and some parameters in the model still rely on historical data assumptions. Future work can introduce graph neural networks to enhance spatial partitioning capabilities and integrate reinforcement learning technology to improve the level of adaptive optimization of uncertainty.
Future research could be more closely aligned with the core themes of this work in the following directions: (1) Developing adaptive temporal modeling techniques that can dynamically adjust forecasting granularity based on renewable penetration and load variability; (2) Exploring the integration of graph neural networks into the Voronoi-based spatial partitioning process to directly learn optimal site boundaries from complex urban network topographies and energy flow patterns; (3) Investigating a three-layer optimization framework that introduces a middle layer dedicated to real-time operational dispatch, thereby bridging long-term planning with short-term flexibility management.
References
[1] Zhang H, Zhou S, Gu W, Liu Z, Zhan X, Liu H. A collaborative planning methodology of energy stations and energy networks in integrated energy system[J]. IET Renewable Power Generation, 2022, 16(14): 3023–3040. DOI: 10.1049/rpg2.12551
[2] Rastgou A, Hosseini-Hemati S. Simultaneous Planning of the Medium and Low Voltage Distribution Networks under Uncertainty: A Bi-Level Optimization Approach[J]. International Transactions on Electrical Energy Systems, 2022, 2022(1): 2267926. DOI: 10.1155/2022/2267926
[3] Zhao X, Mu H, Li N, Shi X, Chen C, Wang H. Optimization and analysis of an integrated energy system based on wind power utilization and on-site hydrogen refueling station[J]. International journal of hydrogen energy, 2023, 48(57): 21531–21543. DOI: 10.1016/j.ijhydene.2023.03.056
[4] Yakut M Z, Esen S. A comprehensive survey of the urban building energy modeling (UBEM) process and approaches[J]. International Journal of Energy Studies, 2023, 8(1): 87–116. DOI: 10.58559/ijes.1228599
[5] Li J, Gong Z, Miao G, Wang X, Yuan L, Jia X, et al. Multi-objective optimization of power-gas-heat integrated energy system based on NSGA-II-MOPSO hybrid intelligent algorithm[J]. Journal of Electrical Engineering & Technology, 2025, 20(8): 4941–4957. DOI: 10.1007/s42835-025-02347-7
[6] Cai X, Zhang N, Du E, An Z, Wei N, Kang C. Low inertia power system planning considering frequency quality under high penetration of renewable energy[J]. IEEE Transactions on Power Systems, 2023, 39(2): 4537–4548. DOI: 10.1109/TPWRS.2023.3302515
[7] Allen R C, Baratsas S G, Kakodkar R, Avraamidou S, Demirhan C D, Heuberger-Austin C F, et al. A multi-period integrated planning and scheduling approach for developing energy systems[J]. Optimal Control Applications and Methods, 2023, 44(2): 355–372. DOI: 10.1002/oca.2866
[8] Zhao H, Guo S. Urban integrated energy system construction plan selection: a hybrid multi-criteria decision-making framework[J]. Environment, Development and Sustainability, 2025, 27(6): 14223–14252. DOI: 10.1007/s10668-024-04491-y
[9] Yan N, Ma G, Li X, Guerrero J M. Low-carbon economic dispatch method for integrated energy system considering seasonal carbon flow dynamic balance[J]. IEEE Transactions on Sustainable Energy, 2022, 14(1): 576–586. DOI: 10.1109/TSTE.2022.3220797
[10] Fu X, Zhou Y. Collaborative optimization of PV greenhouses and clean energy systems in rural areas[J]. IEEE Transactions on Sustainable Energy, 2022, 14(1): 642–656. DOI: 10.1109/TSTE.2022.3223684
[11] Girigoudar K, Roald L A. Identifying secure operating ranges for DER control using bilevel optimization[J]. IEEE Transactions on Smart Grid, 2023, 15(3): 2921–2933. DOI: 10.1109/TSG.2023.3329726
[12] Fan H, Wang D, Yu Z, Du L. Bilevel optimal scheduling of electric bus fleets in regional integrated electricity–gas–heat energy systems[J]. IEEE Transactions on Transportation Electrification, 2022, 9(2): 2792–2807. DOI: 10.1109/TTE.2022.3213615
[13] Toolabi Moghadam A, Soheyli F, Sanei S, Akbari E, Khorramdel H, Ghadamyari M. Bi-level optimization of the integrated energy systems in the deregulated energy markets considering the prediction of uncertain parameters and price-based demand response program[J]. Energy Science & Engineering, 2022, 10(8): 2772–2793. DOI: 10.1002/ese3.1166
[14] Ranjbar H, Saber H, Sharifzadeh M. Bi-level planning of distributed energy resources into existing transmission grids: Pathway to sustainable energy systems[J]. IET Generation, Transmission & Distribution, 2022, 16(24): 4963–4979. DOI: 10.1049/gtd2.12647
[15] Dong H, Tian Z, Spencer J W, Fletcher D, Hajiabady S. Bilevel optimization of sizing and control strategy of hybrid energy storage system in urban rail transit considering substation operation stability[J]. IEEE Transactions on Transportation Electrification, 2024, 10(4): 10102–10114. DOI: 10.1109/TTE.2024.3385821
[16] Wang C, Wang Y, Ding Z, Zheng T, Hu J, Zhang K. A transformer-based method of multienergy load forecasting in integrated energy system[J]. IEEE Transactions on Smart Grid, 2022, 13(4): 2703–2714. DOI: 10.1109/TSG.2022.3166600
[17] Sharma P, Said Z, Kumar A, Nizetic S, Pandey A, Hoang A T, et al. Recent advances in machine learning research for nanofluid-based heat transfer in renewable energy system[J]. Energy & Fuels, 2022, 36(13): 6626–6658. DOI: 10.1021/acs.energyfuels.2c01006
[18] Bohra S S, Anvari-Moghaddam A. A comprehensive review on applications of multicriteria decision-making methods in power and energy systems[J]. International Journal of Energy Research, 2022, 46(4): 4088-4118. DOI: 10.1002/er.7517
[19] Nuvvula R, Devaraj E, Srinivasa K T. A comprehensive assessment of large-scale battery integrated hybrid renewable energy system to improve sustainability of a smart city[J]. Energy sources, part a: recovery, utilization, and environmental effects, 2025, 47(1): 6195–6215. DOI: 10.1080/15567036.2021.1905109
[20] Tang W, Wang B, Wang F, Tian Y, Zou Y. Operation optimization of regional integrated energy systems[J]. Energy Science & Engineering, 2023, 11(12): 4542–4556. DOI: 10.1002/ese3.1596
[21] Tabak A, Kayabasi E, Guneser M T, Ozkaymak M. Grey wolf optimization for optimum sizing and controlling of a PV/WT/BM hybrid energy system considering TNPC, LPSP, and LCOE concepts[J]. Energy Sources, Part A: Recovery, Utilization, and Environmental Effects, 2022, 44(1): 1508–1528. DOI: 10.1080/15567036.2019.1668880
Biographies

Qiao-hua Guo, male, of Han ethnicity, born in June 1979, is a native of Linwu, Chenzhou. He is a member of the Communist Party of China, holds a master’s degree in the field of Architecture and Civil Engineering, and serves as an associate professor. Additionally, he is a National First-Class Constructor and a Supervision Engineer. Currently, he holds the position of Director of the Industry-Education-Research Collaboration Center at Chenzhou Vocational Technical College. With years of experience in the construction engineering field, he has overseen the completion of 16 engineering projects in terms of construction and management. He has led one national-level project and five provincial and ministerial-level projects. He has also authored eight research papers and holds two patents. With 20 years of teaching experience in construction engineering technology, he possesses extensive expertise in both construction engineering technology and management, as well as comprehensive knowledge of the construction industry.

Shen Bao, female, of Han ethnicity, born in January 1982, is a native of Rucheng, Chenzhou. She is a member of the Communist Party of China, holds a master’s degree in Engineering in the field of Project Management, and serves as a lecturer. Additionally, she is a National Cost Engineer and a First-Class Constructor. As a professional teacher at the School of Architectural Engineering, Chenzhou Vocational Technical College, she has participated in one national-level project and has led or contributed to six provincial and ministerial-level projects. She has also published 12 academic papers. With 19 years of teaching experience in construction engineering technology and engineering cost, she has long focused on research in construction project management and cost control. She emphasizes the integration of theory and practice and is dedicated to exploring engineering technology applications and teaching reforms.

Ke-yong Guo, male, Han nationality, born in February 1973, from Changde, Hunan, member of the Party of China, MBA postgraduate, senior accountant, professor, and national certified public accountant. He is the director of the Finance Department of Chenzhou Vocational and Technical College. He has been engaged in financial management, financial and accounting teaching, project management and cost control for more than 30 years, and has been committed to the economic research of engineering for a long time, focusing on the combination of theory and practice.

Wen Li, male, Han nationality, born in September 1979, from Chenzhou City, graduated from Hunan University, Professor, National First-Class Registered Architect, Senior Engineer. Currently, he is an Associate Professor at the School of Engineering of Chenzhou Vocational and Technical College, specializing in design and engineering for many years, hosting and participating in the completion of 35 engineering project design and management, participating in 2 provincial and ministerial projects, and publishing 3 papers. Proficient in architectural engineering technology and management, proficient in architectural design and planning.

Hua-xiang Huang, female, Han nationality, born in July 1974, from Zixing, Chenzhou, member the Communist Party of China, self-taught undergraduate in secretarial studies, associate professor, senior engineer, and second-level constructor. Currently, she is in charge of archives management at the Organization and Personnel Department of Chenzhou Vocational and Technical College, and is a teacher in the safety management technology major of the School of Engineering. She been deeply involved in the field of water conservancy and civil engineering construction at the grassroots level for many years, and has participated in the completion of several engineering construction and management projects, 4 papers. She has been teaching architectural engineering technology for 5 years and has experience in architectural engineering technology and management.
Strategic Planning for Energy and the Environment, Vol. 45_3, 615–646
doi: 10.13052/spee1048-5236.4531
© 2026 River Publishers