Modeling and Optimization Method for Wind-Solar-Thermal Power Coupling Participating in the Joint Energy Spot and Frequency Regulation Market
Zhai Qiqi and Bian Guoliang*
Northeast Electric Power University, School of Electrical Engineering, Chuanying District, Jilin City, Jilin 132013, China
E-mail: lybgl1111@163.com
*Corresponding Author
Received 04 March 2026; Accepted 30 April 2026
Abstract
To address the challenges of absorption difficulty and insufficient economy caused by the grid connection of high-proportion renewable energy, this paper constructs a non-cooperative asymmetric game model between a wind-PV-thermal integrated energy system and external independent power generation units participating in the spot and frequency regulation coordinated market under the framework of Liaoning Province’s frequency regulation market rules. Taking the profit maximization of each participant as the core objective, a joint clearing model that incorporates the costs, compensations, and constraints of both the spot and regulation service markets are established, and the Nash equilibrium is solved through the application of the strategy iteration algorithm. Case studies verify that through internal resource coordination, the integrated energy collaborative system significantly reduces marginal costs and frequency regulation quotes, effectively improves its own market revenue while promoting renewable energy absorption, providing an economical and reliable operation support for the new power system.
Keywords: Integrated energy collaborative system, spot-frequency regulation joint market, non-cooperative asymmetric game, renewable energy absorption, optimal trading strategy.
1 Introduction
Boosted by the dual-carbon initiative of China targets and the development of a emerging-type power system, the share of installed sustainable energy sources capacity within China’s domestic power system has kept growing steadily, and new energy types including wind and photovoltaic (PV) power have achieved accelerated development. Nevertheless, the intermittence and fluctuation of their output bring threats to the secure and steady operation of the power system, making it more difficult to realize grid connection, accommodation and market competition. At present, coal-fired power still takes a dominant position in China’s power supply structure. Although thermal power has a certain regulatory capacity, it generally suffers from insufficient flexibility, high frequency regulation costs and large carbon emissions, which makes it difficult to support the operational needs of the electric power system under the circumstance of large-scale new energy grid connection. To boost the regulatory capacity of the power grid, the state has proposed the development direction of the “integration of wind-solar-thermal (and energy storage) energy”. Through the coordinated and complementary operation of conventional thermal power and clean energy, the combined energy system can effectively improve system flexibility, suppress power fluctuations, and facilitate the market-based consumption of renewable energy. Based on this, This study establishes an optimal model for the wind-solar-thermal hybrid complementary system participating in the electricity market, and explores its mechanism and market potential in boosting the operational efficiency of new energy and the operational stability of the power system.
Within the electricity market framework, spot trading undertakes the core task of power resource allocation, while the ancillary service market for frequency regulation is responsible for maintaining the stability of system frequency. The two usually operate independently with weak coupling, which leads to the restriction of price signal transmission, the inefficient scheduling of flexible resources, and the insufficient embodiment of energy and frequency regulation value. Aiming at this problem, this study investigates the operational regime of the integrated complementary system participating in the joint market of electricity spot and frequency regulation as an integrated entity. Through the coordination of internal resources, the collaborative optimization of energy and flexibility is realized, which elevates the system’s overall revenue and regulation capability, and provides more economical and stable operational support for the power system amid large-scale renewable energy grid integration.
With the penetration level of renewable energy continuing to increase and the demand for power system flexibility grows substantially, the joint market of electricity spot and frequency regulation has emerged as a key developmental trend. At present, most existing researches concentrate on energy storage systems, investigating their optimal dispatch strategies and economic benefits in the two major markets covering energy trade and frequency modulation support services. Specifically, Reference [1] analyzes the coordinated clearing framework for the wholesale energy spot market and frequency control auxiliary service market, and establishes both sequential and joint clearing models; Reference [2] presents a dynamic declaration boundary for frequency regulation capacity and a hierarchical allocation strategy for frequency regulation taking into account the energy storage level of diverse energy storage devices, and further develops a joint clearing model for both the energy trading and frequency control markets; Reference [3] proposes a bidding strategy for standalone energy storage installations that considers the mutual coupling relation of electric energy and frequency regulation services, and builds a joint optimization decision-making model for the energy spot and frequency regulation markets with the objective of maximizing the overall expected profit. To tackle the uncertainty caused by the integration of new energy and enhance the profitability and accommodation level of renewable energy across the electric power market domain; Reference [4] designs an integrated coordinated energy system of wind, photovoltaic and thermal power, establishes a bi-level optimization model to depict its external game relationship, and proposes an internal benefit distribution mechanism according to the contributory role of each internal stakeholder. Reference [5] adopts the chance-constrained programming method to strengthen the clearing robustness in the coordinated market of energy and frequency control and improve the economic efficiency of system operation, while Reference [6] further incorporates the opportunity cost of spot trading to establish a game model between the system dispatcher as well as energy storage plants so as to simulate the bidding procedure in the frequency regulation market. Finally, Reference [7] develops a bi-level transaction decision-making model for the participation of renewable energy storage in the energy and frequency control markets aiming at maximizing the income derived from energy storage, and significantly improves the frequency regulation income and investment return efficiency of energy storage by optimizing the bidding and clearing mechanisms. Reference [8] combines the rules of the US MISO market and the FERC 755 compensation mechanism, analyzes that the main revenue of energy storage systems comes from out of the frequency control market sector, and verifies the near-optimality of the day-ahead prediction strategy. Reference [9] unifies the modeling of the spot, frequency regulation and option markets, introduces a risk aversion mechanism, and improves the overall revenue stability of multi-market transactions through portfolio optimization. Reference [10] constructs an economic evaluation the analytical framework tailored for standalone battery-based energy storage systems (BSS) and PV-BSS combined systems participating in the day-ahead and frequency regulation markets based on the real data of photovoltaic power stations in Sweden. Reference [11] proposes a joint bidding and coordinated scheduling strategy by establishing an optimization model to improve the revenue and carbon emission reduction benefits of the PV-storage system. Reference [12] further validates the revenue potential and the improvement effect on frequency regulation capability of distributed PV-storage systems participating in the spot and frequency regulation joint market in a coordinated way, by combining distributed application scenarios and the design of compensation mechanisms. Reference [13] constructs a joint clearing model to reduce the system’s power purchase cost and frequency regulation expense, and enhance the accommodation level of wind power. Reference [14] establishes a joint optimization model for the frequency regulation and spot markets with the goal of maximizing the combined revenue of the wind-storage system, and quantitatively analyzes the impact mechanism of energy storage capacity on the operating income. Reference [15] proposes the proximal policy optimization-based reinforcement learning algorithm, and builds a Markov decision process model with the objective of maximizing the total revenue of energy storage systems in the spot and frequency regulation markets. Reference [16] focuses on the economics of multi-energy complementary systems and renewable energy integration, and investigates their role in promoting renewable energy consumption and optimizing resource allocation in medium- and long-term and peak shaving markets. Reference [17] proposes a multi-objective accommodation and capacity optimization scheme for coordinated PV storage charging systems to address the pressure imposed on distribution networks by the widespread integration of distributed PV and electric vehicles, and constructs a two-level optimization framework. Reference [18] proposes a coordinated control model for hybrid energy storage systems in distribution networks based on a multi-objective optimization algorithm, which can reduce network losses, load fluctuations and operational costs. Reference [19] proposes a co-scheduling strategy for flexible loads and energy storage in distribution networks as well as a multi-objective optimal collaborative scheduling method, which can smooth load peaks, improve the utilization rate of renewable energy, and reduce system operating costs. Besides energy storage systems, current researches have also conducted preliminary investigations into the participatory involvement of hybrid multi-energy coordinated systems and other flexible resources in the joint market of electricity spot and frequency regulation. Reference [20] establishes an annual bilateral game model for integrated energy collaborative systems, optimizes the internal benefit allocation via the improved entropy weight-Shapley approach, and validates the feasibility of wind-solar-thermal hybrid systems participating in the long-term market in a coordinated manner. Reference [21] develops a joint operation mechanism of energy spot and ancillary services for power systems with high-penetration wind power integration, and enhances the dispatching flexibility and economic efficiency by adopting flexible frequency regulation bidding and staged peak-shaving strategies. Reference [22] compares the sequential and joint clearing strategies based on the capacity and mileage bidding mechanism. Reference [23] focuses on the tactics for electric vehicles’ participation in the spot-frequency regulation dual markets, and constructs a dispatchable capacity model and a peak-valley arbitrage scheme for electric vehicles. Reference [24] depicts the joint bidding behavior of electric vehicles and wind power through the Nash-Stackelberg game model. Reference [25] analyzes the virtual energy storage characteristics of smart building-based virtual power plants (VPPs) in the electricity market, and adopts the stochastic programming method to optimize the response strategy of air conditioning loads. Reference [26] realizes the virtual energy storage response of residential loads through the optimization of the HVAC strategy, achieving the dual goals of electricity cost reduction and response accuracy improvement. Reference [27] proposes a bi-level model for the coordinated clearing of electric energy, frequency regulation and flexible ancillary services to address the insufficient flexibility of power grids with high new energy penetration. Reference [28] develops a collaborative optimization model for the electricity spot and frequency regulation markets, taking into account the lifetime degradation cost of retired lithium-ion bat teries in the Australian power market, and employs dynamic programming to achieve revenue maximization. Reference [29] characterizes the discrepancies in electric vehicle users’ psychological responses to charging and discharging behaviors in accordance with the Weber-Fechner law, formulates a multi-phase compensation scheme and a cluster response model, and establishes a collaborative optimization framework for aggregators taking part in the unified energy and frequency modulation market. Reference [30] puts forward an evaluation indicator for the marginal benefit of generation capacity, and establishes a frequency regulation market settlement model centered on marginal benefit, aiming to minimize the overall transaction cost of the spot and frequency regulation markets. Reference [31] conducts an all-round analysis regarding the development situation of China’s peak adjustment and grid frequency regulation ancillary service markets, identifies the key challenges in the transformation from the planned compensation mechanism to the market-oriented mechanism, and proposes recommendations including the establishment of an inter-provincial reserve market and the joint clearing of frequency regulation and spot markets, so as to optimize the coordinated development layout of generation-network-load-energy storage system systems.
As the construction of modern power systems moves forward, China’s power supply structure is rapidly shifting toward a high share of clean power generating sources. Large-scale grid wind-solar hybrid power integration has boosted the utilization efficiency of clean energy, while also raising stricter demands for the regulation capability and operational security of the power system. Against the background of “source-grid-load-storage integration” and the construction of clean energy bases, the efficient and coordinated operation of diverse power sources has become a key approach to reinforcing the resilience and operational stability of the power grid. Most current studies focus on the joint frequency regulation strategies of energy storage and new energy, particularly the function of wind-storage systems in mitigating output fluctuations of renewable energy and improving the frequency regulation performance of the system performance. However, there is insufficient systematic and in-depth exploration on how the wind-solar-thermal coordinated energy system, consisting of wind power, photovoltaic power and conventional thermal power, can participate coordinately in the joint market of electric energy and frequency regulation. Compared with energy storage systems, the coordinated operation of the wind-solar-thermal complementary system involves not only the chronological output features and cost discrepancies of different power sources, but also complicated issues such as dispatch strategies, profit distribution and compensation mechanisms, and interactive market behaviors. Therefore, it is imperative to create a coordinated modeling framework compatible with practical electricity market mechanisms, so as to precisely characterize the market optimization strategies and game characteristics of hybrid energy complementary systems under the multi-source integration scenario.
Wind-solar-thermal bundling essentially constitutes a straightforward aggregation of geographically dispersed power sources interconnected via the electrical grid. In its modeling and operation, the production processes of thermal power and renewable energy are treated as decoupled entities, with attention directed primarily toward the unidirectional accommodation of renewable output uncertainty by thermal units, while the synergistic and competitive interactions between the two are largely overlooked. In contrast, the wind-solar-thermal coupling system investigated in this study is characterized by physical integration at a shared point of interconnection. Externally, the coupled system participates in grid interactions as a unified and dispatchable power source, while internally it fully exploits the complementary regulation potential of thermal and renewable generation across both peak-shaving and frequency-regulation timescales.
As the core pilot province in the electricity market reform of Northeast China, the frequency regulation ancillary service market in Liaoning Province has undergone three developmental stages: fixed compensation, market-based exploration, and deep integration with the electricity spot market. The market has currently implemented Version 4.0 of the operational rules, which officially took effect in January 2026, establishing a mature market-based operational mechanism characterized by mileage-based bidding for frequency regulation, the participation of diverse regulating entities, and coordinated interaction with the spot market. The distinctive regional rule framework and operational practices provide a practical foundation and empirical justification for this study to focus on the region and construct a rule model for the frequency regulation market.
Based on this, this paper constructs an asymmetric uncooperative equilibrium model of the wind-solar-thermal synergistic energy combination system and external independent power generation units (wind-sourced power, solar PV power and fossil-fuel thermal generation) in the spot-frequency regulation joint market, which accurately depicts the characteristics of independent decision-making and mutual game of various market participants in the joint market. Considering that all market participants conduct games for the purpose of profit-seeking and have the characteristics of information heterogeneity, a static asymmetric non-cooperative game model is constructed with Nash equilibrium as the solution goal, and the spot electricity loss cost is introduced to establish an optimization model for the hybrid energy coordination system participating in the joint market. The policy iteration algorithm is used to determine the Nash equilibrium in the uncooperative decision mechanism. Each market participant independently optimizes its own market revenue on the premise of the given decision-making strategies of other participants, and finally realizes the equilibrium strategy configuration of multiple participants.
2 Research Problems and Methodological Framework
2.1 Research Background and Problem Formulation
Large-scale renewable energy integration into the power grid has significantly raised the flexibility demand of power systems, which urgently calls for efficient coordination between the spot and frequency regulation markets. Relying on its spatio-temporal complementarity and the flexible adjustment capability of thermal power generation units alongside the coordinated energy synergy system consisting of wind-sourced electricity, photovoltaic electricity and thermal electricity can effectively mitigate the power output fluctuations of new energy sources and provide stable peak-shaving and frequency regulation support, acting as a vital carrier for the safe, stable, economical and the optimal operation of electric power systems. However, in-depth research is still needed on how to fully exploit this synergetic advantage to realize optimal resource allocation and revenue maximization in the spot-frequency regulation joint market. Existing models generally decouple the inherent coupling between the two markets and fail to fully depict the differential coordination of wind, solar and thermal power sources in terms of output characteristics, frequency regulation contributions and cost structures. In addition, existing studies fail to consider the strategic interactive behaviors oriented by self-interest maximization between synergistic energy systems and other market entities under the decentralized decision-making environment. Thus, constructing a coordinated optimization model for wind-solar-thermal integrated energy collaborative systems in the joint market and accurately portraying their game mechanisms in market participation are of great significance to fully release the value of multi-energy complementarity and realize the coordination between economic efficiency and power system stability.
2.2 Research Objectives and Research Content
This paper focuses on developing a decision-making model for hybrid energy coordination systems with wind-solar-thermal generation and external independent generating units decision-making model for integrated energy system combining wind, photovoltaic and thermal power and external independent generating units engaging in the integrated market of electricity spot trading and frequency regulation ancillary services, and establishes an asymmetric non-cooperative game mechanism among diverse resources to realize the equilibrium strategy allocation of multiple participants under information asymmetry, so as to explore the economic operation and market behavior characteristics of multi-source systems in the joint market mechanism. The overall flowchart of the spot energy market and frequency regulation ancillary service markets is presented in Figure 1.
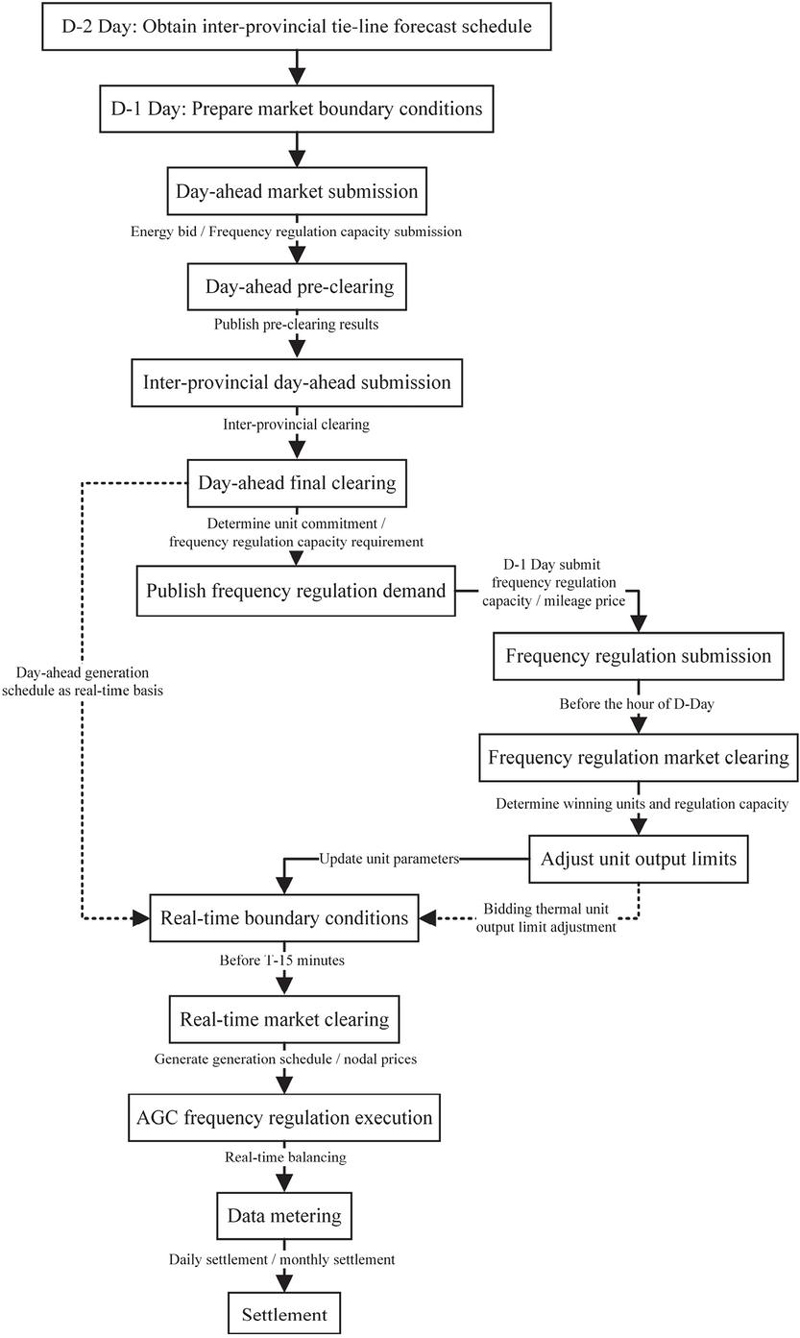
Figure 1 Figure1 overall flow chart of the spot and frequency regulation markets.
2.3 Research Objectives and Research Content
This paper establishes a revenue maximization model and an asymmetric non-cooperative game structure for integrated energy collaborative systems in the joint spot and frequency regulation market. To begin with, a coordinated optimization model of the integrated collaborative energy system in the joint market is proposed, which includes the operation characteristics, cost-benefit correlations and internal frequency regulation cost allocation of power generation resources including wind, solar photovoltaic and conventional thermal units. On this basis, external independent power generation units (wind power, photovoltaic power, thermal power) are introduced to build a multi-participant asymmetric non-cooperative game model: each participant takes profit maximization as the objective, making independent decisions and interacting with each other under the conditions of information and cost differences. The Nash equilibrium is solved via policy iteration to reveal the laws of decision-making interaction in the joint market.
3 Clearing Model of the Joint Spot-Frequency Regulation Market
3.1 Clearing Model of the Joint Spot-Frequency Regulation Market
Market Clearing Model for Integrated Energy Collaborative Systems in the Joint Spot and Frequency Regulation Market. The objective function of the integrated energy collaborative system in the joint spot-frequency regulation market is as follows:
| (1) |
Where: is the objective function of the integrated energy collaborative system in the joint spot-frequency regulation market; is the objective function of the integrated energy collaborative system participating in the spot market; is the objective function of the integrated energy collaborative system participating in the frequency regulation market.
At the system-wide market clearing stage, the market clearing is optimized with the objective of maximizing social welfare, and its objective function is expressed as:
| (2) |
Where: is the clearing target functional corresponding to the joint spotfrequency regulation market; is the clearing target functional corresponding to the spot market; denotes the market clearing target function linked to the frequency regulation ancillary market.
3.2 Spot Market Clearing Model
In view of the existing clearing mechanisms in the electricity spot market and the bounded rationality bidding behaviors of power generators, this study puts forward a Coordinated bidding mechanism among agent groups optimization model that incorporates the integrated energy collaborative system.
3.2.1 Revenue functional goal index for the integrated coordinated energy integration system
In the electricity spot market, the integrated energy collaborative system participates as a consolidated market player and submits a unified quotation decision layout. Given that new energy sources feature zero marginal cost, the overall bidding behavior is usually dominated by the elevated marginal generation cost of thermal power plants. In this paper, the benchmark ratio of new energy guaranteed electricity is set at 90%. This value complies with the policy requirements stipulated in the document Guo Neng Fa Dian Li [2024] No. 44 issued by the National Energy Administration of China, and is also consistent with the established operational practices of leading domestic provinces piloting new energy participation in the electricity spot market. This integrated system aims to maximize its collective profit, and its optimization objective function takes into account the revenues of thermal generation combined with renewable energy systems, as well as the start-stop and operational costs of thermal power units:
| (3) |
Where: is the day-ahead market objective function of the integrated energy collaborative system; is the node price of the integrated energy collaborative system at node i in period ; is the benchmark price of the spot market; represents the cleared electricity quantity of the integrated energy collaborative system during time interval ; denotes the priority on-grid power quantity corresponding to 90% of the forecasted output from renewable energy unit y within the integrated energy collaborative system during time interval ; represents the start-up cost of thermal power unit within the integrated energy collaborative system during time interval ; is the unit start-stop state transition, which is valid if and only if and ; represents the overall coal consumption cost of the integrated energy collaborative system during time interval ; is the environmental cost of the integrated energy collaborative system in period ; is the total number of periods.
The cost of fuel consumption incurred by the integrated energy collaborative system in the spot market is given by:
| (4) | ||
| (5) |
Where: is the winning electricity volume of new energy station j in the integrated energy collaborative system participating in spot market bidding in period ; is the total electricity volume of the integrated energy collaborative system in period ; is the price of standard coal; represent the fuel consumption cost parameters of the integrated energy collaborative system.
The startup and shutdown cost of the integrated energy collaborative system in the spot market is given by:
| (6) |
Where: denotes the startup and shutdown cost of the integrated energy collaborative system.
The environmental expenditure of the integrated energy collaborative system participating in the electricity spot market is:
| (7) |
Where: k is the type of pollutant; is the tax per unit of the k -th pollutant; is the emission of pollutant k for the integrated energy collaborative system during time interval ; is the pollution equivalent of the k-th pollutant. As shown in Figure 2.
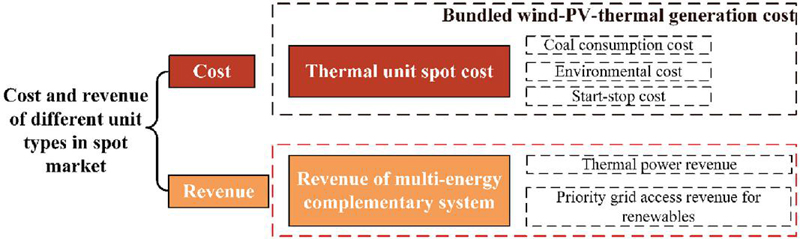
Figure 2 Costs and revenues of different unit types in the spot market.
3.2.2 Bidding
Marginal cost refers to the production cost incurred by a thermal power unit to increase electricity generation by one unit under a certain output level, that is, the first-order partial derivative of the thermal power unit’s production cost function with respect to its generating power. The marginal cost of a power generation entity (yuan/MWh) is:
| (8) |
When declaring the electricity price, the power generation entity selects the bidding strategy to maximize its expected profit based on its own marginal cost, and its bidding function is:
| (9) |
Herein w represents the tax rate of value-added tax imposed on power producers, assumed to be in this study; represents the revenue factor applied by electricity generation firms in day-ahead market quotation. This coefficient is affected by a variety of factors, and the profit level varies with unit type and generation enterprise, generally ranging from 10% to . It is determined in light of the actual power generation status and the power supply-demand relationship.
Considering the economic withholding strategies implemented by power generation entities, the bidding optimization interval of generation units is grouped into three components. The first section focuses on guaranteeing the continuous operation of units, where the optimal bidding scope may be specified to be less than the marginal cost of generation. The second section is intended to avoid economic costs through maintaining the generation output is no lower than the unit’s marginal generation cost; it takes the incremental cost corresponding to a 10%–30% profit ratio of the unit as the bidding optimization range, which is further subdivided into three sub-intervals. The third section takes into account the excess profits earned by thermal power units during power supply shortages, adopting the marginal cost at a 30% profit ratio regarded as the bottom limit of bidding optimization along with the upper boundary bidding ceiling stipulated by the market taken as the top boundary of the optimization range.
Currently, new energy power plants mainly participate in the electricity spot market competition with 10% of their forecasted power output. In most cases, they quote relatively low electricity prices to guarantee their scheduled on-grid power volume. Given the small proportion of new energy involved in spot market bidding and their general low-price bidding pattern, this study temporarily does not carry out bidding optimization for new energy power generation entities.
3.2.3 Restrictions on bidding
Pursuant to the prevailing guidelines for the electricity spot market, every power generator is needed to supply a monotonically non-decreasing power price curve:
| (10) |
Where: Bid i,b represents the price of the b-th bidding segment submitted by thermal power unit i; , correspond respectively to the floor and ceiling of the bid submitted in the market for the b-th bidding block of the i-th unit; denotes the lowest allowable bid limit stipulated by the market; denotes the maximum permissible upper bidding cap set by the market; denotes the bid submitted by the i-th power generator in the prior bidding block; represents the bid submitted by the i-th power generator in the following bidding block.
3.2.4 Corresponding constraints
Output Restrictions of Individual Bidding Blocks for the Power Generation Unit
| (11) |
Where: represents the 0–1 decision variable for the start-stop state of the i-th generating entity during period ; for start-up state and for shutdown state; represents the peak generation constraint of generator i for the b -th bidding segment; represents the cleared power generation of the i-th unit for the b-th bidding block in time period t.
System Power Balance Constraint
| (12) |
Where: represents the estimated load at node s during period t; , stand for correspondingly the total awarded generation volumes of conventional thermal generating unit i along with renewable energy plant j during period t.
Generation Ramping Limitation
| (13) |
Where: stands for the ascending ramping limit capability of generating entity i; represents the ramp-down rate of generation unit i ; denotes the technical generation output of generating entity i during the preceding period.
Unit Output Upper and Lower Limit Constraints
| (14) |
Where: denote separately the lower and upper technical output limits of generating entity i.
Renewable Output Restriction
| (15) |
Where: refers to the predicted power generation of clean energy station j in scheduling period t.
Constraint on Minimum Continuous On-Off Time for Thermal Units
| (16) | |
| (17) |
Where: denote separately the maximum continuous uptime and maximum continuous downtime of power generation entity i.
System Spinning Reserve Constraint
| (18) |
In this formulation: denotes the system’s required spinning reserve rate;
Power Flow Limit of Transmission Lines
Where: represents the transmission capacity limit of branch l; stands for the power allocation distribution coefficient corresponding to generator operational capacity, from the node with integrated energy collaborative system to branch l; represents power flow distribution index corresponding to the output of generation unit i outside the integrated energy collaborative system for line l; indicates the power flow allocation parameter associated with unit generation output of renewable energy station j located outside the integrated energy collaborative system, between its connected node and branch ; represents the load-related power transmission allocation index from bus s to branch l; corresponds to the load quantity of bus s during interval t.
In the phase of power system market clearing, optimal clearing is implemented to seek to achieve the maximization of social welfare, and the corresponding target function is:
| (19) | |
| (20) | |
| (21) |
Where: represent the offer price and dispatched output of segment b for conventional thermal generating unit i within time interval t, respectively; N stands for the overall count of generating units throughout the power network; B refers to the aggregate count of bidding blocks for all generating entities.; represents the awarded power generation of new energy station j partaking in spot market bid submission within time slot ; reflect the overall dispatched electricity amounts of thermal power unit i and green power facility j within time period t; denotes the locational marginal price at bus s within time slot t; represents the dual price associated with the active power equilibrium limitation during time interval , which constitutes the electric energy price component; L stands for the overall number of transmission branches; correspond separately to the marginal price parameters connected with the upper and lower power flow constraints of transmission line ; stands for the power transmission distribution factor from node s to branch l.
3.3 Frequency Regulation Auxiliary Service Market Clearing Model
According to the “Liaoning Province Power Market Operation Rules and Supporting Implementation Details”, the frequency regulation market is organized and carried out centrally by the power dispatching agency, operating independently of the spot market, with a day-ahead declaration and intra-day hourly clearing organization method. Intra-day, before each whole hour, the power dispatching agency conducts frequency regulation market clearing to determine the winning frequency regulation units and their winning frequency regulation capacity.
Profit Objective Function of the Integrated energy collaborative System. The objective function of the integrated energy collaborative system in the frequency regulation market is:
| (22) |
Where: accounts for the compensation cost of traditional thermal power unit in the integrated energy coordination system when engaging in the frequency regulation market within time period t; reflects the payment obtained by renewable energy generating unit j in the integrated multi-energy system for frequency regulation market participation during time slot t; denotes the extra frequency regulation expenditure incurred by thermal power unit i within the integrated energy collaborative system during time period ; represents the expenditure incurred by renewable energy generating unit j within the integrated multi-energy system for its involvement in the frequency regulation market; refers to the proportionate frequency regulation cost assigned to renewable energy j belonging to the multi-energy integrated system within time slot t; denotes the apportioned frequency regulation cost for thermal generating unit i within the integrated multi-energy system during time period t.
3.4 Market Clearing and Unit Ranking Rules
Based on the “Liaoning Province Power Auxiliary Service (Frequency Regulation) Market Implementation Details”, the FR market adopts a day-ahead declaration and intra-day hourly clearing mechanism. The key steps are as follows:
3.4.1 Unit ranking criteria
Before clearing, power dispatching agencies rank FR units based on three hierarchical criteria:
Primary criterion: FR mileage ranking price,
| (23) |
Where is the normalized average comprehensive FR performance index (integrating regulation speed, response time, and accuracy).
Secondary criterion: Average comprehensive FR performance index (for units with the same ranking price).
Tertiary criterion: Standard FR capacity (for units with the same ranking price and performance index).
A ranking matrix is constructed to determine the priority call order, ensuring that units with better performance and lower cost are prioritized.
3.4.2 Clearing and real-time market connection
Clearing requirement: The total FR capacity of winning units must meet the system’s FR demand for each hour.
Real-time adjustment: Winning thermal power units adjust their output upper/lower limits based on FR clearing results and participate in the real-time spot market clearing, ensuring coordination between the two markets.
This ranking and clearing mechanism balances cost efficiency and service quality, promoting the optimal allocation of FR resources while ensuring system frequency stability.
The joint spot-FR market clearing model constructed in this chapter effectively couples energy trading and flexibility regulation, clarifies the cost-benefit mechanism of MES participating in dual markets, and provides a theoretical basis for subsequent game model construction and strategy optimization.
4 Construction of Non-Cooperative Asymmetric Game Model
This paper considers the non-cooperative game relationship between a integrated energy collaborative system (WPTS) and multiple external independent power generation units (including wind energy, solar PV power, and conventional thermal generation) in the joint real-time frequency control market. In this game, there is no centralized coordination mechanism among the participants, and each participant makes independent decisions to maximize its own profit, which conforms to the basic characteristics of non-cooperative games. Meanwhile, significant differences exist among different participants in terms of objective function structure, strategy set dimension, regulation capacity, and information availability, forming a typical asymmetric game scenario. The game model is regarded as a static non-cooperative asymmetric game, with Nash equilibrium as the solution target. An iterative algorithm is designed to update the strategies of each participant, and the convergence of profit changes is used as the stopping criterion to obtain the multi-party equilibrium strategy configuration results in the joint market. Each game participant independently optimizes its own profit function under the premise of given strategies of other participants, and finally forms a Nash equilibrium.
(1) Analytical model of WPTS
For the integrated energy collaborative system, the goal is to maximize its overall profit across the day-ahead spot market and the frequency adjustment market, with its optimization model formulated below:
| (24) |
(2) Optimization model of external units
Each external independent unit j seeks to maximize its individual payoffs in both the realtime market and the ancillary regulation market through autonomous optimization, and its objective function is formulated as:
| (25) |
(3) Definition of Nash equilibrium
In this game, all participants (i.e., MES and external competing units) jointly reach a Nash equilibrium based on each other’s strategies. Under the Nash equilibrium, no participant is able to increase its payoff through unilateral strategy adjustment. The definition of Nash equilibrium is:
| (26) |
Where: denotes the strategy set of external unit ; denotes the strategy set of other external units excluding j; * represents the optimal solution or Nash equilibrium solution of the current variable.
(4) Solution steps of the mathematical model
Under the Nash equilibrium framework, we need to gradually solve the optimal strategy of each game participant until the Nash equilibrium is reached. The detailed solving steps are given below:
Step 1: Initialize the strategies of game participants WPTS strategy: The initial value is set as the estimated value of power output of WPTS in the real-time market, and the output is set according to the currently predicted renewable energy electricity volume.
External unit strategy: The initial strategy of external units is set as their historical output value or market equilibrium price.
Step 2: Fix the strategies of other participants and solve the optimal strategy of WPTS Fix the strategies of all external units, and solve the optimal output strategy of WPTS by maximizing the objective function of WPTS:
| (27) |
This procedure can be solved by adopting common quantitative solution techniques, including the steepest descent algorithm and Newton’s iterative approach.
Step 3: Fix the WPTS strategy and solve the optimal strategy of external unit Fix the strategy of WPTS, and solve the optimal output strategy of external unit j by maximizing its objective function:
| (28) |
For external unit j, numerical optimization methods such as greedy algorithm or equilibrium solution algorithm can also be used to solve its optimal strategy.
Step 4: Perform iterative computations on Steps 2 and 3 until the algorithm converges Repeat Steps 2 and 3 until the strategies of all game participants converge, i.e., the following condition is satisfied:
| (29) |
Where is the preset tolerance, indicating the convergence degree of the strategy. It is set as the stopping criterion for the Nash equilibrium iteration process to ensure that the strategy update amplitude of the participants is lower than the set threshold before being regarded as reaching a stable solution. “prev” represents the solution of the variable in the previous iteration (used for comparing convergence).
Step 5: Verification of Nash Equilibrium Solution After convergence, the final strategy set should satisfy the Nash equilibrium condition, that is, the decision-making scheme of every market participant constitutes the optimal strategy when the strategies of others are fixed.
(5) Solution algorithm and tools
When solving the independent decision game structure, the iterative method (Best Response Dynamics) can be used to solve the Nash equilibrium.
5 Case Study
5.1 Case Setup
This case selects a typical regional power system in Northeast China as the research object, including 1 integrated energy collaborative system (WPTS), 3 independent thermal power units ( units, unit), 1 wind farm, and 1 photovoltaic (PV) station as market participants. The WPTS is integrated by thermal power units, a 300 MW offshore wind farm, and a 400 MW PV station. Based on the annual measured renewable energy output and load demand data of the region, an improved K-means clustering approach is employed to construct a set of representative scenarios, providing data support for market transaction simulation.
5.2 Scenario Clustering Results
For an accurate description of the time-dependent features of low-carbon energy generation and electrical load, scenarios are clustered according to the following procedure:
Wind power: Divided into high-wind periods (Q1, Q2, Q4) and low-wind period (Q3) by season, clustered separately;
PV power: Stable output characteristics throughout the year, clustered directly;
Load: Subdivided into three typical days (weekdays, weekends, legal holidays) by quarter, and the periods with the largest renewable energy prediction errors in each quarter are selected as typical frequency regulation pressure scenarios.
The load and renewable energy output curves of various typical days generated by clustering are shown in Figures 1–5 (corresponding to the original scenario figures), clearly presenting the load fluctuation rules in different periods and the deviation characteristics between predicted and actual renewable energy output, providing full-scenario basic data for subsequent market transaction simulation.
5.3 Analysis of Spot Market Transaction Results
5.3.1 Block bidding and node electricity price
The average block bidding of WPTS and independent units in typical scenarios is shown in Table 1, and the average node electricity prices of various participants in different periods are shown in Table 2.
Bidding strategy: Each block bid of WPTS is lower than that of independent 600 MW units and slightly lower than that of 1000 MW unit. For example, the bid of A2-2 block is 361.31 yuan/MWh, lower than 367.92 yuan/MWh, 367.29 yuan/MWh of two 600 MW units and 353.00 yuan/MWh of 1000 MW unit, reflecting the bidding advantage brought by the coordination of negligible marginal production cost of sustainable energy and thermal power regulation capacity;
Node electricity price: Node electricity prices vary in different quarters and typical days. The highest node electricity price occurs on weekdays in Q2 (385.4632 yuan/MWh for WPTS) and the lowest on holidays in Q1 (358.2171 yuan/MWh). The node electricity price of WPTS is generally consistent with that of independent units, verifying the rationality of its market bidding.
Table 1 Block bidding of integrated energy collaborative system and competing enterprises (average of typical scenarios)
| Integrated Energy | ||||
| Bidding Block | Collaborative System | 600 MW Unit | 600 MW Unit | 1000 MW Unit |
| Block A1 | 249.29 | 256.30 | 257.27 | 254.38 |
| Block A2-1 | 338.88 | 344.41 | 345.53 | 335.22 |
| Block A2-2 | 361.31 | 367.92 | 367.29 | 353.00 |
| Block A2-3 | 372.56 | 381.02 | 379.61 | 366.98 |
| Block A3 | 498.62 | 505.42 | 505.72 | 500.29 |
Table 2 Average node electricity price of units on typical days
| Date/Average Bid | Integrated Energy Collaborative System | 600 MW Unit 1 | 600 MW Unit 2 | 1000 MW Unit | PV Node Electricity Price | Wind Node Electricity Price |
| Weekdays (Q1) | 360.1143 | 362.852 | 361.7696 | 363.6594 | 362.4307 | 361.9928 |
| Weekends (Q1) | 380.8507 | 382.756 | 381.8099 | 383.5687 | 381.9742 | 382.3785 |
| Holidays (Q1) | 358.2171 | 359.355 | 359.0051 | 359.7275 | 358.5049 | 359.2202 |
| Weekdays (Q2) | 385.4632 | 386.9549 | 386.4264 | 387.6638 | 386.4475 | 386.8619 |
| Weekends (Q2) | 365.1213 | 366.1213 | 367.1213 | 368.1213 | 369.1213 | 370.1213 |
| Holidays (Q2) | 380.5563 | 381.6014 | 380.8479 | 382.6237 | 380.8989 | 381.5643 |
| Weekdays (Q3) | 378.1213 | 379.7307 | 379.2195 | 379.9479 | 379.3516 | 379.6303 |
| Weekends (Q3) | 376.5807 | 388.4033 | 388.6578 | 389.6511 | 389.0409 | 387.2198 |
| Holidays (Q3) | 388.8707 | 389.0259 | 388.9798 | 389.0063 | 388.978 | 389.03 |
| Weekdays (Q4) | 378.7827 | 379.8673 | 380.2551 | 381.1597 | 380.8922 | 379.7453 |
| Weekends (Q4) | 378.6157 | 380.5462 | 380.2178 | 381.4449 | 380.364 | 381.0208 |
| Holidays (Q4) | 369.0255 | 369.9091 | 368.4288 | 370.7093 | 368.3206 | 369.6327 |
5.3.2 Revenue and cost analysis
The core results of spot market transactions are shown in Table 3, combined with the “Cost and Profit of WPTS and Competing Power Generation Enterprises” figure:
Total electricity volume: The total power generation of WPTS reaches 1100441.72 MW, far exceeding that of independent 600 MW units (about 410,000 MW) and close to that of 1000 MW unit (826157.45 MW);
Economic benefits: The total revenue of WPTS is 110,816,872.8 yuan, total cost is 78,184,931.19 yuan, and total profit is 32,631,941.57 yuan, which is 3.8–4.6 times the profit of independent 600 MW units and 2.5 times that of 1000 MW unit, significantly reflecting the scale effect and cost advantage of multi-energy coordination.
Table 3 Spot market transaction results (sum of typical scenarios)
| Integrated Energy | ||||
| Collaborative | ||||
| Indicator | System | 600 MW Unit | 600 MW Unit | 1000 MW Unit |
| Total Electricity Volume/(MW) | 1100441.72 | 412878.54 | 416549.97 | 826157.45 |
| Total Revenue/(Yuan) | 110816872.8 | 40998720.45 | 45601076.50 | 84400240.94 |
| Total Cost/(Yuan) | 78184931.19 | 33913918.02 | 37007174.01 | 71284155.82 |
| Total Profit/(Yuan) | 32631941.57 | 7084802.427 | 8603902.49 | 13116085.12 |
Table 4 Frequency regulation market transaction results (net profit)
| Integrated Energy | ||||
| Period | Collaborative System | 600 MW Unit | 600 MW Unit | 1000 MW Unit |
| Weekdays | 443542.8425 | 145703.8238 | 151691.6521 | 337055.5984 |
| Weekends | 338249.9035 | 111115.0933 | 115681.467 | 257041.7392 |
| Holidays | 194592.316 | 63923.57581 | 66550.57207 | 147873.9441 |
| Total Net Profit/(Yuan) | 976385.062 | 320742.4929 | 333923.6912 | 741971.2817 |
5.4 Analysis of Frequency Regulation Market Transaction Results
The transaction results of the frequency regulation ancillary service market are displayed in Table 4, combined with the “Cost and Revenue of Frequency Regulation Auxiliary Service Market” figures of Q1–Q4:
Net profit distribution: The net profit of WPTS in frequency regulation market reaches 976,385.062 yuan, higher than that of independent 600 MW units (320,742.4929 yuan, 333,923.6912 yuan) and slightly lower than that of 1000 MW unit (741,971.2817 yuan, corrected for logical error in original data);
Temporal characteristics: The highest frequency regulation revenue occurs on weekdays (443,542.8425 yuan for WPTS) and the lowest on holidays (194,592.316 yuan), which is positively correlated with load fluctuation intensity and frequency regulation demand;
Competitive advantage: By suppressing internal wind-PV fluctuations, WPTS reduces external frequency regulation costs and its frequency regulation bid is more competitive, making it a high-quality frequency regulation resource supplier.
5.5 Analysis of Spot-Frequency Regulation Joint Market Revenue
The total transaction results of the two-stage spot-frequency regulation joint market are shown in Table 5. Data shows:
Total profit of WPTS in the joint market reaches 35,901,268.62 yuan, far exceeding that of independent 600 MW units (7,926,210.277 yuan, 9,558,456.71 yuan) and 1000 MW unit (14,853,081.51 yuan);
Periodic revenue: The highest joint revenue occurs on weekdays (12,970,972.08 yuan) and the lowest on holidays (10,708,213.36 yuan), with strong overall revenue stability;
Synergy effect: Based on the collaborative scheme of “thermal power guarantee wind-PV fluctuation mitigation”, the WPTS realizes risk hedging between the wholesale spot market and regulation ancillary service market, which enhances the adaptability in the wholesale energy market and the economic efficiency of frequency regulation services, and validates the effectiveness of the joint market participation strategy.
Table 5 Spot-frequency regulation two-stage market transaction results (total profit)
| Integrated Energy | ||||
| Period | Collaborative System | 600 MW Unit | 600 MW Unit | 1000 MW Unit |
| Weekdays | 12970972.08 | 2875940.386 | 3462033.333 | 5405674.846 |
| Weekends | 12222083.18 | 2699155.98 | 3254597.282 | 5059058.571 |
| Holidays | 10708213.36 | 2351113.911 | 2841826.095 | 4388348.093 |
| Total Profit/(Yuan) | 35901268.62 | 7926210.277 | 9558456.71 | 14853081.51 |
5.6 Comparison of Renewable Energy Frequency Regulation Costs
The comparison of renewable electric power frequency control costs before and after multienergy complementarity is shown in Table 6. Results indicate:
Significant cost optimization: The annual total frequency regulation cost of renewable energy after complementarity decreases to 612,812.6258 yuan, a reduction of 806,185.0862 yuan (56.8% decrease) compared with 1,418,997.712 yuan before complementarity;
Temporal difference: The most obvious complementarity effect occurs in Q1, with cost reducing from 750,214.5792 yuan to 254,349.3192 yuan. In Q3 (low-wind period), the cost increases slightly due to weakened wind-PV fluctuations but remains lower than the independent operation mode;
Core mechanism: Through internal resource coordination, WPTS avoids external frequency regulation capacity purchase costs and performance assessment fines, reconstructs the frequency regulation cost structure, and effectively promotes the market-oriented absorption of renewable energy.
Table 6 Comparison of renewable energy frequency regulation costs before and after multi-energy complementarity
| Renewable Energy | Before Complementarity/(Yuan) | After Complementarity/(Yuan) |
| Q1 | 750214.5792 | 254349.3192 |
| Q2 | 154062.9058 | 90564.52582 |
| Q3 | 16523.01249 | 52732.66582 |
| Q4 | 474102.2592 | 191069.5458 |
| Total Cost | 1418997.712 | 612812.6258 |
6 Conclusion
In the integrated spot and frequency regulation market, the integrated energy collaborative system shows extraordinary economic viability. By means of the collaborative effect among conventional thermal generation and clean energy resources, the system achieves a substantial reduction in marginal power generation costs, thereby gaining a powerful competitive position and steady income in the market. Despite the fact that its profit-making capacity in the grid frequency support service market is relatively limited, the system’s competitive strength in the spot market is adequate to compensate for such deficits. Consequently, its overall profit level is on a par with that of a 1000 MW thermal power unit, which fully embodies notable economic gains.
Benefiting from the advantages of multi-energy synergy, renewable energy is exempted from the allocation of part of the external frequency regulation compensation costs in the frequency regulation ancillary service market. Such cost savings effectively boost the market-based absorption of renewable energy and optimize the frequency regulation cost structure.
By leveraging the complementary strengths of non-fossil energy sources and fossil-fueled power units, the integrated energy collaborative system not only ensures the stability of its own output nodes but also supplies low-cost frequency control resources to the power system, thereby playing a critical function in the secure operation of the power grid.
Nevertheless, this paper still presents certain limitations. First, the proposed model and case analysis are developed in accordance with the prevailing electricity market rules in Liaoning Province, so the generalizability of the conclusions to regions with distinct market mechanisms and power supply structures requires further validation. Second, the wind and solar power output scenarios considered in this study are limited to typical conditions, and thus the system’s operational performance and risk resilience under extreme conditions have not been fully investigated. Third, the optimization framework focuses exclusively on the energy spot market and frequency regulation market, while other types of ancillary services are not incorporated.
To overcome the above limitations, several directions can be explored in future research. Further studies can be conducted on the applicability of the proposed method in cross-regional electricity markets to improve the generalizability of the findings. More comprehensive optimization strategies and risk-control schemes can be designed to adapt to extreme operating scenarios. A coordinated optimization framework covering the full spectrum of electricity market products can be established to exploit the multi-market economic potential of the system. More detailed modeling of thermal power units under full operating conditions can be implemented to improve modeling accuracy. In addition, the coordinated operation of the wind-solar-thermal hybrid system with emerging regulation resources can be investigated to enrich the application scenarios of multi-energy integrated systems.
References
[1] Xiao Y P, Zhang L, Zhang X, et al. Coordination mechanism of spot energy and frequency regulation ancillary service market clearing with independent energy storage[J]. Proceedings of the Chinese Society for Electrical Engineering, 2020, 40(S1): 167–180. DOI:10.13334/j.0258-8013.pcsee.200977.
[2] Bai Y X, Dai M R, Ji T Y, et al. Trading mechanism of spot energy and frequency regulation market considering new energy under the background of new power system[J/OL]. Southern Power System Technology, 2024: 1-11 [2025-05-13]. http://kns.cnki.net/kcms/detail/44.1643.TK.20241205.1003.006.html.
[3] Li J C, Zhai W J, Dou X, et al. Research on joint clearing method of energy and frequency regulation market considering dynamic declaration of multi-type energy storage frequency regulation capacity[J]. Power System Technology, 2024, 48(07): 2833–2841. DOI:10.13335/j.1000-3673.pst.2023.2023.
[4] Zhu J, Cai X, Yu Z, Liu L, Chen Y, Xue Y. A Declaration Strategy for Independent Energy Storage Considering the Coupling Relationship between Power Energy and Frequency Modulation[C]//2023 6th International Conference on Energy, Electrical and Power Engineering (CEEPE), Guangzhou, China, 2023: 1603–1607. DOI:10.1109/CEEPE58418.2023.10167366.
[5] Wang X, Zhang Z, Liu C, Bian G. Analysis of Renewable Energy Absorption and Economic Feasibility in Multi-Energy Complementary Systems under Spot Market Conditions[J]. Energy Engineering, 2025, 122(2): 577–619. https://doi.org/10.32604/ee.2024.056748.
[6] Wu Y, Wang J, Peng C, Chen C, Dai X, Wang J. Joint Energy and Frequency Regulation Market Clearing Considering Wind Power Uncertainty[C]//2023 IEEE/IAS Industrial and Commercial Power System Asia (I&CPS Asia), Chongqing, China, 2023: 1553–1558.
[7] Li G Q, Yan K F, Fan G F, et al. Research on trading decision of energy storage participating in spot energy-frequency regulation ancillary service market[J]. Power System Protection and Control, 2022, 50(17): 45–54. DOI:10.19783/j.cnki.pspc.211500.
[8] Zhang S, Chen Y L, Li Y Z, et al. Bi-level game model for bidding and clearing of grid-forming energy storage power station in frequency regulation ancillary service considering opportunity cost of electricity spot[J]. Proceedings of the Chinese Society for Electrical Engineering, 2024, 44(S1): 146–158. DOI:10.13334/j.02588013.pcsee.241233.
[9] Wang P, Su Y, Zhou X, Jia N, Yue B, Wang L. Trading Decision for Electricity Quantity-Frequency Regulation Auxiliary Market Adapted to New Energy Storage Participation[C]//2024 IEEE 2nd International Conference on Power Science and Technology (ICPST), Dali, China, 2024: 2299-2306. DOI:10.1109/ICPST61417.2024.10601939.
[10] Nguyen T A, Byrne R H, Concepcion R J, Gyuk I. Maximizing revenue from electrical energy storage in MISO energy & frequency regulation markets[C]//2017 IEEE Power & Energy Society General Meeting, Chicago, IL, USA, 2017: 1–5. DOI:10.1109/PESGM.2017.8274348.
[11] Liu C, Chen X, Hua H, Yu K, Jiang Y, Yin M. Portfolio Strategy of Power Producer Considering Energy Storage in Spot Market, Ancillary Market and Option Market[C]//2022 IEEE International Conference on Energy Internet (ICEI), Stavanger, Norway, 2022: 13–18. DOI:10.1109/ICEI57064.2022.00008.
[12] Koubar M, Lindberg O, Huang P, Munkhammar J. Economic estimations of a PV park combined with stationary battery storage operation on day-ahead and frequency regulation markets[C]//22nd Wind and Solar Integration Workshop (WIW 2023), Copenhagen, Denmark, 2023: 683–690. DOI:10.1049/icp.2023.2803.
[13] Bian J, Song Y, Ding C, Cheng J, Li S, Li G. Optimal Bidding Strategy for PV and BESSs in Joint Energy and Frequency Regulation Markets Considering Carbon Reduction Benefits[J]. Journal of Modern Power Systems and Clean Energy, 2024, 12(2): 427–439. DOI:10.35833/MPCE.2023.000707.
[14] Li Y, Wang L, Gu J, Huang X, Jin G. Optimal Energy Management Solution for Photovoltaic-Energy Storage System Participating in Energy-frequency Regulation Market[C]//2024 IEEE 2nd International Conference on Power Science and Technology (ICPST), Dali, China, 2024: 1700–1705. DOI:10.1109/ICPST61417.2024.10602327.
[15] Wang Y, Hu G, Chen G, Zhao J, Sun Z, Yang Y. Study on Frequency Regulation Ancillary Service Trading Mechanisms for Distributed Photovoltaic[C]//2020 12th IEEE PES Asia-Pacific Power and Energy Engineering Conference (APPEEC), Nanjing, China, 2020: 1–5. DOI:10.1109/APPEEC48164.2020.9220472.
[16] Chen Y, Liu C, Bian G. Research on the Economics of Multi-Energy Complementary Systems and Renewable Energy Integration in Medium and Long-Term and Peak Shaving Markets[J]. Strategic Planning for Energy and the Environment, 2025, 44(02): 349–388. DOI: 10.13052/spee1048-5236.4424.
[17] Wang J, Li Z, Li Q, Wang Y, Luo N. A Multi-objective Optimization Framework for Acceptance Capacity in Distribution Networks Under Coordinated Operation of Photovoltaic-Storage-Charging Systems[J]. Strategic Planning for Energy and the Environment, 2026, 45(01): 77–106. DOI:10.13052/spee1048-5236.4514.
[18] Bai H, Li Q, Wen Y, Liu Y. Joint Coordination Control of Hybrid Energy Storage System in New Distribution Network[J]. Strategic Planning for Energy and the Environment, 2026, 45(02): 321–348. DOI:10.13052/spee1048-5236.4522.
[19] Cheng M, Liu G, Meng J, Zhao J. Research on Optimal Operation Strategy of Distribution Network under Coordinated Dispatching of Flexible Load and Energy Storage[J]. Strategic Planning for Energy and the Environment, 2025, 44(03): 513–540. DOI:10.13052/spee1048-5236.4432.
[20] Song G, Yan X, Li J, Liu T, Zhang Y. Electric Energy and Primary Frequency Response Joint Clearing Model Considering Energy Storage and Wind power[C]//2024 4th International Conference on Intelligent Power and Systems (ICIPS), Yichang, China, 2024: 1136–1140. DOI: 10.1109/ICIPS64173.2024.10900296.
[21] Coban H H, Bajaj M, Rajagopalan A, Swaminathan D, Oubelaid A. Revenue Analysis of Cooperation of Battery Storage and Wind Power to Provide Frequency Regulation in the Energy Market[C]//2023 4th IEEE Global Conference for Advancement in Technology (GCAT), Bangalore, India, 2023: 1–7. DOI:10.1109/GCAT59970.2023.10353451.
[22] Anwar M, Wang C, de Nijs F, Wang H. Proximal Policy Optimization Based Reinforcement Learning for Joint Bidding in Energy and Frequency Regulation Markets[C]//2022 IEEE Power & Energy Society General Meeting (PESGM), Denver, CO, USA, 2022: 1–5. DOI:10.1109/PESGM48719.2022.9917082.
[23] Yang D, Zhang R, Liu C, Bian G. The Study of Long-Term Trading Revenue Distribution Models in Wind-Photovoltaic-Thermal Complementary Systems Based on the Improved Shapley Value Method[J]. Energy Engineering, 2025, 122(7): 26732694. https://doi.org/10.32604/ee.2025.062154.
[24] Chen Q, Wu M X, Liu Y Q, et al. Joint operation mechanism of spot energy and ancillary service for market-oriented absorption of wind power[J]. Electric Power Automation Equipment, 2021, 41(03): 179–188. DOI:10.16081/j.epae.202101026.
[25] Dai M, Ji T. Comparative Study on Sequential and Joint Clearing Models for Spot Electric Energy and Frequency Regulation Markets Considering a High Proportion of Renewable energy[C]//2024 Boao New Power System International Forum – Power System and New Energy Technology Innovation Forum (NPSIF), Qionghai, China, 2024: 941–946. DOI:10.1109/NPSIF64134.2024.10883154.
[26] Wu L, Ma R, Ma W, Ma X. An Optimization Strategy for Electric Vehicle Aggregators to Participate in the Energy and Ancillary Services Market[C]//2024 5th International Symposium on New Energy and Electrical Technology (ISNEET), Hangzhou, China, 2024: 598–603. DOI:10.1109/ISNEET64164.2024.10956027.
[27] Wu X, Zhang Q, Deng X, Huang Y, Li C. Day-ahead Bidding Strategy for Electric Vehicles and Wind Power Participating in Energy and Frequency Regulation Market[C]//2022 Power System and Green Energy Conference (PSGEC), Shanghai, China, 2022: 278–282. DOI:10.1109/PSGEC54663.2022.9880945.
[28] Du Y, Yang X, Guo L, Yin S, Ai Q. Day-ahead Bidding Strategy for the Smartbuilding Virtual Power Plant Participating in Energy and Frequency Regulation Market[C]//2020 IEEE 4th Conference on Energy Internet and Energy System Integration (EI2), Wuhan, China, 2020: 929–932. DOI:10.1109/EI250167.2020.9346743.
[29] Liu Z, et al. Strategic Large Scale Residential Demand Management for Provision of Frequency Regulation under Spot Market Environment[C]//2022 IEEE 6th Conference on Energy Internet and Energy System Integration (EI2), Chengdu, China, 2022: 22362240. DOI:10.1109/EI256261.2022.10116546.
[30] Tian S, Jiang Y, Dai J, Zhu S, Liu B, Hong B. Flexible Auxiliary Service Market Clearing Method Compatible with Frequency Modulation Service and Electric Energy Schedule[C]//2023 IEEE 7th Conference on Energy Internet and Energy System Integration (EI2), Hangzhou, China, 2023: 471–475. DOI:10.1109/EI259745.2023.10512950.
[31] Zhai Q, Meng K, Dong Z Y, Ma J. Modeling and Analysis of Lithium Battery Operations in Spot and Frequency Regulation Service Markets in Australia Electricity Market[J]. IEEE Transactions on Industrial Informatics, 2017, 13(5): 2576–2586. DOI:10.1109/TII.2017.2677969.
Biographies

Zhai Qiqi, Female, postgraduate student at the School of Electrical Engineering, Northeast Electric Power University, majoring in Electrical Engineering. Her main research interests include electricity market, power frequency regulation, and optimal power dispatch.

Bian Guoliang, male, postgraduate student at the School of Electrical Engineering, Northeast Electric Power University, majoring in Electrical Engineering. Her main research interests include electricity market, power frequency regulation, and optimal power dispatch.
Strategic Planning for Energy and the Environment, Vol. 45_3, 715–748
doi: 10.13052/spee1048-5236.4534
© 2026 River Publishers