Research on Optimal Trading Strategy and New Energy Consumption of Wind-Solar-Thermal Coupled System in Spot Market
Wang Xiuyun and Lu Hongshuai*
Northeast Electric Power University, School of Electrical Engineering,
Chuanying District, Jilin City, Jilin 132013, China
E-mail: 1847094008@qq.com
*Corresponding Author
Received 11 March 2026; Accepted 30 April 2026
Abstract
As the “dual-carbon” targets are set and the energy sector accelerates its shift toward green and low-carbon development, renewable sources such as wind power are being integrated at an unprecedented scale. This trend has imposed considerable strain on the stability and reliability of the evolving power system. To tackle this challenge, this study introduces a hybrid dynamic wind power forecasting approach that integrates machine learning with optimization algorithms. Furthermore, by incorporating a self-correcting parameter estimation process, a hybrid model is constructed. By continuously tuning the grid’s transmission capacity in real time, the proposed framework remains responsive to variations in wind power output. Based on observed fluctuation patterns, the framework continuously updates its system parameters, guaranteeing that the power grid operates optimally even under intricate and shifting environmental conditions. Using real-world data for validation, the proposed approach demonstrates clear strengths in both forecast precision and the operational efficiency of the power grid. By strengthening the grid’s resilience to wind power variability, this approach contributes to maintaining reliable and stable system operation. This technique offers tangible engineering backing for the seamless and efficient incorporation of wind energy into power grids.
Keywords: Spot market, power market, carbon market, wind-solar-thermal coupled system, renewable energy consumption.
1 Introduction
In September 2017, the National Development and Reform Commission released Document GF [2017] No. 1701, titled Guiding Opinions on Promoting the Development of Energy Storage Technology and Industry. This policy encourages the application of diverse energy storage technologies to achieve multi-energy complementarity and multi-source interaction in the energy internet. It also supports large-scale integrated energy bases in rationally deploying energy storage systems to realize coordinated complementarity among wind, solar, thermal, hydropower, and energy storage [1]. In January 2022, the National Development and Reform Commission, together with the National Energy Administration, issued Document FGN Energy [2022] No. 206, titled Opinions on Improving the Institutional Mechanisms and Policies for the Green and Low-Carbon Transformation of Energy, exploring the operation of regional integrated energy systems featuring multi-energy complementarity and combined supply of electricity, heating (cooling) and gas by the same market entity, and encouraging local governments to select investment and operation entities for regional integrated energy services through competitive approaches such as bidding [2]. In August 2022, several government agencies, including the Ministry of Industry and Information Technology, the Ministry of Finance, the Ministry of Commerce, the State-owned Assets Supervision and Administration Commission of the State Council, and the State Administration for Market Regulation, jointly unveiled the Action Plan for Accelerating the Green and Low-Carbon Innovative Development of Power Equipment (Document MIIT Joint Heavy Equipment [2022] No. 105). This plan is designed to promote the integrated development of source-grid-load-storage systems and multi-energy complementarity. It also seeks to cultivate emerging application modes such as wind power plus and photovoltaic plus, while speeding up the coordinated and optimal operation of multi-energy systems across various levels and time scales [3]. The release of the Basic Rules for the Electricity Spot Market (Trial) [4] in September 2023 indicated that it is imperative to promote the connection and coordination of various markets, explore the incorporation of carbon emission costs into the electricity pricing mechanism of the spot market, and thereby advance the linkage between the electricity market and the carbon market.
A substantial body of international research has examined the operational mechanisms of electricity and carbon markets. Key areas of focus include the allocation of carbon allowances, the supply and pricing of National Certified Emission Reductions (CCER), simulation-based assessments of how carbon markets influence electricity markets, and the bidirectional linkages and interactive dynamics between these two market systems.
In the context of improving resource allocation and trading performance among multiple virtual power plants within an electricity-carbon coupled market, Ref. [5] introduces a contribution-based peer-to-peer cooperative trading approach. This strategy simultaneously enhances economic returns and lowers carbon emission intensity. Aiming at the optimization of the carbon emission trading mechanism, Ref. [6] put forward an agent-based carbon emission trading simulation system and quota allocation mechanism, and found that under a perfectly competitive market, the adoption of a quota allocation mechanism can reduce the unit carbon emission cost, while excessive quota cuts will instead curb the enthusiasm for emission reduction. Ref. [7] studied the optimization of production plans for enterprises under the carbon cap-and-trade mechanism; by establishing a profit maximization model and designing a solution method, it was demonstrated that the carbon emission trading mechanism can effectively guide enterprises to meet emission reduction obligations while maintaining economic benefits. By simulating how the EU carbon market affects the short-term market of the German power sector under the Paris Agreement, Valencia established a model and found that the implementation of current policies has significantly promoted the increase in renewable energy installed capacity and the phase-out of coal-fired power technologies, effectively reducing carbon emissions in the power industry, but also pointed out that excess quotas will inhibit the operation of the secondary market [8]. Zhong et al. developed a two-stage optimization framework grounded in hybrid topology and coalition graph game theory to tackle challenges related to collaborative operation and equitable profit allocation among energy hubs in the electricity-carbon market. Through cooperative game and profit distribution mechanisms of the Myerson value and Shapley value, this strategy reduced carbon emissions by 33.45% compared with the non-cooperative game scenario, thus promoting low-carbon transactions in the energy system [9]. Employing a vector autoregression model alongside a multi-time scale volatility model, Wu et al. empirically investigated the price transmission and risk spillover channels connecting the carbon trading market with the green certificate market. Their findings reveal a significant price transmission linkage between the carbon market and the electricity market in South Korea [10].
As a central pillar of global power sector transformation, electricity spot markets have evolved along diverse pathways. In the United States, the PJM spot market comprises both day-ahead and real-time segments [11], supported by capacity and ancillary service markets that deliver operational flexibility and reliability assurances. The PJM electricity market adopts a renewable portfolio standard (RPS), requiring power generation enterprises to supply renewable energy power corresponding to their quotas. The UK Power Pool operates under a unilateral bidding framework, in which generators submit offers in the day-ahead market and are settled at the system marginal price. Market clearing takes place at 30 -minute intervals [12]. The Australian electricity spot market also adopts a unilateral bidding mechanism, in which only the power generation side declares prices and a real-time trading model is implemented without a day-ahead market [13]. The Nordic electricity spot market distinguishes itself through integrated coordination between day-ahead and intraday trading, and it operates the world’s inaugural cross-border day-ahead market [14]. Its day-ahead segment relies on centralized bidding paired with marginal pricing, whereas the intraday segment follows a “first-come, first-served with price matching” rule, enabling efficient power scheduling and distribution. This structure reflects a well-established framework for the synchronized operation of cross-border day-ahead and intraday markets. Ref. [15] proposes a model predictive control (MPC)-based coordinated control strategy for wind-photovoltaic-hydrogen-storage coupled systems, adopts a decoupled three-port converter (TPC) to replace the traditional DC bus, and realizes the real-time optimal power allocation and stable operation of the system by flexibly setting equipment constraints and weight factors through the self-defined MPC module, which effectively improves the consumption capacity of renewable energy.
China’s electricity spot market has moved beyond the pilot stage and entered a phase of comprehensive advancement and routine operation. Since 2017, when the first group of pilot projects was launched in eight regions – South China (beginning with Guangdong), Western Inner Mongolia, Zhejiang, Shanxi, Shandong, Fujian, Sichuan, and Gansu – each has progressively developed its own operational mechanisms tailored to local conditions. In terms of pricing, pilot regions such as Shanxi and Gansu have adopted nodal or zonal marginal pricing models, where generators submit segmented bids and the market is cleared through centralized optimization. Guangdong has introduced a full-volume bidding model in which generators bid on both price and output, while consumers only bid on load. This approach helps preserve price stability in the spot market [16]. In contrast, Western Inner Mongolia follows a framework that prioritizes medium- and long-term contracts and treats spot trading as supplementary. Its market supports day-ahead, intraday, and real-time transactions, and incorporates a contract power transfer mechanism to improve operational flexibility. Regarding renewable energy integration, Shandong has established a priority consumption threshold in the real-time market, permitting a portion of renewable output to engage in bidding and clearing. In Shanxi, Gansu, and other localities, accommodation capacity is expanded through inter-provincial and cross-regional spot trading, generation right exchanges, and bundled power export arrangements. Zhejiang is piloting a hybrid approach that integrates a full-pool model with contract-based markets. Fujian, which initially implemented unilateral bidding solely on the generation side, is now progressively advancing renewable energy participation in the market. At present, with the issuance of national-level rules such as the Basic Rules for the Electricity Spot Market (Trial), the unified market framework has gradually become clear, but provinces still face challenges in the connection of market rules, coordination of cross-regional transactions, response to the volatility of new energy, and improvement of pricing mechanisms [17, 18]. In summary, China’s electricity spot market has achieved notable advancements in institutional development, price discovery, and renewable energy integration. These accomplishments have established a vital groundwork for the creation of a nationally unified electricity market and for advancing the low-carbon transition of the energy mix.
In recent years, domestic research on the electricity-carbon market has focused on two main aspects. One line of research has investigated the influence of carbon trading prices on electricity market pricing. Aiming at the unclear price correlation mechanism between the electricity and carbon markets, Ref. [19] proposed an analysis strategy integrating the vector autoregression model and Copula function, quantified the two-way Granger causality and tail dependence between electricity prices and carbon prices, and found a significant linkage between the two which is affected by the energy market. To address the blockage in carbon price transmission to electricity prices, Ref. [20] put forward a dynamic analysis strategy based on the time-varying parameter vector autoregression (TVP-VAR) model and panel model, revealing the time-varying characteristics and market differences of transmission efficiency. Focusing on the unclear carbon cost transmission mechanism of power generation enterprises, Ref. [21] constructed an agent-based carbon cost transmission evaluation model to reveal the dynamic characteristics of transmission rates and key influencing factors. A separate body of work has explored the mutual interactions and interdependencies between the electricity and carbon markets. For example, Shuai Yunfeng et al. took the Regional Greenhouse Gas Initiative (RGGI) in the United States as a case study and revealed a two-way transmission and dynamic coupling relationship between the carbon market and the electricity market. The study found that the price and trading volume of the carbon market jointly affect the electricity price formation and power source structure of the electricity market, while the electricity price fluctuation and structural transformation of the electricity market will reversely regulate the carbon market [22], and the two restrict each other and evolve in a coordinated manner. Ref. [23] constructed a measurement model for the linkage effect of the carbon-electricity market and analyzed the linkage mechanism between key elements of the two markets. Aiming to address the ambiguity in the coordinated operation and cost pass-through mechanisms between the electricity and carbon markets, Ref. [24] developed a power generation cost model for the electricity market that explicitly incorporates carbon pricing. Using Guangdong Province as an illustrative empirical example, the study systematically examined the underlying mechanisms and practical implications within a real regional context. The results demonstrate how carbon prices influence electricity clearing prices and clarify the bidirectional constraints between the two markets, thereby providing a quantitative foundation for optimizing the generation mix and improving coordinated market policy design. Yang Yuqiang et al. systematically analyzed the close correlation between the electricity market and the carbon market, pointing out that the two share common market entities, unimpeded price transmission, consistent emission reduction goals and overlapping trading varieties [25]. Reference [26] examined how the coupling between electricity and carbon markets affects spot electricity prices under varying levels of carbon emission constraints. Ref. [27] examined the regulatory compliance behaviors of thermal power generation companies when simultaneously influenced by the electricity consumption rights trading system and the carbon emissions trading scheme; by constructing a system dynamics model and conducting multi-scenario simulations, it revealed the impact of establishing a coordinated mechanism of quota mutual recognition and offset limits on enterprise compliance costs, market equilibrium and resource allocation. Ref. [28] takes the wind-solar-thermal coupling system as a unified market entity, constructs a bi-level optimization model to study its competitive pricing and bidding strategies in the monthly centralized bidding market, maximizes revenue through internal cost optimization and external market clearing, and verifies that this mode can improve new energy accommodation and market participation benefits. Ref. [29] establishes a low-carbon optimization model for power systems driven by carbon capture technology and tiered electricity price, applies digital twin and multi-modal data fusion to model carbon-electricity collaboration, and proposes a DQN-based bi-objective reinforcement learning method combined with mixed integer programming to balance economic efficiency and low-carbon operation, which effectively improves carbon emission reduction and renewable energy consumption.
Against this backdrop, the Wind-Solar-Thermal Coupled System represented by the “integration of wind, solar, thermal, hydropower and energy storage” is a new technical path to improve system flexibility, address the challenges of renewable energy consumption, and participate in market competition as an aggregated entity, relying on the temporal and spatial complementarity of heterogeneous energy sources within the system. Set against the backdrop of the latest power sector reform, this study establishes a multi-energy complementary framework enabling coordinated operation between renewable sources and thermal power. It proposes an optimized participation strategy for the wind-solar-thermal integrated system within the electricity spot market, evaluates its economic performance under carbon market mechanisms, and thoroughly investigates the system’s involvement in the coupled electricity-carbon market. In conclusion, existing research has made significant progress in collaborative bidding mechanisms for Wind-Solar-Thermal Coupled Systems and the design of electricity-carbon coupled markets, providing a theoretical foundation for multi-energy systems to participate in power market transactions. However, through a systematic review of the literature, it is evident that current research still has the following limitations: First, most studies do not adequately consider the impact of renewable energy output prediction errors on bidding strategies, leading to significant deviations between market clearing results and actual operations; Second, existing models simplify the treatment of grid security constraints, with few studies exploring the real-time feedback mechanism of dynamic line capacity correction on multi-energy system bidding decisions; Additionally, in the context of electricity-carbon coupled markets, how to achieve dynamic balance between carbon costs and economic costs remains to be further investigated. To address these gaps, this paper proposes a bi-level optimization model incorporating a parameter self-calibration mechanism, which integrates hybrid dynamic wind power prediction with real-time line capacity correction methods to systematically resolve the aforementioned issues. The aim is to enhance the renewable energy integration capability and economic competitiveness of Wind-Solar-Thermal Coupled Systems in spot markets, providing new theoretical support and practical references for multi-energy systems participating in electricity-carbon collaborative markets.
2 Bi-level Optimization Model for Collaborative Bidding of Wind-Solar-Thermal Coupled System in the 2-Day Ahead Market
A multi-agent collaborative bidding bi-level optimization model incorporating the Wind-Solar-Thermal Coupled System is proposed. For the upcoming operating day, each power producer is supplied by the market operator with boundary information – including the day-ahead load forecast and projected renewable energy output. Based on their own operational data and public market information, each power generation entity formulates its bidding strategy with the goal of maximizing its own revenue. The power market operator then clears the market through Security-Constrained Unit Commitment (SCUC) by integrating the bidding information of each power generation entity and the system operation parameters. After that, each power generation entity obtains its own awarded electricity volume and revenue, based on which it further optimizes its bidding strategy for the next stage, and this process cycles continuously. A dual-level optimal modeling framework for electricity-generating firms is constructed on the basis, as shown in Figure 1.
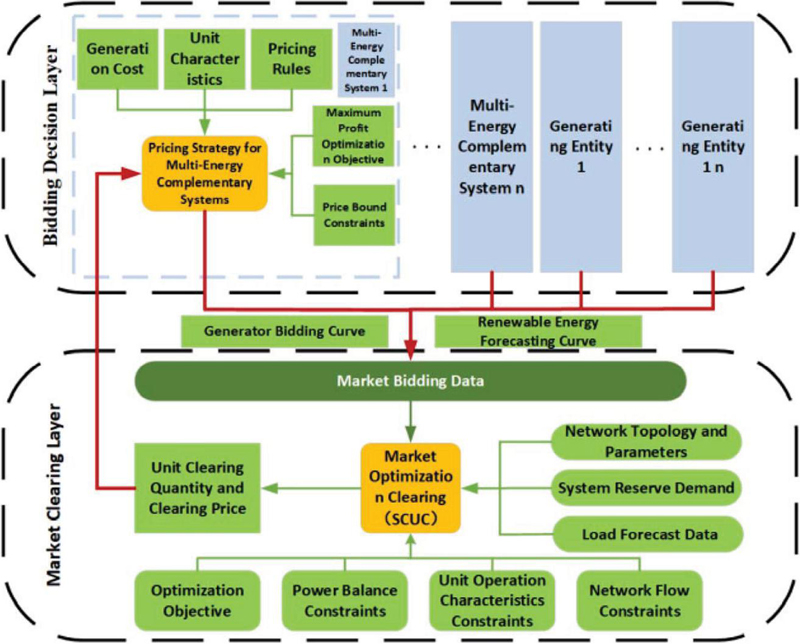
Figure 1 Bi-level optimization model for day-ahead bidding of power generation entities.
2.1 Upper-Level Objective Functions of Power Generation Entities
2.1.1 Profit objective function of wind-solar-thermal coupled system
Within the day-ahead electricity market, the integrated multi-energy system operates as a single market participant and submits a collective bidding strategy. This framework integrates the distinctive operational attributes of conventional fossil-fuel generating units and renewable energy sources, with specific emphasis on thermal power plants: these units are required to account for fuel usage and ecological expenses in the computation of marginal costs, a condition that typically results in elevated marginal costs. Conversely, renewable sources such as wind and solar are primarily subject to upfront capital expenditure and routine maintenance costs, featuring zero marginal costs. Therefore, although new energy has low costs, the overall bidding strategy of the Wind-Solar-Thermal Coupled System is often dominated by the cost structure of thermal power units.
Nevertheless, from a holistic operational perspective, the integrated multi-energy system is designed to maximize overall collective gains. Its objective function for optimization incorporates the revenues, startup/shutdown expenses, and operating costs of conventional thermal units, as well as the earnings from renewable power stations:
| (1) |
Where: : Node price at node s of the coupled system in period : Spot market benchmark price; : Winning output of the coupled system at time : 90% forecasted electricity generation from renewable energy plants in the coupled system in period t (with priority grid connection); : Total output of the coupled system at time t; : Start-up expenses incurred by coal-fired generating units in the coupled system at time ; : Unit start-stop state transition (only when and ); : Short-term day-ahead predicted output of new energy stations in the coupled system; : Total start-up cost of the coupled system; : Overall coal-fired generation expense incurred by the integrated system at time interval t; T: Aggregate count of time intervals; : Standard coal price; : Coal consumption cost coefficients of the coupled system;
2.1.2 Profit objective function of thermal power enterprises
For a single thermal power unit, it only needs to consider maximizing its own revenue, which consists of thermal power revenue, start-stop costs, operation costs, and carbon emission costs:
| (2) |
Where: : Locational marginal price at the busbar of coal-fired generating units outside the coupled system in period : Winning power generation from conventional thermal plants outside the coupled system at time : Start-up expenses incurred by coal-fired generating units outside the coupled system at time : Coal consumption expense incurred by coal-fired generating units outside the coupled system at time : Coefficients for the coal-related cost function of thermal generating units outside the coupled system; variable for the unit switching from shutdown to start-up state (only when and ).
2.1.3 New energy stations
At this stage, new energy stations mainly engage in bidding within the spot electricity market with 10% of predicted electricity. In order to secure the grid integration of their respective power generation, they usually participate in market competition with low declared electricity prices. Considering the low competitive electricity volume and the usual low quotation of new energy in the spot market, at the current stage, the optimization of bidding strategies for renewable energy generators is not undertaken within this study
2.1.4 Stepwise quotation of power generators
In line with the prevailing regulations of the spot market, each power generator shall declare a monotonically non-decreasing electricity price curve:
| (3) |
Where: : The b-th segment price declared by the i-th thermal power unit; : The lower and upper limits of the market quotation for the b-th segment of the i-th unit, respectively; : The lower bound of allowable bidding prices; : The maximum quotation limit allowed by the market; : The quotation of the power generation entity corresponding to the previous quotation segment; : The quotation of the power generation entity corresponding to the next quotation segment.
In the existing spot market, power generation entities generally adopt stepwise quotation curves. As an initial step, generation firms formulate a piecewise bidding curve derived from incremental costs, then multiply each segment of the quotation curve by the same multiple to construct a quotation strategy space. This approach can optimize their own quotation strategies through the strategic use of regulatory adaptability inherent in market provisions while meeting market regulations. Power generators generally adopt a profit-oriented bid markup strategy, that is, declaring high prices at the end of the quotation curve to achieve economic withholding, while declaring opportunity costs or marginal costs for the remaining capacity. The principal objective of implementing such an approach is to enhance financial returns while securing involvement in market dispatch.
It is common for coal-fired power producers to segment their installed capacity into three blocks:
Low-price zone: To ensure the unit operates without shutdown, the quotation for this segment is set as the market quotation lower limit stipulated by the government.
Central quotation zone: This zone accounts for a relatively large proportion. The capacity of this interval is divided into three segments, and the quotation steps are concentrated on the marginal cost under of the unit’s profit, so as to improve competitiveness and earn profits.
Withholding adventure zone: This part is a small amount of capacity that cannot win the bid during normal clearing. It is quoted close to the upper quotation limit to obtain more profits when power capacity is tight without affecting its own winning bid volume.
2.2 Lower-Level Objective Function of Power Generation Entities
At the lower tier, the optimization objective corresponds to the market clearing process, which seeks to maximize societal welfare through optimal dispatch. Its objective function is:
| (4) |
Where: : The declared price and winning output of each power generation entity in the -th segment at time , respectively; : Overall count of generating entities in the electricity system; : Total number of quotation segments of power generation entities; : 90% predicted output of new energy station in period (with priority grid connection); : Winning electricity volume of new energy station participating in spot market competition in period : Total winning output of power generation entity and new energy station in period , respectively; : Penalty factors for positive and negative overload of line , respectively; : Positive and negative overload of line at time , respectively.
Node price at node at time :
| (5) |
Where: : Total winning output of power generation entities in period : Lagrange multiplier of the system load balance constraint in period , i.e., the electricity price component; : Total number of lines; : Lagrange multipliers of the maximum positive/negative power flow constraints of line , respectively. In cases where the transmission line flow exceeds its capacity, the Lagrange multiplier serves as a penalty coefficient for relaxing network power flow constraints; : Distribution coefficient for electrical power transfer between node s and transmission line . (Note: All Lagrange multipliers are greater than or equal to 0).
2.2.1 Relevant constraints
The lower-level market clearing model adopts the DC optimal power flow (DC-OPF) assumption. Under this framework, the model focuses on active power economic dispatch, unit commitment, and transmission line security constraints, which are consistent with the standard modeling practice for day-ahead electricity spot markets. Voltage/reactive power constraints belong to real-time operation and security check stages, and are handled by real-time dispatch and automatic voltage control (AVC) systems rather than being explicitly included in the day-ahead SCUC model.
Constraints on power output per quotation block of generation firms
| (6) |
Where: : Binary state of unit indicating on/off status at time ; for start-up state, for shutdown state; : Upper generation limit of unit i in bid segment b. Grid-wide load-generation balance condition
| (7) |
Where: : Output of new energy stations outside the coupled system at time t; : Predicted load at node s in period t. Reserve constraint
| (8) |
Where: : Positive and negative reserve load values of the system at time , respectively; : Upper and lower output limits of unit i at time t, respectively. Ramp constraint
| (9) |
Where: : Up-ramp rate of power generation entity : Down-ramp rate of power generation entity : Generation level of unit i during the prior interval. Upper and lower output limits of units
| (10) |
Where: : Upper and lower output limits of unit i at time t, respectively; : Set of units.
Maximum start-stop times constraint of units First, formulate start-up and shutdown switching indicators. Let be a variable indicating whether unit i switches to the start-up state at time t (0 for no start-up decision, 1 for executing the start-up decision). Let be a variable indicating whether unit i switches to the shutdown state at time t (0 for no shutdown decision, 1 for executing the shutdown decision).
The corresponding start-stop times limit of the unit can be expressed as follows:
| (11) |
Where: , : Maximum and minimum allowable start-up times of unit i, respectively.
Given the intrinsic physical characteristics and operational demands of thermal power plants, adherence to minimum uptime/downtime periods is obligatory, and such constraints are formulated as:
| (12) | |
| (13) |
Where: : Start-stop state of unit i in period : Minimum uptime and downtime of unit i, respectively; . Continuous start-up time and uninterrupted downtime of unit i in period t, respectively, which can be expressed by state variables:
| (14) | |
| (15) |
New energy output constraint
| (16) |
Where: : Predicted output of new energy station j at time t. Line power flow constraint
| (17) |
Where: : Transmission capacity bound for branch l; : Generator output power transfer distribution factor from the node of thermal power unit i to line l; : Generator output power transfer distribution factor from the node of new energy station j to line l; : Load transfer distribution factor from node s to line : Node load magnitude at node s in period t.
3 Model Solving Method
3.1 Approximate Solution of SCUC Model Clearing
First, define the constraints of the day-ahead security-constrained unit commitment (SCUC) mathematical model as follows. Let be the feasible region of the problem, be the variable related to unit start-stop, be the variable related to power generation output, and be the variable related to transmission power.
After relaxing the integer variables in the constraints to continuous variables, only key line power flow constraints are sampled, and other constraints are randomly sampled. The unsampled constraints are verified and compensated in the subsequent Lagrange relaxation iterative solution of SCUC.
A new feasible region is formed after simplification, and the objective function of the original day-ahead market clearing SCUC is transformed into:
| (18) |
Then, add a global linear regularization penalty term (where is the global penalty parameter) to the SCUC model objective function using the approximate solution solved from the above formula to achieve the optimal clearing result:
| (19) |
3.2 Lagrange Relaxation Iterative Solution of SCUC Model
Identify the dense coupling constraints that make the problem difficult to solveline power flow constraints in the SCUC model, initialize the dual Lagrange multipliers , and jump to 2).
Based on Lagrange relaxation, add the line power flow constraints to the objective function through Lagrange multipliers, and control the magnitude of the penalty term to ensure that the optimality of the original problem is not compromised. Generate the Lagrange dual problem, whose specific form in the k-th iteration is as follows:
| (20) |
s.t. Remaining constraints of the SCUC model and .
Where is the value of the l-th Lagrange multiplier in the k-th iteration.
Fix the Lagrange multipliers and solve the original problem. Perform linear relaxation on the problem and output the optimal solution .
Update the Lagrange multipliers by calculating the relaxation degree of the line power flow constraints, and jump to 5). The update method is as follows:
| (21) |
Where: is a coefficient with a range of is a step size coefficient that decreases with the increase of iteration times.
Determine whether the iteration of formula (21) has converged (, where is the convergence threshold). If the convergence condition is met, jump to 6); otherwise, jump to 3).
After the iteration of problem (21) ends, if there are still some lines overloaded, it is necessary to add these overloaded sections to the objective function of the SCUC model in the form of relaxation penalties, and add the non-overloaded lines after solving the k -th problem 2) to the model as hard constraints, solve the mixedinteger linear programming (MILP) problem, and jump to 7).
The specific MILP problem is as follows:
| (22) |
s.t. Remaining constraints of the SCUC model and:
| (23) | |
| (24) |
Where: : Set of overloaded lines after solving the k-th formula (21); : Set of non-overloaded sections after solving the k-th formula (21); : Positive and negative relaxation variables of overloaded sections in , respectively; M is a large positive number.
If the model has a solution, output variables such as unit start-stop state, output plan, and . Return the winning electricity volume and node price to the upper-level quotation decision layer.
This study employs the particle swarm optimization (PSO) algorithm to solve the two-layer optimization model, with the following specific steps:
Within typical implementation settings, numerous decentralized trading entities participate in the market. For environmental modeling, the entire set of market participants is treated as a particle swarm, with each individual power producer corresponding to a single particle. Initialize the PSO algorithm parameters: particle swarm size n, optimization dimension d, and maximum number of iterations ;
Under bid limits, stochastically set start positions and velocities for n particles and m market agents;
Under bid limits, take the profit function of each participating market entity as the fitness function (), obtain the transaction volume and revenue after clearing the lower-level function ( Social Welfare), and calculate the individual optimal and global optimal;
Renew bids of all participants and iterate; Iteration ends once fitness stabilizes or the maximum iteration count is reached, and the non-cooperative game equilibrium solution for this period is obtained. In this section, the global penalty parameter is set to 100000.
4 Results Analysis
4.1 Lagrange Relaxation Iterative Solution of SCUC Model
4.1.1 Composition of market entities
Wind-Solar-Thermal Coupled System (coupling thermal power unit wind farms);
2 independent thermal power enterprises (200 MW and 250 MW units respectively);
2 new energy stations (100 MW photovoltaic power station 80 MW wind farm, only 10% of output participates in spot market competition);
Market operator: Implements SCUC (Security-Constrained Unit Commitment) clearing rules, covering 3 nodes and 3 transmission lines (with DLR dynamic current-carrying capacity constraints).
4.1.2 Time dimension
Bidding cycle: 2-day ahead market, divided into 24 time periods (, 1 hour per period);
Prediction time domain: Short-term wind power prediction (24 hours in advance), with prediction values updated every 15 minutes;
Iteration convergence threshold: , maximum number of PSO iterations Tmax 100.
4.1.3 Core system parameters
Table 1 Basic parameter settings
| Parameter Type | Specific Value |
| Standard coal price p_coal | 1200 RMB /ton |
| Carbon trading price p_carbon | 50 RMB /ton |
| Maximum line currentcarrying capacity F_l,max | 350MW (for all lines) |
| Bidding upper and lower limits | Minimum P_market,min 0.1 RMB/(MWh), Maximum P_market, RMB/(MWh) |
| Minimum continuous operation time of thermal power T_on,min | 8 hours |
| Minimum continuous shutdown time of thermal power T_off,min | 4 hours |
| PSO parameters | Particle swarm size , optimization dimension (3 power generation entities -segment bidding), inertia weight |
| Prediction error penalty coefficient |
4.2 Basic Data Input
Table 2 Node load forecast (MW)
| Time Period t | Node 1 | Node 2 | Node 3 | Total Load |
| 1–8 | 180–220 | 150–190 | 120–160 | 450–570 |
| 9–16 | 250–320 | 200–260 | 180–230 | 630–810 |
| 17–24 | 230–280 | 180–230 | 160–200 | 570–710 |
Table 3 New energy output forecast (MW)
| Type | 90% Priority Grid-Connection Output P_new90 (Time Period Distribution) | 10% Competitive Output P_new10 | Prediction Error (Traditional Method) |
| Wind Farm 1 (Within Complementary System) | 100–150 (1–8), 200–300 (9–16), 120–180 (17–24) | 10–30 | 8.2% |
| Wind Farm 2 (Independent) | 80-120(1-8), 150-220 (9-16), 90-140(17-24) | 8–22 | 7.9% |
| Photovoltaic Power Station | 0(1–6/18–24), 50–90(7–17) | 5–9 | 6.5% |
Table 4 Thermal power unit cost parameters
| Coal | Start-Stop | Maximum | Minimum | |
| Consumption | Cost | Output | Output | |
| Coefficients | C_start | P_max | P_min | |
| Entity | (a,b,c) | (RMB/time) | (MW) | (MW) |
| Thermal Power in Complementary System | , , | 5000 | 300 | 60 |
| Independent Thermal Power 1 | , , | 4500 | 200 | 40 |
| Independent Thermal Power 2 | , , | 4800 | 250 | 50 |
Bidding curve: Each thermal power entity adopts 3-segment bidding (low-price zone, central bidding zone, withholding zone). The complementary system formulates strategies based on the zero marginal cost output of new energy as a priority;
Fitness function: Takes the maximization of each entity’s profit as the goal (Formulas 2.1, 2.2), incorporating carbon costs and start-stop costs;
PSO solution: Through particle position update (bidding adjustment), convergence is achieved after 52 iterations. The global optimal solution corresponds to the three-segment bidding of the complementary system as [80, 120, 450] RMB/(MWh), independent thermal power 1 as [90, 130, 480] RMB/(MWh), and independent thermal power 2 as [85, 125, 460] RMB/(MWh).
Approximate solution acquisition: After relaxing integer variables, the system marginal cost corresponding to the initial feasible region is 105 RMB/(MWh);
Lagrange relaxation iteration: Embed line power flow constraints into the objective function (Formula 3.3), update multiplier . When , the line overload , satisfying the constraint;
MILP solution: Solve the remaining constraints to obtain the node price _s,t (the highest at Node 2 during periods 9–16, reaching 142 RMB/(MWh)).
Wind power prediction: Adopt the “time-frequency decomposition + attention mechanism + data augmentation” method proposed in the paper, reducing the prediction error from 8.2% to 4.5%;
DLR online update: Integrate GRU meteorological prediction and traveling wave sag calculation, the dynamic adjustment range of line current-carrying capacity is 280–345 MW, and the utilization rate is increased by 11%;
Closed-loop correction: Through WAMS/SCADA data residual sensitivity regularization, the correction error of line thermal parameters is 2.3%.
Table 5 Bidding and winning results
| Market Participant | Three-Segment Bidding Price (RMB/(MWh)) | Total Winning Power (MWh) | Winning Rate |
| Wind-Solar-Thermal Coupled System | 80, 120, 450 | 5820 | 92.5% |
| Independent Thermal Power 1 | 90, 130, 480 | 3680 | 85.3% |
| Independent Thermal Power 2 | 85, 125, 460 | 4350 | 88.7% |
| Independent New Energy Station | 0.1 (Competitive Segment) | 520 | 100% (Priority Grid Connection + Competition) |
4.3 Basic Data Input
As can be seen in Table 5–7, The Wind-Solar-Thermal Coupled System achieves a net profit higher than the average of independent thermal power plants through the bidding strategy of “new energy priority + thermal power flexible peak regulation”;
The dynamic line rating (DLR) and parameter self-correction mechanism significantly improve the power grid’s wind power accommodation capacity, reducing the curtailment rate to 1.8%;
Table 6 Revenue and cost analysis (total period accumulation)
| Participant | Power Sales Revenue (10k RMB) | Coal Consumption Cost (10k RMB) | Carbon Cost (10k RMB) | StartStop Cost (10k RMB) | Net Profit (10k RMB) |
| Wind-Solar-Thermal Coupled System | 786.5 | 428.3 | 35.7 | 12.5 | 310.0 |
| Independent Thermal Power 1 | 425.8 | 286.4 | 24.3 | 9.2 | 105.9 |
| Independent Thermal Power 2 | 502.3 | 321.6 | 28.5 | 10.1 | 142.1 |
Table 7 System operation performance comparison
| Traditional Method | |||
| (No Parameter | |||
| Proposed | Self-Correction | ||
| Indicator | Method | Single Prediction) | Improvement |
| Wind Power Prediction Accuracy | 95.5% | 91.8% | 3.7 percentage points |
| Line Current Capacity Utilization Rate | 89.2% | 78.1% | 11.1 percentage points |
| System Social Welfare (10k RMB) | 1863.2 | 1725.6 | 7.97% |
| Node Voltage Deviation Rate | 1.2% | 2.5% | 52% |
| Thermal Power Start-Stop Times | 8 times | 13 times | 38.5% |
5 Conclusion
This study addresses the challenges of renewable energy consumption and market trading optimization under the “dual-carbon” goal, proposing a Wind-SolarThermal Coupled System solution for the electricity-carbon coupled spot market.
Key conclusions are as follows:
The proposed bi-level collaborative bidding optimization model effectively balances the profit goals of market entities and system social welfare, with efficient solution via PSO and Lagrange relaxation algorithms, verifying its feasibility. The integrated wind power prediction algorithm (“time-frequency decomposition + attention mechanism + data augmentation”) reduces prediction error from 8.2% to 4.5%, while the DLR mechanism with parameter selfcorrection boosts line capacity utilization by 11.1 percentage points, cutting renewable energy curtailment to 1.8%.
The Wind-Solar-Thermal Coupled System achieves remarkable economic and environmental benefits: its net profit is 53.2% higher than the average of independent thermal power plants through “new energy priority thermal power peak regulation” strategy, with system social welfare increased by 7.97% and node voltage deviation reduced by 52%. Additionally, the research confirms positive interaction between the electricity and carbon markets, providing practical support for the green low-carbon transformation of the energy structure and spot market optimization.
References
[1] National Development and Reform Commission. Guiding Opinions on Promoting the Development of Energy Storage Technology and Industry [EB/OL]. 2017. https://www.gov.cn/xinwen/2017-10/12/content\_5231304.htm.
[2] National Development and Reform Commission, National Energy Administration. Opinions on Improving the Institutional Mechanisms and Policies for the Green a nd Low-Carbon Transformation of Energy (FGN Energy (2022) No.206) [EB/OL]. 2022. https://www.ndrc.gov.cn/xxgk/zcfb/tz/202202/t20220210\_1314511.html.
[3] Ministry of Industry and Information Technology. Action Plan for Accelerating the Green and Low-Carbon Innovative Development of Power Equipment (MIIT Joint Heavy Equipment (2022) No.105) [EB/OL]. 2022. https://www.gov.cn/zhengce/zhengceku/2022-08/29/content\_5707333.htm.
[4] National Development and Reform Commission, National Energy Administration. Basic Rules for the Electricity Spot Market (Trial) [EB/OL]. 2023. https://www.gov.cn/zhengce/zhengceku/202309/content\_6904881.htm.
[5] Wei H, Zhang J. Contribution-driven cooperative trading strategy for multi-energy virtual power plants in the electricity-carbon coupled markets: An asymmetric Nash bargaining model[J]. Energy Strategy Reviews, 2026, 63: 102047.
[6] Jiang W, Liu J, Liu X. Impact of carbon quota allocation mechanism on emissions trading: An agent-based simulation[J]. Sustainability, 2016, 8(8): 826.
[7] Zhang B, Xu L. Multi-item production planning with carbon cap and trade mechanism[J]. International Journal of Production Economics, 2013, 144(1): 118–127.
[8] Valencia V, Franco CJ, Cárdenas LM. Contributions for Latin America of the EU ETS phase 4[J]. IEEE Latin America Transactions, 2019, 17(3): 358–364.
[9] Zhong X, Zhong W, Liu Y, et al. A communication-efficient coalition graph game-based framework for electricity and carbon trading in networked energy hubs[J]. Applied Energy, 2023, 329: 120221.
[10] Wu C, Zhou D, Zha D. The interplay of the carbon market, the tradable green certificate market, and electricity market in South Korea: Dynamic transmission and spillover effects[J]. Energy & Environment, 2024, 35(1): 163–184.
[11] Jian Z, Bo B, Xiangzhen H, et al. The Enlightenment of US Demand Side Response Participating in PJM Market Trading Mechanism for China[C]//Proceedings of the 2nd International Academic Conference on Blockchain, Information Technology and Smart Finance (ICBIS 2023). Atlantis Press, 2023: 513–522.
[12] Liu J, Wang J, Cardinal J. Evolution and reform of UK electricity market[J]. Renewable and Sustainable Energy Reviews, 2022, 161: 112317.
[13] Bushnell JB, Gregory J. Markets with Power: Competitive benchmark model of the Australian National Electricity Market[C]//2023 19th International Conference on the European Energy Market (EEM), 2023: 1–6.
[14] Meeus L, Vandezande L, Cole S, et al. Market coupling and the importance of price coordination between power exchanges[J]. Energy, 2008, 34(3): 228–234.
[15] Zhang Z M, Yin G, Sun X L, et al. MPC-Based Coordinated Control Strategy for Wind-Photovoltaic-Hydrogen-Storage Coupled Systems[J]. Strategic Planning for Energy and the Environment, 2026, 45(1): 139–178.
[16] Tan H J, Guo W X, Zheng W J, et al. Overview and prospect of the development of electricity spot markets at home and abroad[J/OL]. Power Generation Technology, 1–11. https://link.cnki.net/urlid/33.1405.tk.20240517.0906.002.
[17] Zou P, Chen Q X, Xia Q, et al. Logical analysis of foreign electricity spot market construction and its enlightenment and suggestions for China[J]. Automation of Electric Power Systems, 2014, 38(13): 18–27.
[18] Song Y H, Bao M L, Ding Y, et al. Overview of key points and related suggestions for China’s electricity spot market construction under the new power reform[J]. Proceedings of the CSEE, 2020, 40(10): 3172–3187.
[19] Shang N, Lu Z L, Chen Z, et al. Empirical analysis of the correlation between electricity and carbon prices based on vector autoregression model and Copula theory[J]. Power System Technology, 2023, 47(6): 2305–2317.
[20] Ren Y F, Sun F, Yang X W, et al. Analysis of dynamic transmission efficiency of carbon prices from the perspective of “electricity-carbon” market connection[J]. Statistics & Decision, 2024, 40(13): 183–188.
[21] Wei Y G, Zhu R Q, Tan L Y. Carbon cost pass-through rate and dynamic characteristics of power generation enterprises in China’s carbon market[J]. China Population, Resources and Environment, 2024, 34(3): 50–59.
[22] Shuai Y F, Zhou C L, Li M, et al. Research on the coupling mechanism between the US carbon market and electricity market-A case study of the Regional Greenhouse Gas Initiative (RGGI)[J]. Electric Power Construction, 2018, 39(7): 41–47.
[23] Zhao Y H. Research on market linkage effect and electricity market transaction optimization under carbon-electricity coupling[D]. Beijing: North China Electric Power University, 2024.
Zhao C H, Zhang M M, Wu J J, et al. Research on the coupling of carbon market and electricity market[J]. Chinese Journal of Environmental Management, 2019, 11(4): 105–112.
[24] Yang Y Q, Xu C W, Deng H. Research on key issues of coordinated operation of carbon market and electricity market[J]. Zhejiang Electric Power, 2023, 42(5): 66–75.
[25] Li X G, Tan Q B, Li F Q, et al. Analysis model of the impact of electricity-carbon coupling on the settlement price of coal-fired power units in the spot market[J]. Electric Power, 2024, 57(5): 113–125.
[26] Sun J Q, Zhang Z L, Zhou Z Q, et al. Quota compliance strategy of thermal power enterprises under the coordination of energy use right market and carbon market[J]. China Environmental Science, 2024, 44(4): 1840–1850.
[27] Zhu J Z, Xie C C, Zhang D, et al. A review of electricity-carbon coupled market research: Current status, challenges and sustainable development[J]. Electric Power Construction, 2025, 46(1): 158–173.
[28] Bian G L, Meng Y Q, Gu Y, et al. Competitive Pricing Strategy of Wind-Solar-Fire Coupling System in Monthly Concentrated Market Considering Renewable Energy Uncertainty[J]. Strategic Planning for Energy and the Environment, 2024, 43(2):215–250.
[29] Pan H, Yang C, Wei X, et al. Research on Low-Carbon Optimization Model of Power System Driven by Carbon Capture and Ladder Electricity Price[J]. Strategic Planning for Energy and the Environment, 2025, 44(4): 933–956.
Biographies

Wang Xiuyun, Female, teacher at the School of Electrical Engineering, Northeast Electric Power University, associate professor, master’s supervisor. Her main research interests include power system and its automation, and electricity market.

Lu Hongshuai, male, postgraduate student at the School of Electrical Engineering, Northeast Electric Power University, majoring in Electrical Engineering. His main research interests include electricity market, capacity market, and optimal power dispatch.
Strategic Planning for Energy and the Environment, Vol. 45_3, 749–774
doi: 10.13052/spee1048-5236.4535
© 2026 River Publishers