News Article Based Industry Risk Index Prediction for Industry-Specific Evaluation
Kyungwon Kim1 and Kyoungro Yoon2,*
1Korea Electronics Technology Institute, Mapo-gu, Seoul, 03924, Republic of Korea
2Konkuk University, Gwangjin-gu, Seoul, 05029, Republic of Korea
E-mail: kwkim@keti.re.kr; yoonk@konkuk.ac.kr
*Corresponding Author
Received 01 May 2020; Accepted 17 February 2021; Publication 02 June 2021
Abstract
The existing industry evaluation method utilizes the method of collecting the structured information such as the financial information of the companies included in the relevant industry and deriving the industrial evaluation index through the statistical analysis model. This method takes a long time to calculate the structured data and cause the time delay problem. In this paper, to solve this time delay problem, we derive monthly industry-specific interest and likability as a time series data type, which is a new industry evaluation indicator based on unstructured data. In addition, we propose a method to predict the industrial risk index, which is used as an important factor in industrial evaluation, based on derived industry-specific interest and likability time series data.
Keywords: Industry evaluation, industry-specific risk prediction, unstructured data, multiple classification, time-series data analysis.
1 Introduction
The analysis of industry evaluation provides analytical information for critical decisions such as determination of the companies included in the certain industry, the judgment and prospect of the certain industry, and the investment decision of the financial sector. Due to the development of financial analysis techniques, various evaluation models and financial indicators have been developed and periodically and transparently disclosed. Based on this, industry evaluation analysis is being conducted. The existing industry evaluation method utilizes the method of collecting the structured information such as the financial information of the companies included in the relevant industry and deriving the industrial evaluation index through the statistical analysis model. Cash flows, financial indicators, etc., which form the basis of these industry valuation methods, provide quantitative grounds for the accuracy and evaluation of information [1, 2].
However, this structured data-based analysis information takes a lot of time to collect data and statistics for each industry and is provided in the form of statistical analysis reports every year or half. Therefore, it is not able to reflect the rapidly changing market situation and the latest issues. In order to compensate for this, the industrial evaluation experts are added to provide the industry evaluation analysis report based on the statistical data centered on structured data. However, since the prior knowledge/competence of the industrial evaluation experts and the range of information searched can be reflected in limited and biased opinions, the accuracy of the analysis of the potential prospects of the industry is low. In order to overcome the problems of the existing industry evaluation method, there is a need for an industrial evaluation analysis capable of monthly/quarterly renewal by refining/supplementing unstructured data based on high quality formal data [3].
In addition, in the existing industry evaluation method, financial and non-financial information of the target company is classified as one industry for the analysis, and the information of the companies is collected and utilized for analysis. Therefore, information of a company that can affect several industries is classified as only one industry, which may result in incomplete data for each industry.
In this paper, I proposed a method of industrial evaluation index based on unstructured data analysis and predicting industrial risk index to solve the problem about the absence of information timeliness provision of industrial information due to industry evaluation analysis based on structured data, reflected biased opinions from industry evaluation experts on unstructured data utilization, and the incompleteness of industry data according to a single industry classification of corporate information, which is a problem of the existing industry evaluation method. I classified industries into multiple categories based on news articles that can cover the contents of the industry in general and assigned industrial classification weights for each article so that they can be reflected in various industries affecting one news article. Using multiple news articles classified by industry, I derived monthly industrial interest and likability as a time series data for industry, which is a new industrial evaluation index based on unstructured data. Based on the keywords and weights derived by industry, I analyzed the inter-industry relationship using topic modeling techniques and correct the industry-related interest and likability time-series data based on the inter-industry relationship weights. Also, I predicted industrial default rate and delinquency rate, which are used as important factors in industrial evaluation, based on derived industrial interest and likability time series data. To predict industry risk, I derived time lag through cross-correlation analysis between industrial interest, likability which are unstructured data-based indicators, industrial default rate and delinquency rate which are structured data-based indicators, and multiple regression analysis.
Based on the technology proposed in this paper, it is possible to provide objective analysis information for each industry by deriving industry evaluation indexes based on unstructured data using the technology proposed in this paper and to provide timely information reflecting the impact of unstructured data on various industries. In addition, industry risk prediction based on structured/unstructured data can provide information that can supplement the existing structured data-based industry evaluation service.
2 Multiple Classification of News Articles
In order to analyze industry-specific evaluation indices based on unstructured data, it is necessary to collect atypical data including contents corresponding to each industry and to classify the industry into categories [4, 5]. In this paper, we have selected unstructured data for analyzing news articles that contain various contents of various industrial fields in order to analyze industry-specific indicators.
2.1 Multiple Classification of News Articles
Feature analysis of each news article should be preceded in order to analyze industry-specific evaluation indicator based on news articles. In this paper, we extract and store the information as shown in Table 1 for each collected news article.
Table 1 Extracted information of news article
| Field Name | Description |
| DocID | Identifier of news article |
| Date | News article publication date |
| Title | News article title |
| Content | News article contents |
| URL | URL of news article |
| Category | News article publishing category |
| Terms | List of representative keywords and weights |
| Keywords | List of representative keywords |
| Keyword_cnt | List of representative keywords and count |
| SentiInfo | Positive/negative classification(positive/neutral/negative) |
| SentiLevel | Positive/negative value (1-10) |
| SentiKeywords | Positive/negative keywords |
The main keywords are extracted nouns through morphological analysis and pre-processing, and they extract main keywords based on extracted noun lists. The term frequency-inverse sentence frequency (TF-ISF) algorithm, which is a modified version of the term frequency-inverse document frequency (TF-IDF) algorithm [6, 7], is used for main keyword extraction. The TF-IDF algorithm is a technique that expresses the importance characteristic of a specific keyword in several document groups by weight. By transforming this, there is a TF-ISF algorithm that expresses the importance of specific keywords in a sentence. The TF-ISF algorithm is as shown in the following equation:
| (1) |
The importance weight of the keyword included in the news article is calculated using Equation (1). TF is the frequency of the keyword in the corresponding sentence (the th sentence in the news article ), and ISF is the inverse frequency of the number of sentences containing the keyword in the news article . is used to reflect the importance of the sentence in the news article as a weight. For example, a keyword appearing in a news article title can be evaluated as having higher importance than a keyword appearing in the article body. In this case, the weight of the keyword in the news article can be highly reflected by adjusting the sentence weight of the title. In this paper, the same weight was applied to keywords that appear in the title and article text. The weight for the keyword in the news article can be calculated as the sum of the keyword weights for each sentence.
In this paper, the news articles used for the analysis are weighted by keyword in the news article through the TF-ISF algorithm, and the weight for each keyword is recorded in the Terms field of Table 1. The number of occurrences of each major keyword is recorded in the Keyword_cnt field.
When the main keyword is derived, positive negative evaluation is performed based on the contents of the article using the previously constructed positive/negative dictionary. The positive/negative dictionary is composed of a list of semantic features that can be located before and after, centering on industry-specific keywords, and each semantic feature has a positive/negative tag and a value for strength as a pair. Based on the vocabulary included in the news article, a positive/negative lexico semantic pattern (LSP) [8] is established for positive or negative judgment on the industry. For example, a positive industry LSP can be defined as “@positive+*3 *2+@industry-keyword+*2.” This means a pattern in which the vocabulary combined with the positive keyword semantic features and the industrial keyword semantic features are connected. Pattern matching is performed for news articles using the established positive/negative semantic feature dictionary and industry positive/negative LSP. By using the positive/negative values of semantic features included in the extracted word pattern, the positive/negative classification and values of news articles can be derived.
2.2 Industry-Specific Keyword-Based Industry Multiple Classification
In order to classify the collected unstructured data (news articles) by industry, it is necessary to classify documents according to specific criteria. The document classifier generally uses a method of classification by applying the previously established classification standard.
Korea National Statistical Office publishes about 2000 Korean Standard Industrial Classification (KSIC) [9] based on International Standard Industrial Classification (ISIC) of United Nations Statistics Division (UNSD) [10, 11]. We classify collected news articles with the industry-specific keywords based on KSIC. The keywords of industrial classification are composed of compound nouns. We classify them into atomic words and assign different weights to each keyword. Through this process, we have constructed industry-specific index keyword dictionary for industry-specific classification of news articles. The weights of the keywords according to their importance are determined for each industry.
We calculate industry weighting for the main keywords included in the collected news articles based on the pre-processed industry keyword dictionary. Keywords included in a news article are weighted according to their importance in the article. Keyword-specific weightings of news articles are estimated based on the TF-ISF algorithm. The equation for calculating the industry classification weight of the corresponding news article based on the keyword weight of the news article and industry keyword weight is expressed as follows:
| (2) |
The news article to be analyzed is composed of the keyword , and the industry classification keyword includes the classification weight for the industry C. Therefore, the industrial classification weight of the news article is obtained by multiplying the appearance frequency of the keyword included in the news article by the industry weight of the keyword and then summing up by industry. If the industry classification weight for each news article is derived through the above process, it can be refined according to the utilization purpose. It can be filtered news articles that have a small industry impact by taking into the industry classification weight distribution of news articles. In addition, it can be used for analysis by using only the top ranking of the industry classification of the news article.
In this paper, we exclude news articles that industry classification weights are below the threshold in order to filter articles that are considered to have low influence on the industry [12]. The industry classification weighting threshold is determined by reflecting the distribution of the industrial classification weights of all articles to be analyzed. We applied the SOFTMAX function [13, 14] to only the top five industry classification weights by news articles to make the filtered news articles comparable. Table 2 shows industry-specific multiple classification results by news article.
Table 2 Result of the news article multiple classification
| News Article ID | List of Industry Classification Weight |
| 88 | C29100:0.2486/C10700:0.2486/R91100:0.1892/C33900: |
| 0.1892/J58100:0.1244 | |
| 105 | S94900:0.2290/P85600:0.2214/O84200:0.2214/M71500: |
| 0.1679/N75900:0.1603 | |
| 125 | O84100:0.3878/O84200:0.2041/R90100:0.1429/R91100: |
| 0.1429/I56100:0.1223 | |
| … | … |
| 5605766 | O84100:0.4800/M71100:0.1760/O84400:0.1280/O84200: |
| 0.1120/S94900:0.1040 |
3 Extraction of Unstructured Data-Based Industry Evaluation Indicators
The industry analysis based on unstructured data is closely related to the existing industry evaluation index based on structured data, and its impact is also great. For example, investment decisions or stock prices in the industry are often affected by sudden occurrences of events or issues, and these events or issues are generated/distributed in the form of social media such as news articles, social networks, and blogs. Despite the fact that unstructured data is an important factor in industrial evaluation, it is not utilized as an industry evaluation index due to the difficulty of quantitatively expressing information on unstructured data base. To overcome these problems, this paper proposes a new industry evaluation index that can be utilized as an industry evaluation index through unstructured data analysis.
In this paper, news articles are collected for the purpose of deriving unstructured data-based industry evaluation indicators, and the collected news articles are classified by industry into multiple categories to form monthly/industry-specific data. In order to compensate for this, there is an industry-related analysis using industry-specific keyword sets, industrial classification weights, and industry-specific keyword weights. Through the process described above, we derive monthly industry-specific interest and likability based on unstructured data classified by monthly/industry.
3.1 Industry-Specific Interest Time Series Data Extraction
Industry interest is expressed in the form of structured indicators of industry interest in the industry. Industry interest can be measured based on the frequency with which keywords are exposed to various media related to the relevant industry. In this paper, we use industrial classification weights for relevant news articles to derive interest by industry. Considering that the minimum unit of the evaluation index used by the existing evaluation agencies is monthly for the industrial evaluation, the industry interest extraction unit is monthly for the comparison with the existing index and the association analysis.
Monthly/industry interest is derived by using the weight of news articles in each industry group in the monthly news articles. The collected news articles are weighted by the weighting of the classification of five industrial groups that are likely to be classified by the industry multiple classification process. The industry classification weights for each month can be derived by summing the industry classification weights of each news article by industry. The industry-specific weighted sum of the number of news articles collected for the month is used to derive an interest indicator for each industry. The process of deriving interest indicator by monthly/industry can be expressed as follows:
| (3) |
The interest of the industry C is calculated using the sum of the classification weights for industry C for all news articles exposed for that month. The can be calculated by dividing the sum of by the total number of articles N of the month, and then multiplying by 100.
3.2 Industry-Specific Interest Time Series Data Extraction
Industry likability is expressed in the form of standardized indicator of the degree of positive/negative evaluation for the industry. Unstructured data-based likability analysis is mainly used for analyzing polarity by extracting keyword patterns in data- and opinion-based classification method considering context. In this paper, we use positive/negative classification (SentiInfo) and positive/negative value (SentiLevel) data already analyzed for each news article as in Table 1.
Monthly/industry likability is derived by using the weight of news articles in each industry group in the monthly news articles. Each news article has the top five industry classification weights, and it is possible to derive the likability of each news article for each industry by using the industrial classification weighting and article affinity index for each article. The process of deriving favorable impressions by month/industry can be expressed as follows:
| (4) |
The likability of the industry C is calculated using the sum of the value obtained by multiplying the corresponding industry classification weights , the positive/negative classification information , and the positive/negative value for all the news articles exposed in the corresponding month.
4 Predictions of Industry-Specific Risk Indicators
The existing industry evaluation service evaluates the industry considering various industrial evaluation indexes. In industrial evaluations, the analysis of industrial risks is very important. In this paper, we propose a method for predicting industrial risk indicators using industry-specific interest and likability time series data derived from unstructured data.
4.1 Industry-Specific Risk Indicators Based on Formal Data
Industrial risk analysis is used as the most important factor to predict the future of the industry based on past indicators of the industry. In the present industrial evaluation method, it is mainly used to determine the future of the relevant industry and the trend of changes in industrial grade and industrial risk factors.
Typical industrial risk factors are mainly default rate and delinquency rate. The default rate by industry is calculated based on the number of companies that have defaulted for one year based on the evaluation month among the companies included in the industry. The delinquency rate by industry is calculated based on the number of delinquent firms based on the evaluation month among the companies included in the industry. The industry default rate and delinquency rate are calculated and provided monthly.
4.2 Prediction Industry-Specific Risk Indicators
Important indicators of industrial risk evaluation, such as default rate and delinquency rate, have characteristics that change from past financial information that is aggregated/released annually. Therefore, in order to predict current industry-specific risk, information that reflects current industry conditions is needed, and there must be a correlation between the indicators that represent the present state of the industry and the existing industry risk evaluation indicator [15, 16]. Industrial interest and likability, which are industrial evaluation indicators based on unstructured data proposed in this paper, are good indicators of current industrial conditions. It can be used to predict industrial risk through correlation analysis with existing industrial risk assessment index. In this paper, we predict industry default rate and delinquency rate, which are indices of industry risk, by using monthly industry interest and likability, which are industrial indicators derived from unstructured data analysis.
In this paper, we derive the monthly time series data of industrial interest and likability based on unstructured data collected by industry. Cross-correlation analysis is performed to analyze the correlation between derived indices of interest, likability, default incidence, and delinquency rate, and the time difference between each index is derived. In order to analyze the time series data, it is necessary to verify whether the target time series data is stable time series [21]. If the time series data to be analyzed is not stable, it is possible that the time difference derived from the analysis results may contain errors, which may affect the prediction result of the industry evaluation indicators reflecting the time difference. Therefore, we verify the stability of time series data by unit root test and autocorrelation analysis before performing cross-correlation analysis and stabilize analytical data by using difference and/or log operation for unstable time series data [17, 18]. After then, cross-correlation analysis is performed to analyze the time lag between stabilized time series data of each industry [19, 20]. Cross-correlation function (CCF) is expressed as follows:
| (5) |
where is cross-covariance of time series data with time lag . and mean time series data and at time point and , respectively. and represent the average of time series data and , respectively. When cross-correlation analysis between risk indicators of each industry is completed, time lags between indicators can be derived. The time lag between the indicators can be obtained from where is the maximum. The derivation process is represented as follows:
| (6) |
The derived time lag denotes a time difference between time series data and , and a preceding/following relationship between each time series data is determined according to the negative/positive sign of . In the case of , it means that is preceded by . If , and are accompanied, and if , is followed by . If industry interest and likability precede the industry default rate and delinquency rate, it means that it is reflected in unstructured data such as news articles at a certain time difference before being reflected in the risk indicator of the relevant industry.
The industrial risk indicators are predicted through multiple regression analysis [22] with industrial interest, likability, default rate, and delinquency rate, which are derived monthly. Before performing the multiple regression analysis, the time series data for each indicator are corrected by reflecting the time lag derived for each indicator. This makes it possible to predict the industrial risk indicators reflecting correlation between each indicator. We limit industrial risk predictable industries to those where industrial interest and likability derived from unstructured data precede industry default rate and delinquency rate derived from structured data. When the time lag between industry-specific risk indicators is derived, we generate analytical datasets for predicting industrial risk indicators, reflecting the time lags derived.
We use multiple regression to predict industry-specific risk indicators, using industry default rate and delinquency rates as the target variables and industry interest and likability as explanatory variables based on the analytical datasets generated by each industry [23]. The multiple regression analysis assumes that the explanatory variable is more than two and linearly related to the objective variable. It also has the advantage of minimizing the error term by additional explanatory variables in the simple regression analysis. The multiple regression model applied in this paper is expressed as follows:
| (7) |
where is the target variable at time t, which means the expected default rate or delinquency rate of the industry, and is derived from multiple regression model learning and is a slice value of a linear function expressing . is the explanatory variable of the linear function expressing at time t and is the slope value derived from model learning based on the interest of the industry. is the slope value derived from the likability of the industry. is the error term of the multiple regression model at time t. The resulting multiple regression model is finalized through a regression equation fit, regression test (F-test), and significance test (p-value) using decision coefficients .
After the multiple regression model is developed using the time series data of the collected industrial evaluation indicators, the industry default rate and delinquency rate can be predicted by using the industry interest and likability. Using the industry-specific prediction model proposed in this paper, it is possible to predict the future rate of industrial default rate and/or delinquency rate, which are derived by using the time lag between interest and favorability of the industry at present.
5 Experimental Results and Discussion
The industrial risk analysis proposed in this paper aims to predict the incidence of industrial defaults and delinquency rates, which are used as indicators of existing industrial risks, based on industry interest and likability monthly time series data derived from unstructured data.
To analyze risk indicators by industry, we analyzed time series data of interest, likability, default rate, and delinquency rate of 38 industries. For the analysis, the dataset was constructed based on the risk indicators (default rate and delinquency rate) of each industry from July 2013 to September 2017 (51 months) and 3,933,639 news articles during the same period. We used data from July 2013 to March 2017 (45 months, 3,328,978 news articles) to analyze the time difference between the indicators by industry and construct a model learning dataset by reflecting the derived time difference between the indicators. The time difference between industry-specific indicators can occur up to 12 months. Therefore, training data of at least 24 months or longer is required for model training proposed in this paper.
First, we performed multiple classifications of the news articles by industry and derived interests and likability of each industry based on industry multiple classification weights. This process generates monthly industry-specific time series data. Time series data analysis begins with the assumption that the target time series data is stable. Therefore, the stability of the time series data to be analyzed is verified, and in the case of unstable time series data, the data is stabilized through techniques such as difference, log, and log difference. In this paper, we tested the trend and covariance of time series data through the autocorrelation analysis (ACF) method and tested the stability of the data through the united root test (ADF: augmented Dickey-Fuller). After that, we derived the time lag between each indicator through cross-correlation analysis using the data converted into stable time series data.
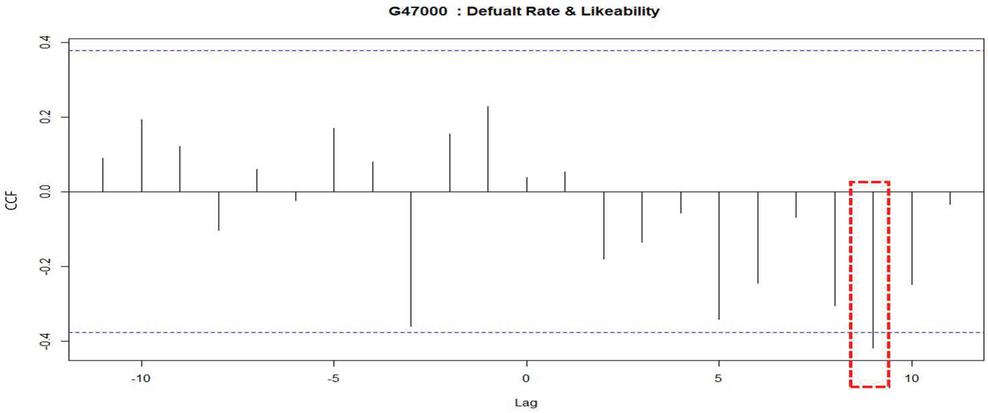
Figure 1 CCF results of default rate and interest (G47000).
Figure 1 shows the correlation coefficient by cross-correlation analysis on the default rate and likability of “Retail business industry (G47000).” This means that the interest and default rate of this industry has a time difference of 9 months, which can be estimated that the interest of this industry affects the default rate after 9 months. We derived the time lag between the indicators through cross-correlation analysis of interest, likability, default rate, and delinquency rate for 38 industries.
Table 3 Time lag between indicators of each industry
| Industry | ||||
| Code | Default x Interest | Default x Likability | Delinq. x Interest | Delinq. x Likability |
| A01000 | 5 | 8 | 2 | NA |
| C10000 | 2 | 9 | 10 | 9 |
| C20000 | NA | 5 | 0 | NA |
| C25000 | 6 | NA | 7 | 9 |
| C28000 | 4 | 6 | NA | 10 |
| C29000 | NA | 2 | NA | NA |
| F42000 | NA | 0 | NA | 6 |
| G46000 | 6 | 0 | 10 | 10 |
| G47000 | 3 | 9 | NA | 1 |
| H49000 | 1 | 6 | 3 | 2 |
| I56000 | 3 | NA | 3 | 10 |
| J63000 | NA | NA | 5 | NA |
| K64000 | NA | 10 | NA | 8 |
| K65000 | 6 | NA | 2 | 6 |
| K66000 | NA | 9 | 7 | 0 |
| M70000 | NA | NA | 9 | NA |
| M72000 | NA | NA | NA | 5 |
| M73000 | NA | 2 | 10 | 5 |
| N75000 | 5 | 12 | NA | NA |
| P85000 | NA | 11 | NA | 8 |
| Q86000 | 1 | NA | 9 | NA |
| Q87000 | NA | NA | 3 | NA |
| S95000 | 8 | 8 | 11 | NA |
As shown in Table 3, cross-correlation analysis was performed for 38 industries, and as a result of analysis, industries with absence of time lag or zero-time lag were removed. Finally, we summarized only 23 industries where there exists time lag between indicators. An absence of time lag means that all cross-correlation coefficients exist below the threshold as shown in Figure 2. A zero-time lag means that two indicators move in the same form without time difference. In this case, there exists a correlation between the two indicators, but it means that no prediction is possible for the future. In addition, when the time lag is positive, it means that the objective variables (default rate and the delinquency rate) are followed by the explanatory variables (interest and likability). Therefore, when the time lag is positive, the explanatory variable may be used to predict the future of the objective variable by the time lag.
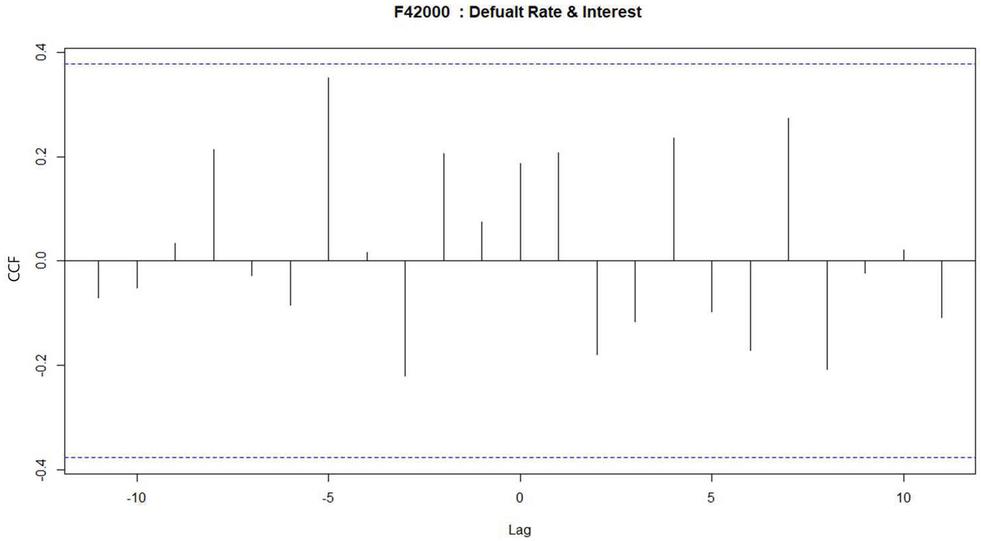
Figure 2 Case of an absence of time lag (F42000).
After refining the time series data by reflecting the analyzed time lag of each industry evaluation indicator, multiple regression analysis [22] was performed to predict the default rate and the delinquency rate as industrial risk indicators. We performed model learning based on the lag-corrected data from July 2013 to March 2017 (45 months, 3,328,978 news articles) and predicted industry-specific risk factors for the six months from April 2017 to September 2017 (6 months, 604,661 news article) using the learned multiple linear regression model. We could obtain meaningful results for 11 industries as a result of multiple linear regression.
In order to evaluate the performance of the industry-specific risk indicator prediction, we compared the predicted value with the actual measured value. We have calculated the monthly error rate by comparing the risk indices (default rate and delinquency rate) with the actual values and predicted results for each industry and verified the mean absolute percentage error (MAPE) based on them. Table 4 shows the results of calculating.
Table 4 Prediction of industry-specific risk indicators
| Mon ICode | 2017.04 | 2017.05 | 2017.06 | 2017.07 | 2017.08 | 2017.09 | MAPE |
| C10000 | 0.6059 | 0.1325 | 0.0314 | 0.1438 | 0.0001 | 0.1587 | 0.1787 |
| G47000 | 0.1734 | 0.1417 | 0.3118 | 0.0280 | 0.0948 | 0.0340 | 0.1306 |
| H49000 | 0.4624 | 0.2120 | 0.3530 | 0.3988 | 0.3419 | 0.8487 | 0.4361 |
| I56000 | 0.3287 | 0.2724 | 0.3379 | 0.2234 | 0.3109 | 0.2205 | 0.2823 |
| I56000 (DR) | 0.0745 | 0.6341 | 0.6923 | 0.3184 | 0.0444 | 0.1849 | 0.3248 |
| K64000 | 0.0651 | 0.1824 | 0.5619 | 0.6356 | 0.6435 | 0.4495 | 0.4230 |
| K66000 | 0.0182 | 0.5483 | 0.2765 | 0.0491 | 0.4230 | 0.4621 | 0.2962 |
| M72000 | 0.1683 | 0.5986 | 0.6176 | 0.5374 | 0.6085 | 0.4412 | 0.4953 |
| M73000 | 0.2327 | 0.0243 | 0.1024 | 0.8132 | 0.2223 | 0.3529 | 0.2913 |
| M73000 (DR) | 0.0976 | 0.5929 | 0.2455 | 0.7947 | 0.3141 | 0.4559 | 0.4168 |
| P85000 | 0.2420 | 0.0350 | 0.4894 | 0.1395 | 0.1338 | 0.4288 | 0.2447 |
Table 4 shows the results of predicting the industrial risk indicators for 6 months by applying the industry-specific risk prediction model and comparing the difference with the actual measured value by MAPE value. The industry with the highest error rate was “Other scientific and technical services industry (M72000)” and the industry with the lowest error rate was “Retail industry (G47000).” The average error rate for all industries was 32%.
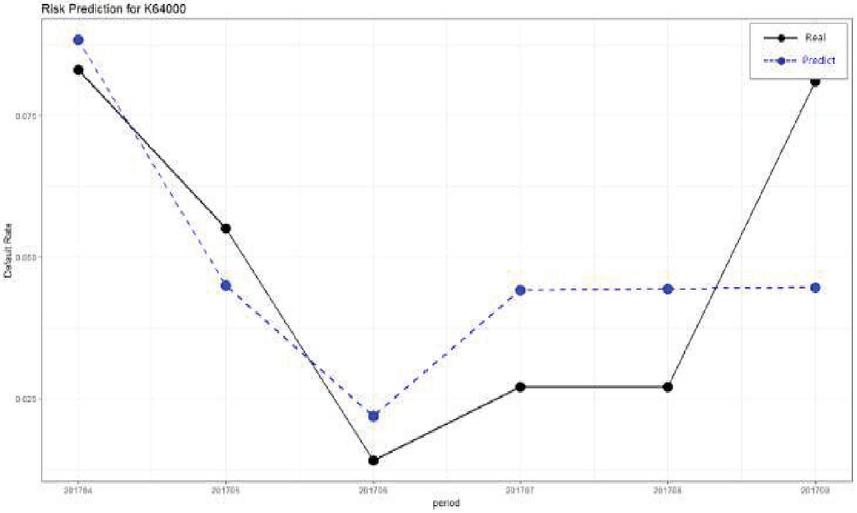
Figure 3 Comparison of the actual and predicted values by industry (K64000).
Figure 3 shows the comparison between the measured values and predicted values for “Financial industry (K64000).” In the case of an industry where there are relatively many news articles compared to other industries such as “Financial industry (K64000),” the predicted results show a similar waveform to the measured values.
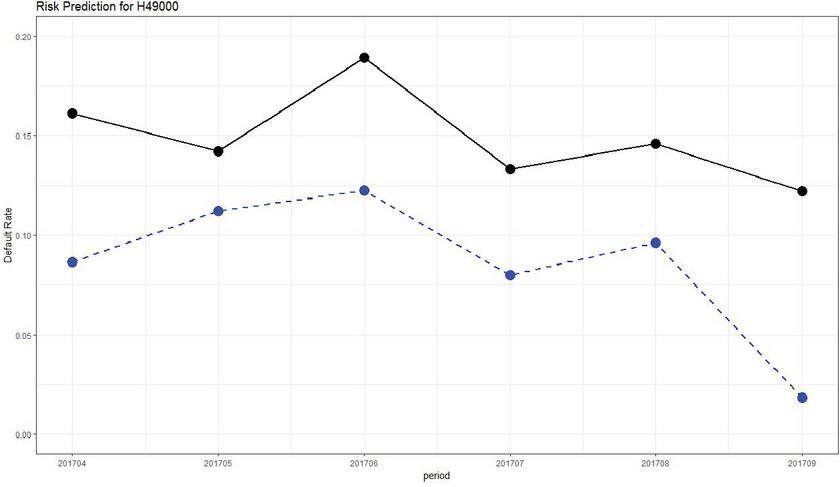
Figure 4 Comparison of the actual and predicted values by industry (H49000).
“The land transportation and pipeline transportation industry (H49000),” which had a relatively high error rate compared to other industries, is predicted lower than the actual value. However, as shown in Figure 4, the waveforms of the graphs remained similar to actual measurements.
Also, we use autoregressive integrated moving average (ARIMA) model [24, 25], which is widely used as a conventional time series forecasting method, to predict the risk indices of industry using the same data for the same period. And the prediction results are compared with those predicted by the proposed method.
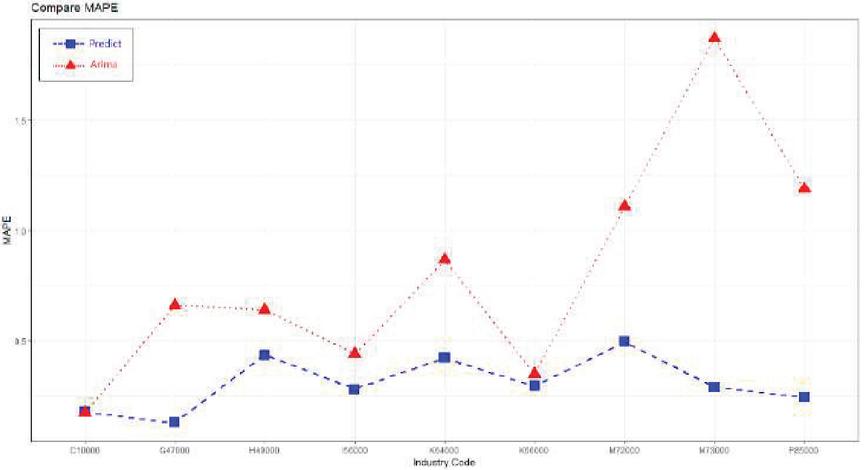
Figure 5 The proposed method and ARIMA prediction comparison (MAPE).
Figure 5 shows the results of comparing MAPE of two models. The proposed method of predicting industrial risk is 32% of average MAPE and the method using ARIMA model is 67.4% of average MAPE. The proposed industrial risk prediction method has about 2 times better performance than the ARIMA model.
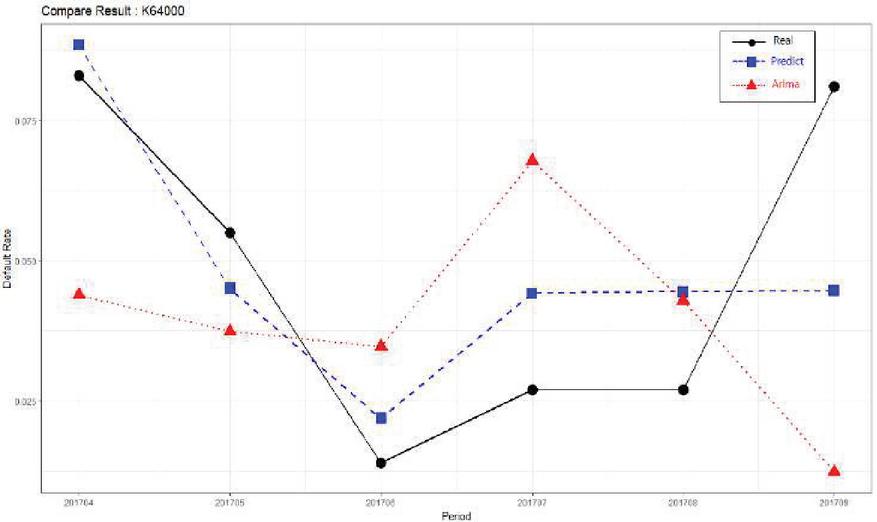
Figure 6 Comparison of industry risk prediction results (K64000).
As shown in Figure 6, we compare the actual measured value results of the default rate of “Financial industry (K64000)” with those predicted using the two models. We can see that the proposed method shows better performance than the ARIMA model.
6 Conclusion
In this paper, we classify the collected news articles into multiple categories and assign classification weightings according to the industry so that they can be reflected in the industries that one news article may affect. Based on the multiple classified news articles, we derive the industry-specific keywords and derive the monthly industry time series data of industry interest and likability as new industrial evaluation indicators. Based on industry interest and likability time series data, we have predicted industry default rate and delinquency rate, which are industrial risk factors based on structured data. We conducted a cross-correlation analysis of interest, likability, default rate, and delinquency rate for industrial risk prediction to derive the time lag between industry indicators for each industry. We calibrated the analytical data reflecting the time lag between industry indicators of each industry and predicted the industrial default rate and delinquency rate, which are industrial risk indicators, through multiple regression analysis.
In this paper, we propose a method for predicting the industry-specific risk indicators used in existing industry evaluation based on unstructured data. In addition, the proposed industrial risk prediction method has better performance than the ARIMA model, which is a conventional time series data-based prediction model.
We will study how to improve the performance of industry multiple classification schemes for unstructured data, which has an impact on the accuracy of industry risk prediction methods proposed in this paper. And we plan to study on various industrial risk indicator prediction models.
Acknowledgement
This work was supported by the Technology Innovation Program (20000195, Development on the BigData analysis platform technology for IoT home appliance product of small and medium sized home appliance company) funded by the Ministry of Trade, Industry & Energy (MOTIE, Korea).
References
[1] A. Li, K. Chen, H. Song, Y. Lei, ‘The Industry Data Analysis Processing Model Design’, International Conference on Cloud Computing and Big Data, 2014.
[2] R. P. Schumaker, H. Chen, ‘Textual Analysis of Stock Market Prediction Using Breaking Financial News’, ACM Transactions on Information Systems, Vol. 27, No. 2, 2009.
[3] M. L. Mitchell, J. H. Mulherin, ‘The Impact of Public Information on the Stock Market’, The Journal of Finance, Vol. XL, No. 3, 1994.
[4] M. A. Mittermayer, G. F. Knolmayer, ‘NewsCATS: A News Categorization And Trading System’, Proceedings of the International Conference in Data Mining, 2006.
[5] A. Esuli, F. Sebastiani, ‘Page Ranking WordNet Synsets-An Application Opinion Mining’, Proceedings of the 45th Annual Meeting of the Association of Computational Linguistics, pp. 424–431, 2007.
[6] A. Guo, T. Yang, ‘Research and Improvement of Feature Words Weight based on TFIDF Algorithm’, IEEE Information Technology, Networking, Electronic and Automation Control Conference, pp. 415–419, 2016.
[7] X. Wang, J. Cao, Y. Liu, S. Gao, X. Deng, ‘Text Clustering based on the Improved TFIDF by the Iterative Algorithm’, IEEE Symposium on Electrical &Electronics Engineering, pp. 140–143, 2012.
[8] Mohamed Hamroun, Mohamed Salah Gouider, Lamjed Ben Said, ‘Lexico Semantic Patterns for Customer Intentions Analysis of Microblogging’, International Conference on Semantics, Knowledge and Grid, 2015.
[9] J. Cha, D. Lee, ‘Korean Standard Statistical Classification’, http://kssc.kostat.go.kr/ksscNew\_web/ekssc/main/main.do, accessed March. 2018.
[10] United Nations Statistics Division, ‘International Standard Industrial Classification of All Economic Activities Rev.4’, https://unstats.un.org/unsd/cr/registry/regcst.asp?Cl=27, accessed March. 2018.
[11] UN, ‘Handbook of input-output table compilation and analysis’, 1999.
[12] A. Lendasse, J. Lee, E. Bodt, V. Wertz, M. verleysen, ‘Input Data Reduction for the Prediction of Financial Time Series’, European Symposium on Artificial Neural Networks, pp. 237–244, April 2001.
[13] H. Rajaguru, S. K. Prabhakar, ‘Analyzing Dimensionality Reduction with Softmax Discriminant Classifier for Epilepsy Classification’, International Conference on Communication and Electronics Systems, pp. 565–568, 2017.
[14] H. Rajaguru, S. K. Prabhakar, ‘Softmax Discriminant Classifier for Detection of Risk Levels in Alcoholic EEG Signals’, International Conference on Computing Methodologies and Communication, pp. 989–991, 2017.
[15] M. Santini, A. Tettamanzi, ‘Genetic Programming for Financial Time Series Prediction’, European Conference EuropGP, pp. 361–370, 2001.
[16] R. P. Schumaker, H. Chen. ‘A Discrete Stock Price Prediction Engine based on Financial News’, COPMUTER-IEEE Computer Society, vol. 43, no. 2, pp. 51–56, 2010.
[17] X. Yp, ‘Applying Modified KMV Model to Analyze the Credit Risk of Listed Firms in Chinese Cement Industry’, International Conference in Management Science & Engineering, pp. 983–989, 2012.
[18] N. G. Pavlidis, D. K. Tasoulis, M. N. Vrahatis, ‘Time Series Forecasting Methodology for Multiple-Step-Ahead Prediction’, Computational Intelligence, pp. 456–461, 2005.
[19] D. Ye, J. Lu, X. Zhu, H. Lin, ‘Generlized Cross Correlation Time Delay Estimation Based on Improved Wavelet Threshold Function’, International Conference on Instrumentation & Measurement, Computer, Communication and Control, pp. 629–633, 2016.
[20] W. Max-Moerbeck, J. L. Richards, T. Hovatta, V. Pavlidou, T. J. Pearson, A. C. S. Readhead, ‘A Method for the Estimation of the Significance of Cross-Correlations in Unevenly Sampled Red-Noise Time Series’, Monthly Notices of the Royal Astronomical Society, Vol. 445, pp. 437–459, 2014.
[21] N. G. Pavlidis, D. K. Tasoulis, M. N. Vrahatis, ‘Time series forecasting methodology for multiple-step-ahead prediction’, Computational Intelligence, 2005, pp. 456–461.
[22] T. Teoh, S. Cho, Y. Nguwi, ‘Emotional Prediction using Time Series Multiple-Regression Genetic Algorithm for Autistic Syndrome Disorder’, International Conference on Computer Science & Education, pp. 9–12, 2012.
[23] R. Gonzalez, C. A. Catania, ‘Time-Delayed Multiple Linear Regression for Increasing MEMS Inertial Sensor Performance by using Observations from a Navigation-Grade IMU’, IEEE/ION Position, Location and Navigation Symposium, pp. 15–20, 2016.
[24] B. Siregar, E. B. Nababan, A. Yap, U. Andayani, Fahmi, ‘Forecasting of Raw Material needed for Plastic Products based in Income Data using ARIMA Method’, International Conference on Electrical, Electronics and Information Engineering, pp. 135–139, 2017.
[25] Z. Zhao, C. Wang, M. Nokleby, C. J. Miller, ‘Improving Short-Term Electricity Price Forecasting using Day-Ahead LMP with ARIMA Models’, IEEE Power & Energy Society General, pp. 1–5, 2017.
Biographies

Kyungwon Kim received the B.S. and M.S. degrees in computer science and engineering from Hankuk University of Foreign Studies, Seoul, Korea, in 2001 and 2003, respectively, and the Ph.D. degree in computer, information and communications engineering from Konkuk University, Seoul, Korea, in 2018. He has been a Managerial Researcher with Korea Electronics Technology Institute, Seoul, Korea, since 2004. His current research interests include the unstructured data analysis and data inference modeling.

Kyoungro Yoon received the B.S. degree in computer and electronic engineering from Yonsei University, Seoul, Korea, in 1987, the M.S.E. degree in electrical engineering/systems from the University of Michigan, Ann Arbor, MI, USA, in 1989, and the Ph.D. degree in computer and information science from Syracuse University, Syracuse, NY, USA, in 1999. He was a principal researcher and a group leader at the Mobile Multimedia Research Lab, LG Electronics Institute of Technology from 1999 to 2003. He joined the school of Computer Science and Engineering in 2003 as an Assistant Professor and became a full Professor in 2012. He has been with the Department of Smart ICT Convergence, since 2017. He served as a Co-chair of Ad Hoc Group on User Preferences and the Chair of Ad Hoc Group on MPEG Query Format and Ad Hoc Group on MPEG-V of ISO/IEC JTC1 SC29 WG11 (a.k.a. MPEG). He also served as the Chair of the Metadata Subgroup and JPSearch Ad Hoc Group of ISO/IEC JTC1 SC29 WG1 (a.k.a. JPEG). He is serving as an Editor of various international standards such as ISO IS 15938-12, 23005-2, 23005-5, 23005-6, 24800-3, 24800-5, and 24800-6. His main research interests include smart media system, image processing, and multimedia information and metadata processing.
Journal of Web Engineering, Vol. 20_3, 795–816.
doi: 10.13052/jwe1540-9589.20311
© 2021 River Publishers